Initial Ventilator Settings
Learning Objectives
On completion of this chapter, the reader will be able to do the following:
1 Calculate tubing compliance.
2 Determine volume loss caused by tubing compliance.
3 Calculate minute ventilation given a patient’s respiratory rate and tidal volume.
5 Select an appropriate flow rate and pattern.
7 Identify the source of the problem when an inspiratory pause cannot be measured.
 , tidal volume, respiratory frequency, and positive end-expiratory pressure settings based on the patient’s lung pathology, body temperature, metabolic rate, altitude, and acid-base balance.
11 Identify a problem in pressure support ventilation from a pressure-time graph.
13 List the possible causes for a change in pressure during pressure-regulated volume control.
14 Identify the mode of ventilation based on the trigger, target, and cycle criteria.
Key Terms
• Compressible volume
• Mechanical dead space
• Overinflation
• Tubing compliance
The most common reason for instituting mechanical ventilation is to treat respiratory distress in patients who are unable to achieve effective gas exchange.1 This goal can be accomplished by setting an appropriate tidal volume (VT) and respiratory rate or frequency (f) to achieve a desired minute ventilation ( ). This chapter examines how
  and related variables are set during the initiation of volume ventilation and then focuses on the settings required to initiate pressure ventilation.
Determining Initial Ventilator Settings During Volume-Controlled Ventilation
Initiating volume-control ventilation for a patient requires an understanding of the interaction of several key variables, including  settings (VT and f), inspiratory gas flow, flow waveform, inspiratory to expiratory (I : E) ratio, pressure limit, inflation hold (inspiratory pause), and inspiratory pressure and positive end-expiratory pressure (PEEP).
The design characteristics of mechanical ventilator control panels can vary. For example, many have VT and rate settings, such as the Puritan Bennett 840 (Covidien-Nellcor and Puritan Bennett, Boulder, Colo.), whereas other ventilators, such as the Servoi (Maquet Inc, Wayne N.J.), allow the operator to set  and f. Some ventilator manufacturers provide time cycling and have controls for inspiratory time percentage, and still others control total cycle time (TCT).
It is important for clinicians charged with the responsibility of instituting mechanical ventilation to have a fundamental understanding of the various control variables available on current intensive care unit (ICU) ventilators. Then, regardless of the ventilator involved, they will possess enough information to make an informed decision about how to proceed. The following discussion begins with the basics:  , VT, and f.
Initial Settings During Volume-Controlled Ventilation
Setting Minute Ventilation
The primary goal of volume-controlled continuous mandatory ventilation (VC-CMV) is to achieve a  that matches the patient’s metabolic needs. A typical healthy person at rest has a total oxygen consumption (
 ) of about 250 mL/min and a carbon dioxide production (
 ) of about 200 mL/min. As the patient’s metabolic rate increases, ventilation must change to meet the need for increased oxygen uptake and CO2 removal (Box 6-1).
Box 6-1
Determining Pressure, Tidal Volume, Respiratory Frequency, and Minute Ventilation to Establish Initial Ventilator Settings for Volume and Pressure Ventilation
Volume-Control Ventilation
Minute Ventilation ( )
)
Men  = 4 × body surface area (BSA)
Women  = 3.5 × BSA
Increase This By
Decrease This By
Tidal Volume (VT)
Respiratory Frequency (f)
 /VT
/VTPressure Ventilation
Pressure Support Ventilation (PSV)
To overcome system resistance in the spontaneous mode (PSV or continuous positive airway pressure [CPAP]) or in the IMV/SIMV mode, set pressure at peak inspiratory pressure (PIP) − pressure plateau (Pplateau) where Pplateau is measured in a volume breath or at approximately 5 to 10 cm H2O. To provide ventilatory support, set pressure to achieve a target VT as described for volume-controlled ventilation.
Pressure-Control Ventilation (PC-CMV)
Set pressure to achieve VT as described for VC-CMV. Set frequency to achieve same  . f =
. f =  /VT.
/VT.
Set inspiratory percentage to achieve an inspiratory/expiratory (I/E) ratio of greater than or equal to 1 : 2.
Metabolic rate is directly related to body mass and surface area in humans. Measurements of heat production (i.e., direct calorimetry) provide a reliable method to quantify metabolic rate; however, direct calorimetry requires a considerable amount of space and time commitment and is typically reserved for research purposes. Indirect calorimetry, which uses measurements of inspired and expired O2 and CO2 to estimate energy expenditure, can be accomplished with significantly less time and effort. Indeed, advances in computer technology have made it relatively easy to perform indirect calorimetry in the clinical setting. For example, the GE Carestation (GE Healthcare, UK) has this technology incorporated into the ventilator’s design, making it possible for the clinician to monitor continuously the  and
and  at the bedside. (See Chapter 10 for more information about indirect calorimetry.)
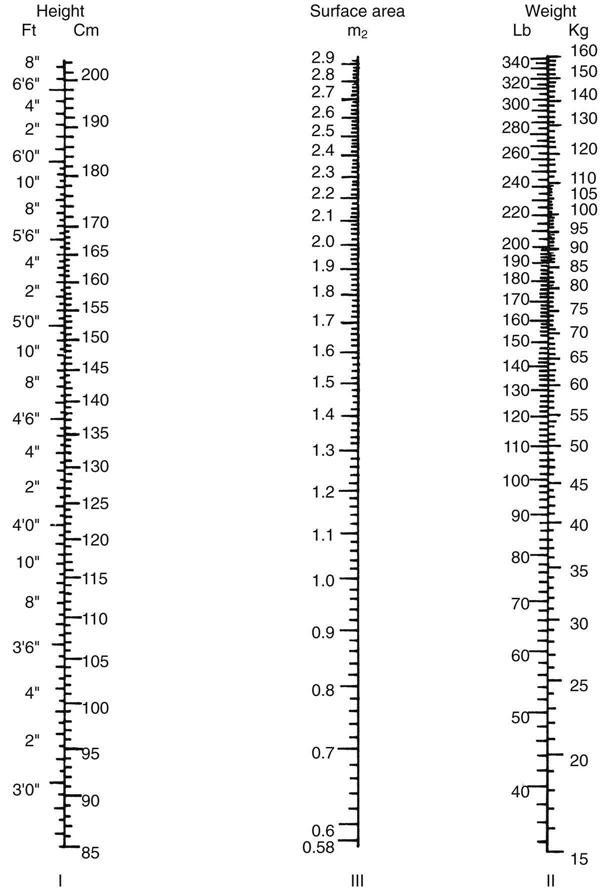
A more commonly used method to estimate metabolic rate and caloric intake involves using equations that were derived from laboratory studies performed in the early part of the twentieth century by scientists like Harris and Benedict. With these equations, metabolic rate is estimated on the basis of an individual’s gender and body surface area (BSA).2 BSA can be calculated using the DuBois BSA formula: BSA = 0.007184 × Ht0.725 × W0.425, where BSA = body surface area in square meters, Ht = body height in centimeters, and W = body weight in kilograms. It can also be determined using a nomogram like the one shown in Fig. 6-1. Notice that this nomogram is based on the aforementioned DuBois BSA formula.
As shown in Box 6-1,  can also be estimated using a patient’s BSA. For example, what is the estimated
  for an adult male who is 6 feet tall and weighs 190 pounds and has a BSA of 2.1 m2
  is approximately equal to four times the BSA in men and three and a half times the BSA in women. The estimated
  for this individual would be

Notice that this calculation of  assumes that the individual is a typical healthy adult and
  must be adjusted for abnormal conditions, such as the presence of hypothermia or hyperthermia, hypermetabolism, and metabolic acidosis. Lung disorders that increase physiological dead space will also require an increase in
  .2 For example, suppose that the patient already mentioned requires an initial
  of 8.4 L/min but has a temperature of 39° C.
  would have to be increased by 10% for each degree above 37°: a total increase of 20% of 8.4 = 1.68; therefore, the new
  would be 8.4 + 1.68 = 10.08 L/min.
Settings for VT and f should therefore be derived from the initial calculation of  (4 × BSA for men and 3.5 × BSA for women) and adjusted if the patient demonstrates a pathological condition like those mentioned above. VT can be determined by the method described in the discussion that follows. To determine breathing frequency (f), divide the
  by the VT (VE/VT = f) (Case Study 6-1).
 Case Study 6-1
Minute Ventilation ( ) Needs
A physician orders a tidal volume (VT) of 600 mL and a rate of 10 breaths/min for a 25-year-old woman with a body surface area of 2.0 m2. The estimated  will be: 3.5 × 2.0 = 7.0 L/min. What is the ordered
  compared with the estimated
  needed? If you were the respiratory therapist in this situation, how would you address the discrepancy between the physician’s order and the actual
  required?
See Appendix A for the answers.
In many cases, physicians order settings for mechanical ventilation that include volume and rate and do not typically specify  . The respiratory therapist must keep in mind that the ordered rate and volume must reflect the
  needs of the patient.
Tidal Volume and Rate
The normal spontaneous VT for a healthy adult is about 5 to 7 mL/kg with a spontaneous respiratory rate of 12 to 18 breaths/min.  is about 100 mL/kg of ideal body weight (IBW).3 Box 6-2 provides formulae that can be used to calculate IBW.3
When determining VT for ventilated patients, a range of 5 to 8 mL/kg of IBW is typically used for adults and 4 to 8 mL/kg IBW for infants and children4–6 Lower VT rates (e.g., 4 mL/kg IBW) have been successfully used to ventilate the lungs of adult patients with acute respiratory distress syndrome (ARDS). These lower VT rates are described as protective strategies that minimize the damaging effects associated with overdistention of the alveoli.7
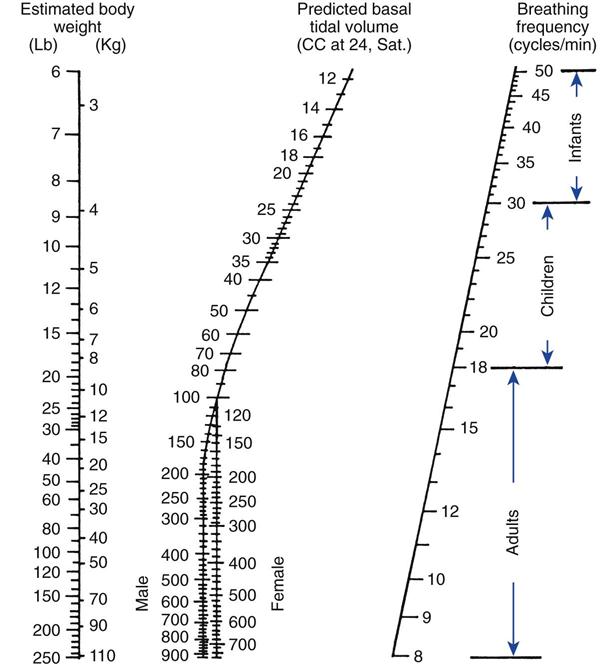
It is important to understand that an adult’s lungs do not get larger as he or she gains weight. For example, a 5 ft 6 in. adult male weighing 100 kg would require the same VT as a 5 ft 6 in. adult male weighing 65 kg. Remember, however, that a heavier patient would have a higher metabolic rate and thus a higher  . Critical Care Concept 6-1 provides an example of how to estimate tidal volumes based on IBW (Key Point 6-1). The Radford nomogram (Fig. 6-2) uses VT in a range of about 5 to 7 mL/kg IBW and provides a rapid method for obtaining approximate ventilator settings8 (Case Study 6-2).
 Critical Care Concept 6-1
Tidal Volume (VT) and Ideal Body Weight (IBW)
What is the lowest and highest estimated VT for a 5 ft 6 in. tall man (IBW = 65 kg)? What would the lowest and highest estimated tidal volume be for a 5 ft 6 in. woman?
See Appendix A for the answers.
 Key Point 6-1
A person’s tidal volume increases linearly with body weight up to that person’s ideal body weight.
 Case Study 6-2
Minute Ventilaion ( ), Tidal Volume (VT), and Respiratory Rate
A 6-ft. (72 in.)-tall man weighs 190 lb and has a normal metabolic rate, temperature, and acid-base status. What are his body surface area and ideal body weight? What  , VT, and rate would be appropriate for this patient?
See Appendix A for the answers.
An alternative method for calculating initial VT settings is to use predicted values for body weight rather than calculations of IBW. The predicted body weight of male patients can be calculated using the following equation: 50 + 0.91 (centimeters of height—152.4). For female patients the predicted body weight can be determined using the following equation: 45.5 + 0.91 (centimeters of height × 152.4).7
Recommended tidal volumes for ventilated patients vary depending on the lung pathology. For patients with normal lungs, such as patients with a drug overdose or patients with the postoperative effects of anesthesia, an initial VT of 5 to 7 mL/kg and a rate of 10 to 20 breaths/min is generally accepted.3 (Note: A current trend is to use VT in the normal spontaneous VT range of 5 to 8 mL/kg IBW. The medical literature indicates that this range as an acceptable setting.) In patients with chronic obstructive pulmonary disease (COPD) and asthma in which airway obstruction and resistance are high, an initial VT of 8 to 10 mL/kg with a rate of 8 to 12 breaths/min is acceptable.3,12–14 In patients with chronic or acute restrictive disease, such as pulmonary fibrosis or ARDS, an initial VT of 4 to 6 mL/kg with a rate of 15 to 25 breaths/min is indicated.7 As suggested, in restrictive disease, lower VT and higher rates are used. However, high rates may not provide sufficient time for exhalation (short TE), and air can be trapped in the lungs at the end of exhalation, resulting in intrinsic PEEP (auto-PEEP).15 The VT should be adjusted to maintain plateau pressure less than 30 cm H2O and rates adjusted to minimize auto-PEEP.
A VT of more than 9 to 10 mL/kg is not recommended because of the risk of high pressures and accompanying overdistention and trauma to the lung, as well as other complications. Low volume settings (4-8 mL/kg) are beneficial in restrictive disease and may help prevent high pressures and alveolar overdistention. It is worth mentioning that using volumes as low as 4 mL/kg may contribute to atelectasis. Using tidal volumes this low may require PEEP or sigh breaths to avoid atelectasis. (See Chapters 7 and 13 for additional information.) Use of lower VT may be especially important in patients receiving PEEP therapy to avoid high pressures and overdistention16,17 (Key Point 6-2). Box 6-3 provides some important background on how initial VT settings were selected for this text.3,7,9–14 Chapter 13 provides more information on managing patients with PEEP.
 Key Point 6-2
When setting tidal volume (VT) and rate, the goal is not to focus so much on the exact VT and rate but to focus on using settings that do not harm the patient. Maintaining plateau pressure lower than 30 cm H2O is very important. In some cases it may even be necessary to let PaCO2 rise and pH fall outside the patient’s normal values to avoid lung injury.1
Tubing Compliance
The VT set on the ventilator control panel represents the amount of gas sent to the ventilator circuit; however, not all of this volume reaches the patient. Some of the gas volume will be not be delivered to the patient because of leaks and the effects of tubing compliance.
The tubing compliance (CT), or system compressibility, reflects the volume (in milliliters) of gas compressed in the ventilator circuit for every centimeter of water pressure generated by the ventilator during the inspiratory phase: CT = change in volume divided by change in pressure (ΔV/ΔP) in mL/cm H2O.
As pressure builds in the ventilator circuit during inspiration, the circuit expands along with the patient’s lungs; therefore, the total volume that goes to the circuit never reaches the patient. As expiration begins, the volume of gas trapped under pressure in the patient circuit flows out the expiratory valve with the air that leaves the patient’s lungs. This volume is often referred to as the exhaled VT.
The volume of gas in the circuit is referred to as the compressible volume, or the volume lost as a result of CT. The compressible volume varies depending on the type of circuit used and is determined for each ventilator system before its use. Calculating compressible volume is especially important in infants, children, or very small patients because of the small VT they require. A slight change in tidal volume may be insignificant for an adult, but it can be critical for an infant during mechanical ventilation. Thus, practitioners routinely use small-bore, rigid circuits with infants because these types of circuits are not very compliant. These ventilator circuits typically have low CTs and therefore have low compressible volumes. (NOTE: CT for a patient’s circuit changes slightly as the circuit warms, but this amount is usually not significant.)
Current ICU ventilators (e.g., Hamilton G5 [Hamilton Medical, Swtizerland], the Servoi, Dräger 500 [Drager Medical Inc, Telford, Pa.], and CareFusion AVEA [CareFusion, Yorba Linda, Calif.]) have the capability of measuring and correcting for CT. During startup tests of the system, these ventilators calculate the compressibility of the ventilator circuit. The operator can choose to use this correction or simply ignore it. If correction for CT is accepted, the ventilator measures the peak pressure during ventilation, calculates the volume lost to the patient circuit, and adds that volume to the set VT. When the data are displayed on the ventilator, the exhaled VT measured again corrects for CT. For example, if the set VT is 500 mL and the loss of volume will be 50 mL, the ventilator actually delivers 550 mL, although it displays 500 mL as VT inspired and 500 mL of VT expired. The operator never actually “sees” the correction being made. It is important to recognize that ventilators perform this function in different ways. Therefore, the clinician should understand how this function operates for the ventilator being used.
If a ventilator without this capability is being used, calculation of CT can be determined during initial setup by doing the following procedure prior to connecting the patient to the ventilator:
1 Confirm there are no leaks in the circuit.
2 Set a low VT (100-200 mL), set PEEP at 0 cm H2O, and set inspiratory pause at 2 seconds.
4 Manually trigger the ventilator into inspiration while occluding the Y-connector.
5 Record the static or plateau pressure (Pplateau).
6 Measure the volume at the exhalation valve using a respirometer.
7 Calculate CT by dividing measured volume by measured static pressure.
For example, if the measured volume is 200 mL and the static pressure is 70 cm H2O, then the CT equals 200 mL/70 cm H2O, or 2.9 mL/cm H2O.
In this example, once the patient is connected to the ventilator, the amount of volume lost to the circuit equals the pressure reached during a VT delivery multiplied by the CT factor (2.9 mL/cm H2O). Thus, if an average peak pressure is 30 cm H2O during VT delivery, what is the amount of volume lost to the circuit? It is 2.9 mL/cm H2O × 30 cm H2O, or 87 mL.
This amount can be added to the volume setting to ensure that the patient is receiving the desired VT. As mentioned earlier, CT is very important when VT settings are very low (<300 mL), such as when setting the VT for infants and small children. Box 6-4 gives a practice problem in calculating volume lost to CT.
Mechanical Dead Space Considerations
Another consideration when setting the VT is the effects of mechanical dead space. Mechanical dead space (VDmech) is defined as the volume of gas that is rebreathed during ventilation. For example, to add flexibility to the patient-ventilator connection, clinicians sometimes add a 6-inch piece of corrugated tubing between the Y-connector and the endotracheal tube connector. When the patient exhales, some of the exhaled gas will occupy the 6 inches of tubing. On the next breath as the patient inhales, the first part of the breath will contain end-expiratory gas, which has a lower oxygen level and a higher carbon dioxide level.
A number of devices can decrease or increase the amount of VDmech added to the breathing circuit. For example, the use of an endotracheal tube slightly reduces VDmech by about 1 mL/kg IBW because the tube bypasses the upper airway (mouth and nasal passages). In contrast, the addition of a Y-connector between the ventilator and the patient may add about 75 mL of VDmech. Interestingly, these two factors tend to balance each other. Heat moisture exchanger (HMEs) inserted between the endotracheal tube and Y-connector adds VDmech to the circuit (20-90 mL). Fortunately, the low dead space volume associated with these devices (HME of 20 mL) is usually not of clinical significance for adult patients (This is a small dead space volume in relation to an adult VT and usually does not alter Paco2. However, with a higher-volume HME [90 mL], Paco2 may increase above previous values.)
In the past, respiratory therapists added VDmech to increase the PaCO2 of patients who were hyperventilating and developed a respiratory alkalosis that could not be corrected by other methods. Presently, the only situation in which respiratory therapists are likely to add VDmech is with neuromuscular disorders,13 although the effectiveness of this practice has been questioned by a number of clinicians.
Relationship of Tidal Volume, Flow, Total Cycle Time, and Inspiratory-to-Expiratory Ratio
Each ventilator has specific settings to select for VC-CMV. For example, the Puritan Bennett 840 allows the operator to set VT, f, and flow, and the Servoi allows the operator to set the rate, and inspiratory time, or inspiratory-to-expiratory (I : E) ratio.
An understanding of the interrelation of inspiratory flow, inspiratory time (TI), expiratory time, TCT, and I : E ratio will help the clinician to effectively ventilate a patient regardless of the type of equipment being used. Box 6-5 includes the equations that describe a variety of these interrelations. Fortunately, most modern ventilators automatically perform these calculations and display them as measured and calculated values.
Box 6-5
Interrelation of Tidal Volume, Flow Rate, Inspiratory Time, Expiratory Time, Total Cycle Time, and Respiratory Rate
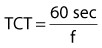
I Total cycle time (TCT) equals inspiratory time (TI) plus expiratory time:

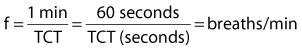
II Respiratory rate (f) equals 1 min (60 seconds) divided by TCT.
III Inspiratory to expiratory ratio equals inspiratory time divided by expiratory time.

Remember: TCT = TI + TE and TCT −TI = TE
IV To calculate TE from f and TI:

Stay updated, free articles. Join our Telegram channel

Full access? Get Clinical Tree


