Initial Patient Assessment
Learning Objectives
On completion of this chapter, the reader will be able to do the following:
1 Understand the importance of performing an operational verification procedure.
5 Identify a system leak from a volume-time curve.
10 Detect a cuff leak by listening to breath sounds.
Key Terms
• Ascites
• Inflection point
• Operational verification procedure
• Patient-ventilator system check
• Upper inflection point
• Ventilator flow sheet
A patient’s color, respiratory rate, breathing pattern, use of accessory muscles, chest movement, breath sounds, work of breathing (WOB), and level of consciousness can provide valuable information about the patient’s physiological status. These observations, along with information derived from ventilator displays and hemodynamic monitoring, are among the first assessments the clinician records for a patient who is undergoing mechanically ventilation.1
This chapter reviews assessment and documentation of patient-ventilator interactions after a patient has been placed on a mechanical ventilator. The first step in this process involves the respiratory therapist verifying the physician’s orders (Box 8-1).2 Once the physician’s orders have been verified, the respiratory therapist ensures that the designated ventilator has passed an operational verification procedure (OVP). The OVP process usually is described in the respiratory therapy department’s policies and procedures manual.
It is important that the respiratory therapy department maintains records showing the OVP history for each ventilator. In addition, a label or form should be attached to each ventilator showing when the OVP was performed, by whom, and whether the ventilator passed the multiple-part test. Newer microprocessor-controlled ventilators perform a series of automated self-tests when the operator initiates the self-test process. This self-test record may be part of the OVP.
The equipment evaluation process should also involve checking the integrity of the ventilator circuit and humidifier system and ensuring that related equipment has been correctly attached and tested to make sure the system is free of leaks (Box 8-2).2
Documentation of the Patient-Ventilator System
In addition to documentation of the OVP, patient information and ventilator settings should be documented regularly when a patient is receiving ventilatory support. These data can be recorded on a computer software program with specific entry fields or kept as a paper record. Regardless of the form it takes, the document often is called a ventilator flow sheet.
The frequency of patient-ventilator system checks depends on the institution’s policy. They generally are performed every 1 to 4 hours.3 In addition to this schedule, patient-ventilator system checks are performed:
• Before an arterial blood gas (ABG) sample is drawn
• When the physician has entered new orders
• Before hemodynamic data or bedside pulmonary function data are measured
• When a ventilator change has been made
• When a patient returns from testing (e.g., x-ray, magnetic resonance imaging, or MRI)
It is important to recognize that these patient-ventilator system checks represent a documented evaluation of the ventilator’s function and the patient’s response to ventilatory support. The American Association for Respiratory Care (AARC) has developed clinical practice guidelines for recording patient-ventilator system checks.2 Several points regarding these guidelines should be emphasized:
Figure 8-1 shows the information that may be included on a ventilator flow sheet.2 The top of the form contains basic patient information:
• Name
• Age
• Weight
• Height
• Endotracheal tube (ET) size and the centimeter marking at the teeth, corner of the mouth, or nares
• Date mechanical ventilation was initiated
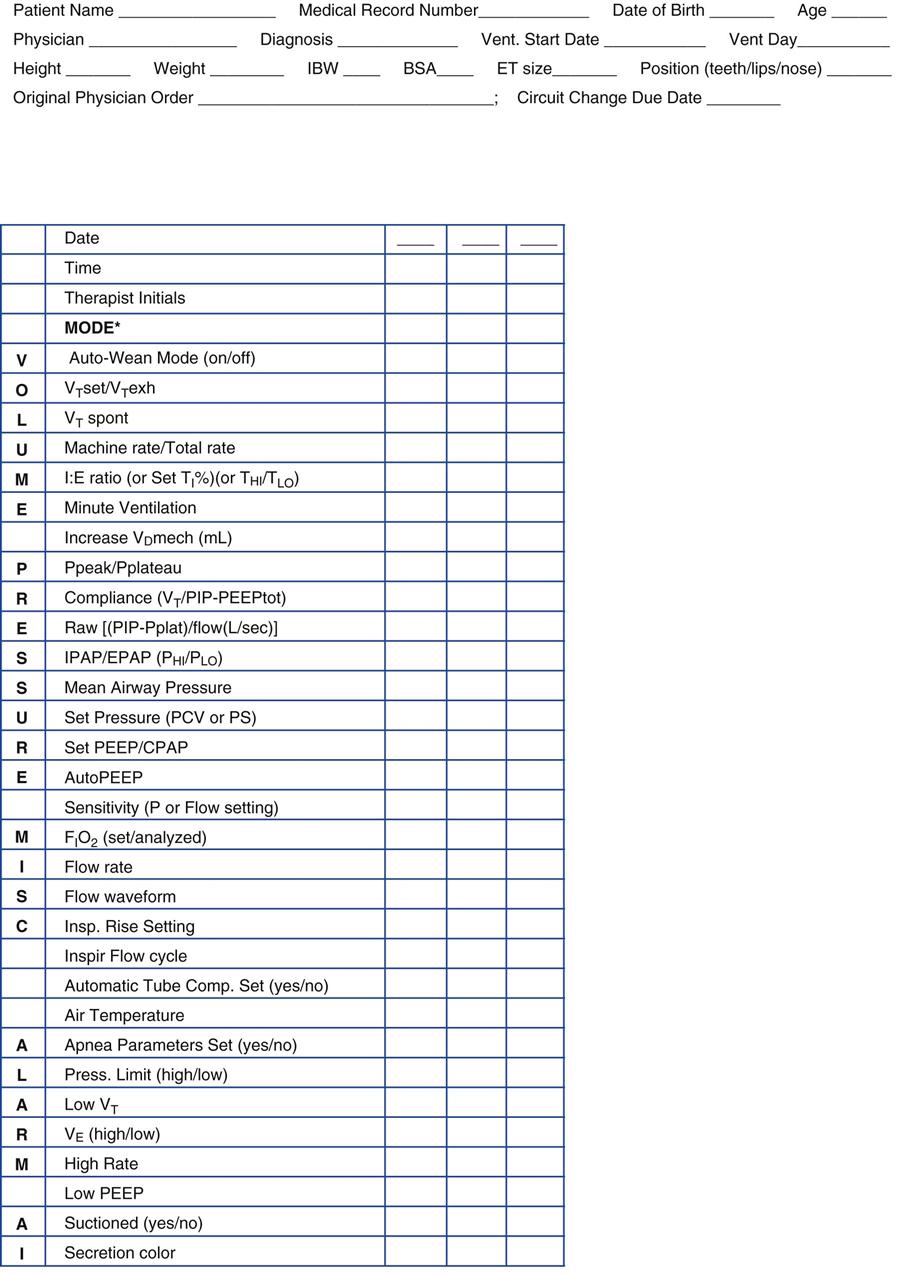
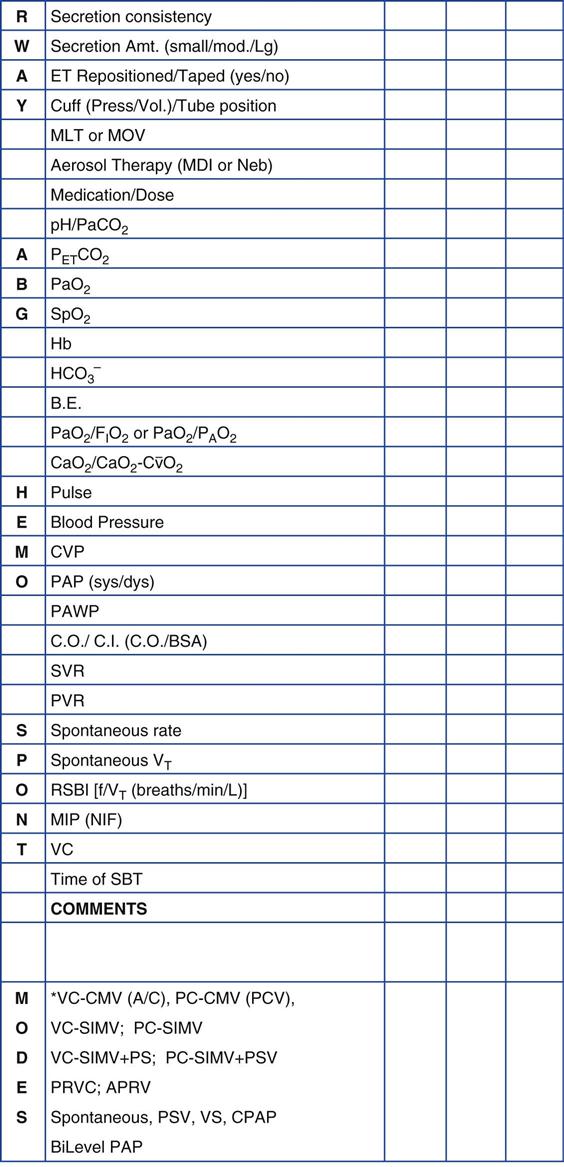
Spaces are also provided for current information and measurements of patient and ventilator parameters. These may include the following:
• Date
• Time
 )
)• Peak inspiratory pressure (PIP)
• Fractional inspired oxygen (FIO2)
• Temperatures of inspired gases
• Inspiratory-to-expiratory (I : E) ratio
• Continuous positive airway pressure (CPAP) or positive end-expiratory pressure (PEEP)
• Inspiratory and end-expiratory positive airway pressures (IPAP/EPAP)
• Maximum inspiratory pressure (MIP)
Volumes, pressures, temperature, vital signs, and FIO2 are measured during each patient-ventilator system check. Please note that although FIO2 may be measured intermittently for adults, it should be continuously monitored for infants receiving mechanical ventilation.2 Most of the current intensive care unit (ICU) ventilators have oxygen analyzers that provide continuous monitoring of FIO2. Alarms should be regularly checked to ensure that they have been set appropriately. ABGs, shunt, P(A-a)O2, and PaO2/FIO2 are determined when the patient’s condition or the ventilator settings change significantly.
Despite the importance of regular, accurate documentation, many respiratory therapy departments do not follow the AARC’s clinical practice guideline for patient-ventilator system checks or a similar model.3,4 Case Study 8-1 provides a clinical scenario illustrating the important of maintaining accurate patient-ventilator records.5
 Case Study 8-1
The Importance of Documentation
A 38-year-old woman is intubated for respiratory failure secondary to severe pneumonia. After 24 hours her status improves. The endotracheal tube is kept in place to allow suctioning, because she has large amounts of secretions. On the third day after intubation, her respiratory status declines. She has a cardiac arrest and is resuscitated but suffers brain injury as a result. She dies several weeks later.
The family hires an attorney. At issue is the fact that in the medical record, the respiratory therapist’s notes with the ventilator flow sheet indicate that the patient had been suctioned about every 2 hours for large amounts of thick, yellow secretions. However, during the 8 hours before the arrest, nowhere did the notes state that the patient had been suctioned. The therapist states that he had suctioned the patient but had not recorded it in the chart. Was the therapist negligent and did his actions lead to the wrongful death of the patient?
See Appendix A for the answer.
The First 30 Minutes
Immediately after the patient is connected to a mechanical ventilator, the clinician should perform auscultation of the patient’s chest to confirm adequate volume delivery and proper placement of the ET. The patient’s vital signs are checked, making particular note of heart rate and blood pressure, because ventilation may affect these parameters (Key Point 8-1). The alarms (e.g., apnea, low pressure, low VT, and high pressure limit) are activated.6 An arterial blood sample is obtained about 15 minutes after mechanical ventilation is initiated for evaluation of the effectiveness of ventilation and oxygenation.3,7 If not already done, a chest radiograph is obtained to confirm proper placement of the ET. Box 8-3 lists other clinical laboratory tests a physician might order to assess the patient’s status when mechanical ventilation is initiated.3
 Key Point 8-1
Positive-pressure ventilation can reduce venous return to the heart, cardiac output, and blood pressure. (See Chapter 16 for more information on the cardiovascular effects of mechanical ventilation.)
Once the patient assessment shows the individual is stable, the respiratory therapist then performs the first ventilator check.
Mode
The mode of ventilation is recorded in the appropriate space on the ventilator flow sheet. It may be recorded as follows:
• Volume-controlled continuous mandatory ventilation (VC-CMV) or assist/control (A/C) ventilation.
• Pressure-controlled continuous mandatory ventilation (PC-CMV)
• Pressure-regulated volume control (PRVC)
• Airway pressure release ventilation (APRV)
• PSV, volume support (VS), CPAP, unsupported spontaneous ventilation (these are spontaneous modes)
• Bilevel positive airway pressure (bilevel PAP; noninvasic positive-pressure ventilation [NIV]).
Sensitivity
If a patient-triggered mode is used (i.e., inspiration is initiated by patient effort), the pressure or flow required to trigger the ventilation should be checked; no more than −1 or −2 cm H2O should be required. If the ventilator is flow triggered, the sensitivity should be set so that the ventilator will trigger at a flow change of 2 to 3 L/min. The ventilator should be checked for auto-triggering, and the patient’s ability to trigger a breath should be assessed. Adjustments are made as needed.
As discussed previously, when auto-PEEP is present, the patient has more difficulty triggering breaths. The presence of auto-PEEP should be suspected if the patient is using his accessory muscles of inspiration or demonstrates labored breathing. Ventilator graphics that show failure of the expiratory flow to return to zero before the next breath also is an indicator of auto-PEEP (see Chapter 9).8
If auto-PEEP is present, a number of strategies can be used to reduce its effects, including increasing the flow (reducing the inspiratory time [TI]), reducing VT, or reducing the rate (i.e., reducing  ), suctioning the patient, or changing modes to allow for more spontaneous breaths. It is important to recognize that it might not always be possible to eliminate auto-PEEP, particularly in patients with increased flow resistance and airway closure. The addition of extrinsic PEEP (PEEPE) in these patients may make triggering easier (see Fig. 7-1). PEEPE is increased progressively during VC-CMV until the patient’s use of accessory muscles diminishes or until PIP and Pplateau begin to rise. (Additional information about treatment of auto-PEEP can be found in Chapter 17.)
Tidal Volume, Rate, and Minute Ventilation
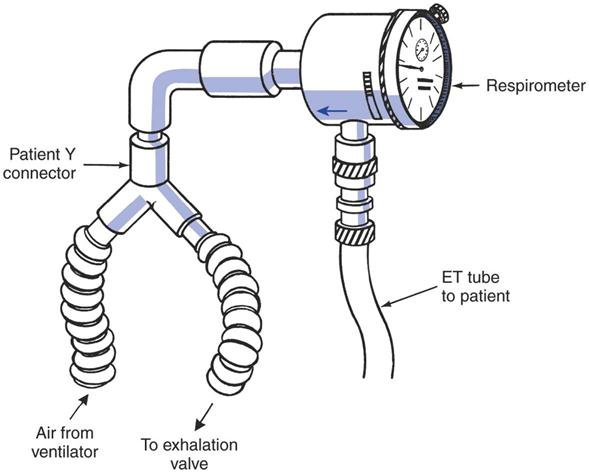
Usually, VT, f, and  are displayed digitally on the front panel of the ventilator in the data display window. Most ventilators display the set VT (VTset) and the exhaled VT (VTexh). Newer microprocessor-controlled ventilators provide excellent, reliable flow and pressure monitoring. If this information is not available, VT can be measured using a handheld bedside pulmonary function device or other volume-measuring device (e.g., respirometer) and a watch or clock with a sweep second hand. Although this technique generally is used only with older ventilators, it can also be used to verify digital readouts if a question arises about the machine’s reliability (Fig. 8-2 and Box 8-4).
Box 8-4
Respirometer Technique for Measuring Tidal Volume (VT) and Minute Ventilation (VE)
Modern microprocessor controlled ventilators provide digital displays for the clinician to monitor a patient’s tidal volume and minute ventilation. Before the introduction of these devices, clinicians typically relied on handheld respirometers to measure these variables. The procedure for measuring VT and  with a respirometer is relatively easy to accomplish.
• The respirometer is connected directly to the patient’s endotracheal tube and to the Y-connector of the ventilator circuit (see Fig. 8-2). This allows easy measurement of the VT that do not have to be corrected for compressible volume from the ventilator circuit. (NOTE: In cases where the VT was measured at the expiratory port, the compressible volume [volume lost to CT] must be subtracted from the VT reading on the respirometer.)
 can be calculated (
 = VT × f) or measured directly. If the patient is on intermittent mandatory ventilation/synchronized intermittent mandatory ventilation (IMV/SIMV), the total
  is measured. Mandatory VT and f can be measured separately, and mandatory
  can be subtracted from the total
  to determine a patient’s spontaneous
  .
.Correcting Tubing Compliance
Accurate reporting of volumes requires correction for volume loss within the patient circuit due to the effects of tubing compliance (also called compressible volume). Tubing compliance (CT) for most ventilator circuits ranges from about 1.5 to 2.5 mL/cm H2O.9 Box 8-5 presents a sample calculation of volume loss associated with CT (also see Chapter 6).
Box 8-5
Calculation of Compressible Volume (Volume Lost to Tubing Compliance)
If the positive inspiratory pressure (PIP) is 25 cm H2O, the tidal volume (VT) at the exhalation port is 600 mL during performance of the CT calculation, and tubing compliance (CT) is 3 mL/cm H2O. The volume lost to the tube is calculated as follows:


The volume actually delivered to the patient’s lungs is found by subtracting 75 mL from the VT measured at the exhalation port:

Most microprocessor-controlled ventilators (e.g., Puritan Bennett 840 [Covidien-Nellcor and Puritan Bennett, Boulder, Colo.] Servoi [Maquet Inc, Wayne, N.J.]) do not require calculation of tubing compliance because these machines automatically compensate for this factor. As discussed previously, ventilators that perform this function typically increase the delivered volume so that the set volume is the amount provided to the patient (i.e., the digital readout indicates the VT actually delivered to the patient’s airway). With older ventilators, the operator can set the value for the circuit’s CT and the ventilator will add volume to the set VT to compensate for volume loss due to tubing compliance.
Alveolar Ventilation
Monitoring of alveolar ventilation ( ) has declined in popularity in recent years because many acute care facilities do not include this variable on the ventilator flow sheet. Unfortunately, its importance often is overlooked when using low VT strategies. In-line heat and moisture exchangers (HMEs), closed suction systems, and other circuit adapters and equipment can add mechanical dead space (VDmech) to the ventilator circuit and affect the VD/VT. Knowledge of the effect of dead space on alveolar volume delivery can be particularly important in infants, children, and smaller adults with ARDS.
Two factors must be considered in determining alveolar ventilation:
Dead Space
Normal anatomic dead space (VDanat) is about 1 mL/lb IBW.* Bypassing the upper airway with an artificial airway reduces VDanat by about one half. Using a Y-connector, additional flex tubing between the Y-connector and the ET, or a HME adds mechanical dead space.
Added Mechanical Dead Space
Because HMEs or other adapters attached to the ET (Fig. 8-3) add to mechanical dead space (VDmech), the volume of these devices, along with the VDanat, must be subtracted from the VT to determine actual alveolar ventilation (Box 8-6). For example, if a 150-lb adult has a VT of 500 mL and the added VDmech is 100 mL, the alveolar ventilation for each breath would be:


 Key Point 8-2
The volume of mechanical dead space can be easily measured for any device added to a ventilator circuit. The device is simply filled with water and then emptied into a graduated container; the volume measured is the volume of mechanical dead space for the device. (A piece of equipment [i.e., tubing] similar to that being placed on the patient should be used for this type of measurement.)
Final Alveolar Ventilation
During VC-CMV (A/C),  is calculated by multiplying the number of breaths counted for 1 minute by the corrected VT:
  = (VT − VDanat − Added VDmech) × f. When a patient is on VC-SIMV, the mandatory rate and volume delivery must be calculated separately from the patient’s spontaneous rate and volume; these values then are added to determine the total minute ventilation (Box 8-7).
Box 8-7
Calculation of Alveolar Ventilation in VC-SIMV
Calculations are made using the following data:
• Synchronized intermittent mandatory ventilation (SIMV) rate = 5 breaths/min
• Anatomic dead space (VDanat) = 100 mL
• Added mechanical dead space (VDmech) = 50 mL
• Mandatory alveolar ventilation per minute ( ) = 5 × [600 − 100 − 50] = 2250 mL or 2.25 L/min
• Patient spontaneous rate = 10 breaths/min
• Spontaneous alveolar ventilation = 10 × [350 − 100 − 50] = 2000 mL or 2 L
Monitoring Airway Pressures
All positive-pressure ventilators have a pressure monitor or display that continuously shows the upper airway pressure. The pressure monitor is probably most accurate when it shows pressures measured very near the patient’s upper airway because this eliminates the effects of the humidifying device and the breathing circuit on the measurement. Proximal pressure measurements are obtained by connecting the monitor tubing (usually a small-diameter plastic tube) to the Y-connector of the patient circuit. If the tubing is not visible on the circuit, pressures are detected through the main patient circuit and not at the upper airway. Although these values are not measured at the proximal airway, ICU ventilators are generally very accurate and clinically useful1 (Key Point 8-3).
 Key Point 8-3
Proximal pressure and flow monitor lines must be free of moisture and secretions to provide accurate readings.
Pressure monitoring allows the clinician to assess pressure delivery to the upper airway. It ensures that a minimal pressure is maintained (low-pressure limit) and that high-pressure limits are not exceeded during mechanical ventilation. Intermittent readings of PIP, Pplateau, set pressure (for pressure-targeted modes such as PC-CMV and pressure support [PS]), transairway pressure (PTA = PIP − Pplateau), mean airway pressure ( ), and end-expiratory pressure (EEP) can provide valuable information about the patient’s condition.
Peak Inspiratory Pressure
PIP (or PPeak), which is the highest pressure observed during inspiration, can be used to calculate dynamic compliance (CD; also called dynamic characteristic). A fairly constant VT with an increasing Ppeak may indicate a reduction in lung compliance (CL) or an increase in airway resistance (Raw). Conversely, a declining PIP may indicate a leak or may be a sign of improvement in compliance or resistance.
Plateau Pressure
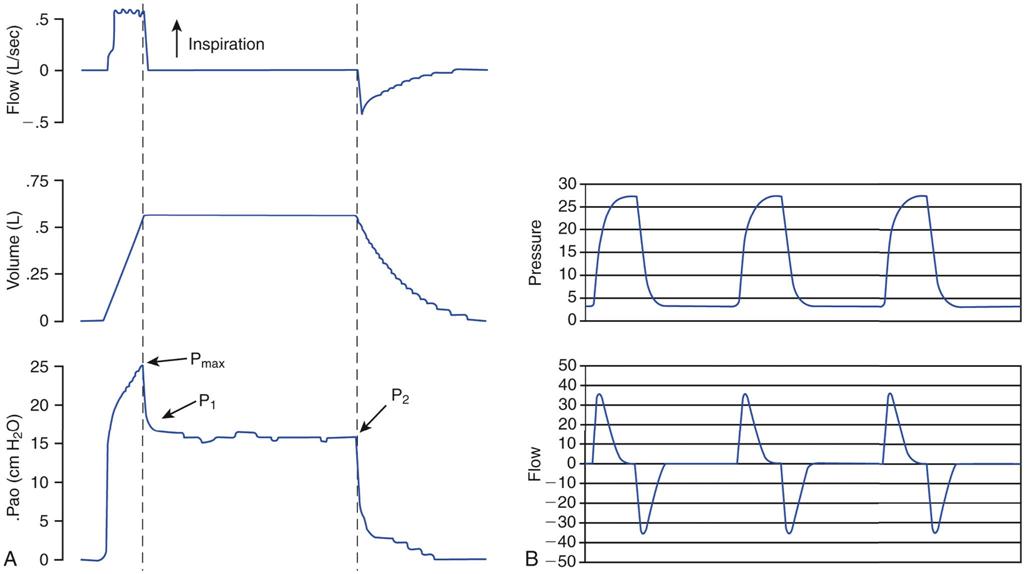
A Pplateau reading can be obtained by using the ventilator’s inspiratory pause control or by setting a pause time of about 0.5 to 1.5 seconds. Remember that the static pressure is read when no gas flow is occurring. Traditionally, Pplateau was determined by occluding the ventilator’s expiratory port at the end of inspiration and reading the pressure registered on the ventilator’s pressure manometer. After PIP is reached, the manometer needle or pressure indicator shows a drop of a few centimeters from peak and then briefly remains in a plateau (static) position before dropping to zero (Fig. 8-3). It is important to remember that Pplateau cannot be measured accurately if the patient makes active respiratory efforts, has a high f, or resists extending TI; therefore measurement of Pplateau is difficult, if not impossible, to obtain in spontaneously breathing individuals.
Pplateau most often is used to calculate CS, which reflects the elastic recoil of the alveolar walls and thoracic cage against the volume of air in the patient’s lungs. Current practice strongly recommends keeping Pplateau below 30 cm H2O (Key Point 8-4). Notice that during either pressure or volume ventilation, if a condition of no gas flow occurs near the end of inspiration (i.e., the flow-time waveform graphic shows a reading of zero), the corresponding pressure on the pressure-time curve is an indicator of Pplateau (Fig. 8-4 and Key Point 8-5).
 Key Point 8-4
Current practice strongly recommends keeping Pplateau below 30 cm H2O to avoid ventilator induced lung injury.
Stay updated, free articles. Join our Telegram channel

Full access? Get Clinical Tree


