Susan P. Pilbeam and J.M. Cairo
Improving Oxygenation and Management of Acute Respiratory Distress Syndrome
Learning Objectives
On completion of this chapter, the reader will be able to do the following:
2 Calculate the pulmonary shunt fraction.
3 Identify indications and contraindications for CPAP and PEEP.
4 Name the primary goal of PEEP and the conditions in which high levels of PEEP are most often used.
7 Explain what happens when a patient with a unilateral lung disease receives PEEP/CPAP therapy.
8 Describe the effects of PEEP in a patient with an untreated pneumothorax.
10 Compare static compliance, hemodynamic data, and ABGs as indicators of an optimum PEEP.
12 Define acute lung injury and ARDS using the PaO2/FIO2 ratio.
13 Recommend a tidal volume (VT) setting for a patient with ARDS.
14 Provide the maximum Pplateau value in patients with ARDS.
15 Identify weaning criteria from PEEP or CPAP.
Key Terms
• Cytokines
• Deflation point
• Deflection point
• Exudative
• Fibrosing alveolitis
• Flow resistor
• Inflammatory mediators
• Lower inflection point
• Threshold resistor
• Thrombotic mediators
• Upper inflection point
Improving the ventilatory status of a patient with hypercapnic respiratory failure (i.e., reducing the partial pressure of carbon dioxide [PaCO2] can be accomplished by improving alveolar ventilation, reducing physiological dead space, and reducing carbon dioxide (CO2) production. Improving oxygenation, on the other hand, involves using various patient management strategies, such as administering enriched oxygen, applying positive end-expiratory pressure (PEEP) and continuous positive airway pressure (CPAP), and patient positioning.
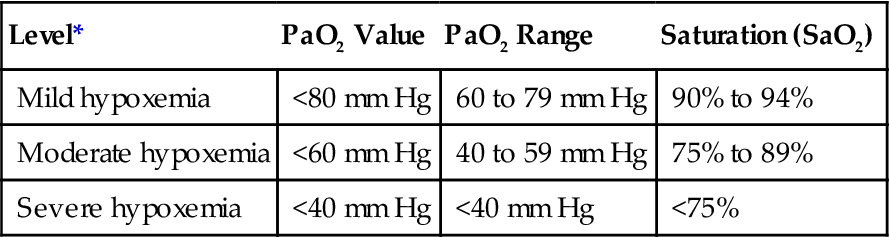
Although the terms hypoxia and hypoxemia are often used interchangeably, it is important to recognize that hypoxia is defined as a reduction in oxygen in the tissues, whereas hypoxemia refers to a reduction in the partial pressure of oxygen in the blood (i.e., PaO2 <80 mm Hg and SaO2 <95%). Box 13-1 provides a brief description of the 4 types of hypoxia and Key Point 13-1 provides PaO2 and SaO2 values typically used to identify mild, moderate, and severe hypoxemia.
 Key Point 13-1
Levels of Hypoxemia*
| Level* | PaO2 Value | PaO2 Range | Saturation (SaO2) |
| Mild hypoxemia | <80 mm Hg | 60 to 79 mm Hg | 90% to 94% |
| Moderate hypoxemia | <60 mm Hg | 40 to 59 mm Hg | 75% to 89% |
| Severe hypoxemia | <40 mm Hg | <40 mm Hg | <75% |
The treatment of hypoxia should focus on the cause. For example, hypoxemic hypoxia, which occurs when a person breathes rarefied air at a high altitude (i.e., reduced partial pressure of inspiratory oxygen [PIO2]), can be reversed by having the person breathe an enriched oxygen mixture. When hypoventilation causes hypoxemia, increasing minute ventilation generally improves oxygenation (Case Study 13-1). Serious anemia, on the other hand, is treated with the administration of blood products, which in turn improves the patient’s oxygen-carrying capacity (i.e., hemoglobin). Circulatory hypoxia occurs when the patient’s cardiac output is reduced. The treatment of this type of hypoxia typically involves pharmacologic interventions, which normalize the patient’s cardiac output (e.g., administering drugs that increase ventricular contractility or decrease vascular resistance) and therefore improve oxygen delivery to the tissues. With histotoxic hypoxia, cyanide interferes with a person’s ability to utilize oxygen to produce energy (cellular respiration) by uncoupling oxidative phosphorylation (i.e., cytochrome oxidase). Treatment of cyanide poisoning involves administering a cyanide antidote (e.g., hydroxocobalamin) and providing supportive care to maintain oxygenation and acid-base balance.
 Case Study 13-1
Myasthenia Gravis
A patient with myasthenia gravis is placed on mechanical ventilation. The chest radiograph is normal. Breath sounds are clear. Initial ABGs on 0.25 FIO2 20 minutes after beginning ventilation are as follows: pH = 7.31; PaCO2 = 62 mm Hg; bicarbonate = 31 mEq/L; and PaO2 = 58 mm Hg. What change in ventilator setting might improve this patient’s ABG findings?
See Appendix A for the answer.
Improvement in oxygenation status may require time before the response to treatment is evident. This is particularly important in cases involving hypoventilation, anemia, and circulatory hypoxia. In these cases, it is appropriate to administer supplemental oxygen until the hypoxemia is relieved.
This chapter begins with a discussion of how to make simple adjustments of FIO2 to improve oxygenation. It is followed by a discussion of techniques involving the use of PEEP to improve oxygenation. Achieving optimum PEEP requires close monitoring and sometimes the use of either static or dynamic pressure-volume (P-V) loops. Methods used to set optimum PEEP are provided along with a review of P-V loops. Additional uses of PEEP are also discussed in this chapter, along with a description of the effects, complications, and consequences associated with discontinuation of PEEP.
A discussion of the pathophysiology of acute lung injury (ALI) and acute respiratory distress syndrome (ARDS) is included to provide the reader with an understanding of the complexity of these disorders. Patients with ALI/ARDS are among the most difficult to oxygenate and manage in the critical care unit. The concept of lung-protective strategies and lung-recruitment maneuvers that are currently being evaluated to improve oxygenation, particularly in patients with ARDS, are included along with three clinical scenarios related to the topics discussed in this chapter.
Basics of Oxygenation Using FiO2, Peep Studies, and Pressure-Volume Curves for Establishing Optimum Peep
Basics of Oxygen Delivery to the Tissues
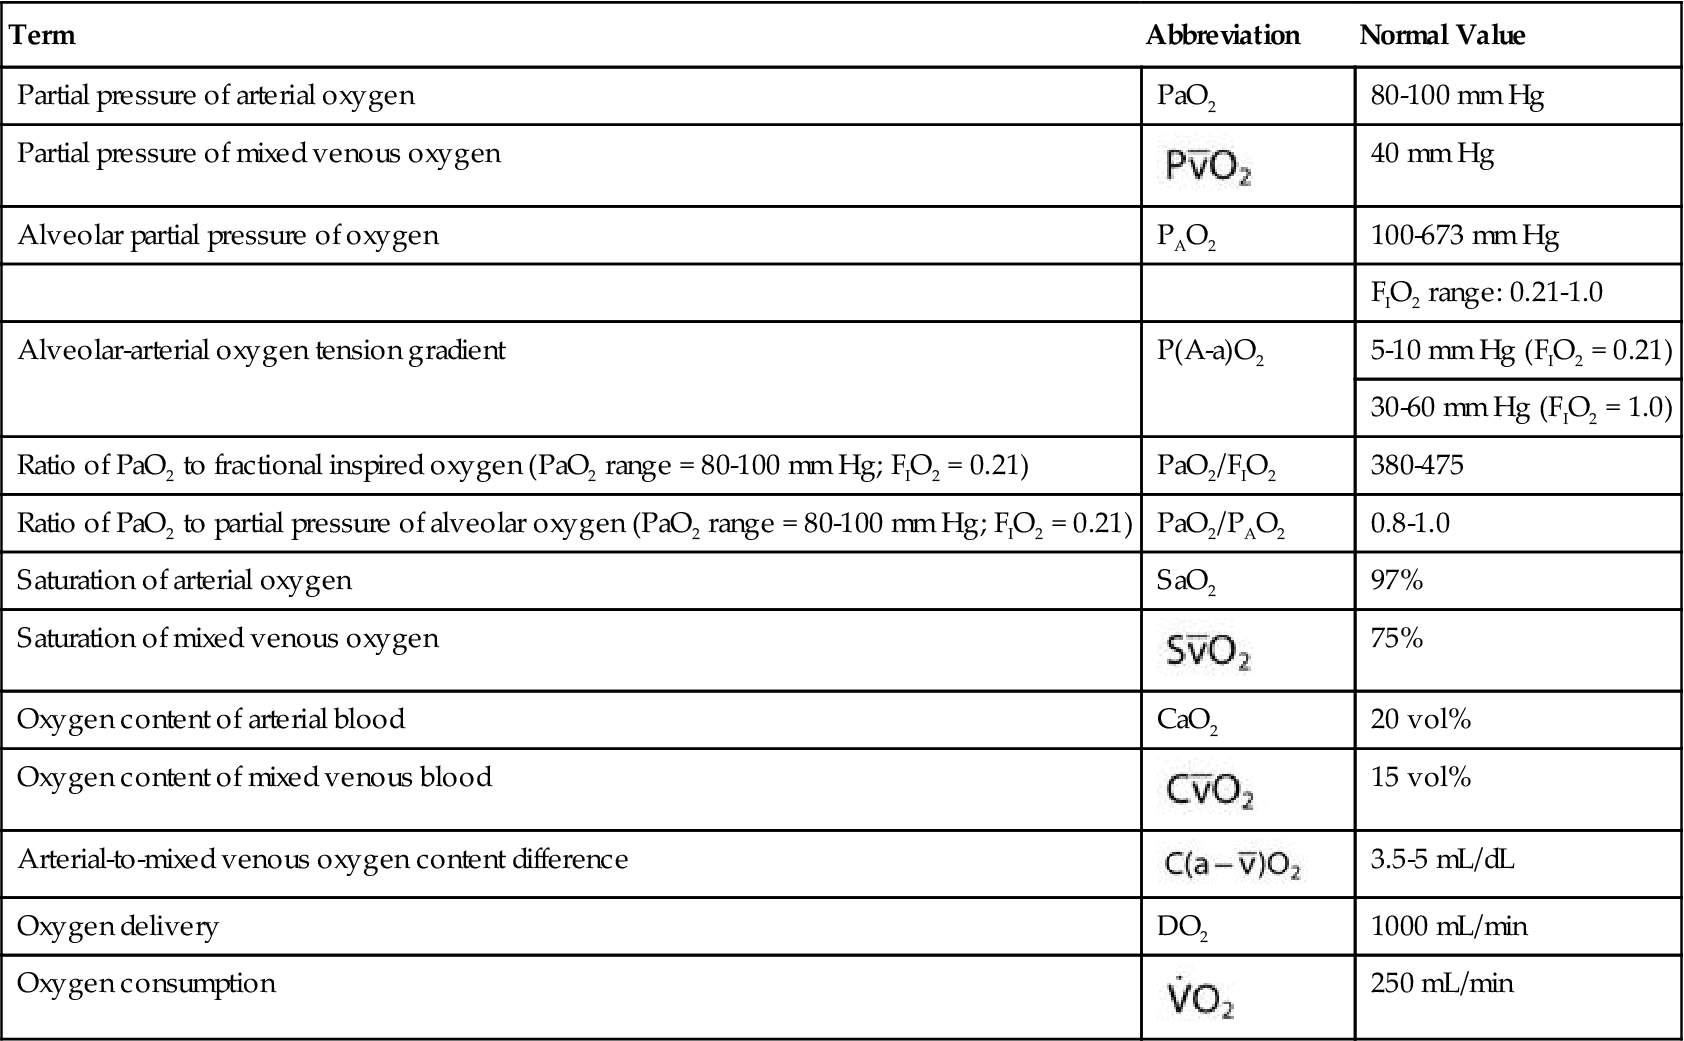
The most common parameters used to assess the oxygenation status of patients are the FIO2, SpO2, ABGs, hemoglobin (Hb), abnormal Hb, PaO2, PaO2/PAO2, PaO2/FIO2, shunt, cardiac output, mixed venous oxygen saturation ( ), and oxygen content of mixed venous blood (
 ). Measuring oxygen delivery (DO2) to the tissues provides valuable information about oxygen availability to the tissues. Oxygen utilization by the tissues can be determined by measuring arterial-to-mixed venous oxygen content difference (
 ), oxygen consumption (
 ), cardiac output, and
  . Table 13-1 provides a list of normal values for the parameters used to evaluate a patient’s oxygen status. Box 13-2 contains a summary of the equations for calculating parameters that are not directly measured, such as the partial pressure of alveolar oxygen (PAO2), CaO2,
  , and DO2.
TABLE 13-1
Measures and Values Used in the Evaluation of Oxygenation Status
| Term | Abbreviation | Normal Value |
| Partial pressure of arterial oxygen | PaO2 | 80-100 mm Hg |
| Partial pressure of mixed venous oxygen |  | 40 mm Hg |
| Alveolar partial pressure of oxygen | PAO2 | 100-673 mm Hg |
| FIO2 range: 0.21-1.0 | ||
| Alveolar-arterial oxygen tension gradient | P(A-a)O2 | 5-10 mm Hg (FIO2 = 0.21) |
| 30-60 mm Hg (FIO2 = 1.0) | ||
| Ratio of PaO2 to fractional inspired oxygen (PaO2 range = 80-100 mm Hg; FIO2 = 0.21) | PaO2/FIO2 | 380-475 |
| Ratio of PaO2 to partial pressure of alveolar oxygen (PaO2 range = 80-100 mm Hg; FIO2 = 0.21) | PaO2/PAO2 | 0.8-1.0 |
| Saturation of arterial oxygen | SaO2 | 97% |
| Saturation of mixed venous oxygen |  | 75% |
| Oxygen content of arterial blood | CaO2 | 20 vol% |
| Oxygen content of mixed venous blood |  | 15 vol% |
| Arterial-to-mixed venous oxygen content difference |  | 3.5-5 mL/dL |
| Oxygen delivery | DO2 | 1000 mL/min |
| Oxygen consumption |  | 250 mL/min |
Box 13-2
Equations Used to Calculate Oxygenation Status: Alveolar Air Equation (Calculation of Alveolar PO2, PAO2)
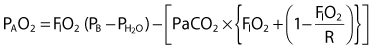
where PAO2 = alveolar partial pressure of oxygen (mm Hg)
FIO2 = inspired oxygen fraction
PB = barometric pressure (mm Hg)
 = water vapor pressure (at 37° C = 47 mm Hg)
R = respiratory quotient ( ; R of 0.8 is commonly used)
With an FIO2 ≤ 0.6 (low value), the effect of R on PAO2 is small.
To estimate the PAO2 for FIO2 values <0.6: PAO2 = FIO2(PB −  ) − (1.25 × PaCO2)
Partial pressure of inspired oxygen: PIO2 = FIO2 (PB −  )
)
Arterial oxygen content (CaO2): CaO2 = [(Hb × 1.34) × SaO2] (0.003 mL/dL × PaO2)
Mixed venous oxygen content ( ):
):  = [(Hb × 1.34) ×
  ] (0.003 mL/dL ×
  )
)
Oxygen consumption ( ):
):  = Cardiac output (C.O.) × (CaO2 −
  )
)
Oxygen delivery (DO2): DO2 = C.O. × CaO2
Evaluating PaO2, SpO2, and FIO2 in Ventilator Patients
In the clinical setting, the FIO2 is measured regularly (at least every 24 hours) and whenever it is changed.1 FIO2 is monitored more frequently in neonates and infants (continuously or every 2 to 4 hours). When changes in the FIO2 are made for adults or children, ABGs should be measured within 15 minutes, although some institutions wait 30 minutes to do so.2
Every attempt should be made to maintain the FIO2 below 0.6 to prevent the complications of oxygen toxicity while keeping the PaO2 between 60 and 90 mm Hg and the CaO2 near normal (20 mL/dL). This goal is not always possible, and sometimes a higher FIO2 is required.
The SpO2 can be used to titrate FIO2 once the relationship between SaO2 and SpO2 has been established. (After mechanical ventilation is initiated, an arterial blood gas sample is obtained and the SaO2 is compared with the patient’s current SpO2 to establish this relationship.) A goal for maintaining SpO2 at greater than 90% is appropriate. It is important to understand, however, that the SpO2 will not always correlate perfectly with PaO2. Some patients will have a large discrepancy between SpO2 and SaO2 and need to be monitored more carefully3 (see Chapter 11). For example, in patients with chronic obstructive pulmonary disease (COPD), their normal PaO2 may be near 55 mm Hg (SaO2 ~80%) and the SpO2 values may be closer to 88% to 90% on room air.
Although the inspired oxygen percentage can be determined using multiuse oxygen analyzers, most current intensive care unit (ICU) ventilators have built-in oxygen analyzers that can provide continuous measurements of FIO2. Examples include the Hamilton Galileo (Hamilton Medical, Bonaduz, Switzerland), the Dräger v500 (Dräger Medical, Inc, Telford, Pa.), the Hamilton G5 (Hamilton Medical, Bonaduz, Switzerland), the Puritan Bennett 840 (Covidien-Nellcor Puritan Bennett, Boulder, Colo.), and the Servoi (Maquet Inc, Wayne, N.J.) to name a few.
Adjusting FIO2
The ABGs obtained after mechanical ventilation is initiated are compared with the FIO2 being delivered. A linear relationship exists between PaO2 and FIO2 for any patient as long as the person’s cardiopulmonary status remains fairly constant.4–7 In other words, the minute ventilation, cardiac output, shunt, and VD/Vt must not change significantly between the time the ABG comparison is made and the FIO2 is changed. Most of the time, this is the case because ventilator changes are made quickly after blood gas results are obtained.
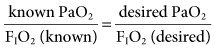
Because of the linear correlation, the known PaO2 and the known FIO2 can be used to select the desired FIO2 necessary to achieve a desired PaO2:
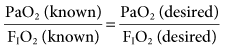
or
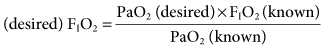
This equation provides a reliable method for making appropriate changes in the FIO2 to achieve a desired PaO2.
Some institutions use the ratio of PaO2/PAO2 for evaluation of oxygenation and for predicting the inspired oxygen concentration.7–10 The ratio of PaO2 to FIO2 (commonly called the P-to-F ratio [PaO2/FIO2]) has become a very popular way to set FIO2 because of its simplicity. However, it is not as accurate as the PaO2/PAO2 because the alveolar PO2 determination takes PaCO2 into account. To estimate the a change in FIO2, for example, if the PaO2 is 60 mm Hg with an FIO2 of 0.3 and the target PaO2 is 80 mm Hg, the calculation of FIO2 is as follows:
and 60/0.3= 80/X, where X would be the new FIO2 setting. In this example, the new setting for FIO2 would be 0.4 (Case Study 13-2).8,9 Making adjustments in FIO2 has a greater effect on patients with hypoventilation and reduced  , in which higher alveolar oxygen has better access to pulmonary blood flow than situations of pulmonary shunt.
 Case Study 13-2
Changing FIO2
After being supported on a ventilator for 30 minutes, a patient’s PaO2 is 40 mm Hg on an FIO2 of 0.75. Acid-base status is normal and all other ventilator parameters are within the acceptable range. PEEP is 3 cm H2O. What FIO2 is required to achieve a desired PaO2 of 60 mm Hg? Is your answer possible? Can you think of another form of therapy to improve oxygenation?
See Appendix A for the answer.
Selection of FIO2 or Adjustment of Mean Airway Pressures
Although the exact safe level of FIO2 in mechanically ventilated patients is not known at this time, it is generally agreed that maintaining a high FIO2 (>0.6) can result in oxygen toxicity.11 Besides the tissue damage associated with the long-term use of 100% oxygen, it also has an additional complication. Breathing 100% oxygen can cause the rapid formation of absorption atelectasis and increase intrapulmonary shunting (i.e., shunt fraction), which further contributes to hypoxemia (Box 13-3).10,12–14 Thus, FIO2 should be kept as low as possible. Although the lower limits of permissive hypoxemia remain controversial, most practitioners agree that a target PaO2 of 60 mm Hg and a SpO2 of 90% are acceptable lower limits for most adult patients.12
Box 13-3
Pulmonary Shunt: Perfusion Without Ventilation
As the percent of pulmonary shunt increases, hypoxemia worsens. A number of pathologic conditions are associated with an increased shunt fraction. Examples include atelectasis, pulmonary edema, pneumonia, pneumothorax, and complete airway obstruction.
Pulmonary Shunt Calculations
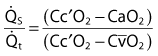
where  is the shunted portion;
  is total cardiac output, Cc′O2 is the content of oxygen of the alveolar capillary (also called pulmonary end-capillary), CaO2 is the arterial O2 content, and
  is the mixed venous oxygen content. Cc′O2 is calculated based on the assumption that pulmonary end-capillary PO2 is the same as PAO2.
Both arterial and mixed venous blood samples are required for this calculation. As previously mentioned, arterial blood can be obtained from a peripheral artery. Mixed venous blood is taken from the distal port of a pulmonary artery catheter (see Chapter 11).
End-capillary oxygen content (Cc′O2 = (1.34 × Hb × 1.0) + (0.003 × PAO2), arterial oxygen content (CaO2) = (1.34 × Hb × SaO2) + (0.003 × PaO2) and mixed venous oxygen content ( ) = (1.34 × Hb ×
  ) + (0.003 ×
  ).
).
If the PaO2 remains very low while the patient is breathing an enriched oxygen mixture, significant shunting, ventilation-perfusion abnormalities, and/or diffusion defects are present. In these cases, other methods to improve oxygenation, besides increasing FIO2, must be considered. One approach that can be used to increase the PaO2 involves increasing the . The
. The  is the average pressure above baseline during a total respiratory cycle (I + E) (Fig. 13-1). Box 13-4 provides an equation to estimate
  . As
. As  increases, the PaO2 increases. Factors that affect
  during positive-pressure ventilation include peak inspiratory pressure (PIP), total PEEP (or auto-PEEP plus extrinsic or set PEEP [PEEPE]), inspiratory-to-expiratory (I : E) ratios, respiratory rate (f), and inspiratory flow pattern. For example, as the total PEEP increases, the
  increases.
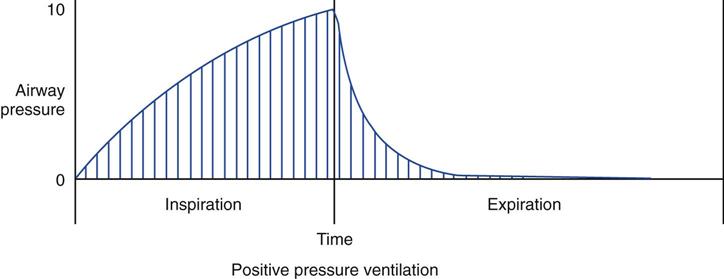
 ). Vertical lines under the pressure-time curve represent frequent readings of pressure over the total respiratory cycle. The sum of these pressure readings (i.e., the area under the curve) divided by the cycle time will give the value for mean airway pressure. (See text for additional information.)
Stay updated, free articles. Join our Telegram channel

Full access? Get Clinical Tree


