Hemodynamic Monitoring
Learning Objectives
On completion of this chapter, the reader will be able to do the following:
2. Identify indicators of left ventricular preload, contractility, and afterload.
3. Name the major components of a hemodynamic monitoring system.
6. Interpret the waveforms generated during the insertion of a pulmonary artery catheter.
8. List normal values for measured and derived hemodynamic variables.
10. Compare the effects of spontaneous and mechanical ventilation breathing on hemodynamic values.
13. Differentiate between cardiogenic and noncardiogenic pulmonary edema using hemodynamic parameters.
Key Terms
• Afterload
• Balloon-tipped, flow directed catheter
• Bradycardia
• Cardiac index
• Cardiac work
• Central venous lines
• Contractility
• Diastole
• dP/dT
• Ejection fraction
• Fick principle
• French size
• Incisura
• Preload
• Physiological shunt
• Pulmonary artery catheter
• Pulmonary vascular resistance
• Pulse pressure
• Retrograde
• Stroke index
• Stroke work
• Swan-Ganz catheter
• Systemic vascular resistance
• Tachycardia
The primary indication for hemodynamic monitoring is the management of critically ill patients who demonstrate evidence of compromised cardiovascular function. As such, hemodynamic monitoring can be used for the diagnosis and treatment of life-threatening conditions, such as shock, heart failure, pulmonary hypertension, complicated myocardial infarction, post–cardiac surgery, acute respiratory distress syndrome (ARDS), chest trauma, severe burn injury, and severe dehydration.
Invasive hemodynamic monitoring requires the insertion of arterial and intracardiac catheters. Measurements typically include systemic arterial pressure, central venous pressure, pulmonary artery (PA) pressures, as well as arterial and mixed venous blood gases and cardiac output. Once obtained, these measurements can be used to calculate a series of derived variables, including oxygen delivery, cardiac index (CI), stroke index, vascular resistance, and cardiac work, which in turn can be used to better define abnormalities in cardiopulmonary function and ultimately guide therapeutic interventions.
The efficacy and potential risks of hemodynamic monitoring have been the subject of considerable debate. However, most agree that the benefits outweigh the risks in critically ill patients who require continuous hemodynamic monitoring. A consensus statement released in 2000 by the National Heart, Lung and Blood Institute and the U.S. Food and Drug Administration suggested that more randomized clinical studies should be performed to better determine which patients would benefit most from hemodynamic monitoring.1 Furthermore, it was agreed that all clinicians involved in hemodynamic monitoring should have a working knowledge of cardiovascular physiology and the technical problems most often encountered with this type of monitoring. This chapter presents information that will help clinicians avoid many of the technical problems associated with hemodynamic monitoring. It also provides a concise description of the measurements and derived variables that are most often used and explains how they can be applied to patient treatment.
Review of Cardiovascular Principles
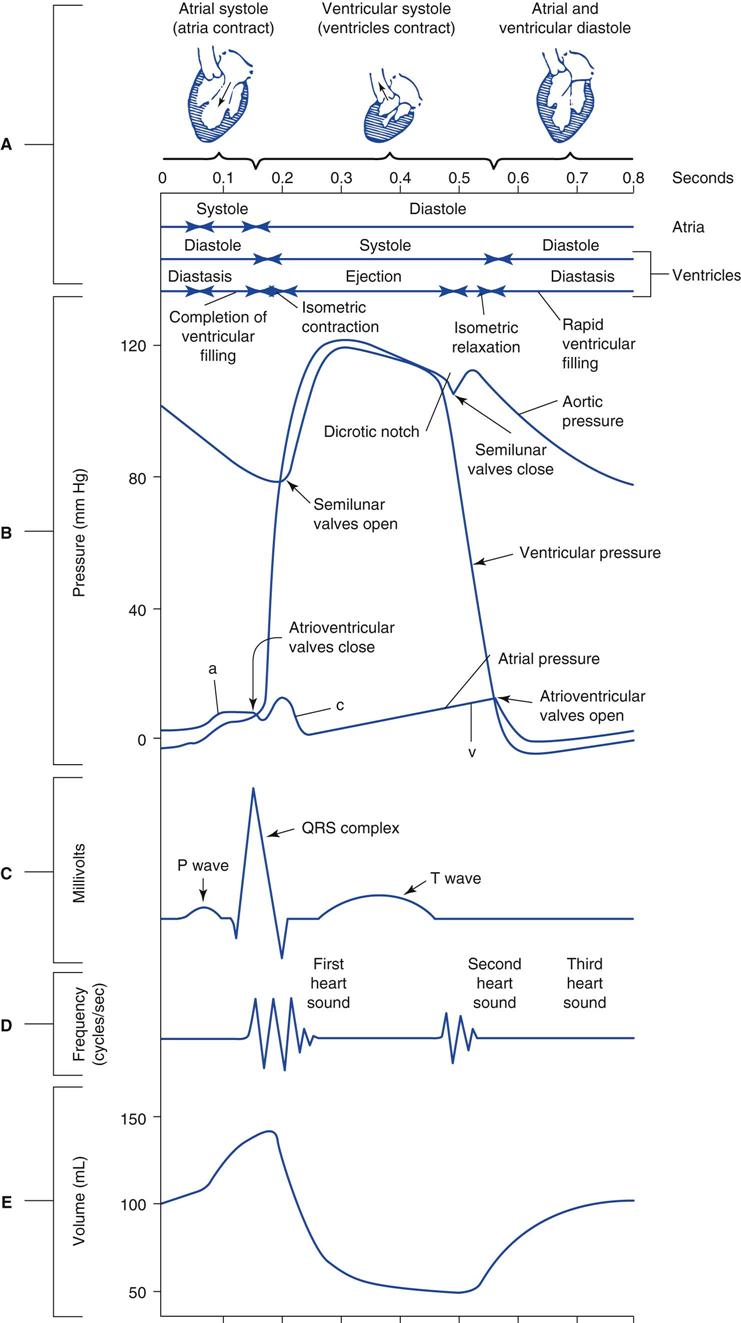
It is important to understand the sequence of mechanical events occurring during the cardiac cycle to appreciate fully the various factors that influence hemodynamic measurements. Fig. 11-1 is a Wiggers diagram that illustrates the pressure and volume events that occur in the left and right heart chambers and aorta during a single heartbeat. A more detailed description of these events can be found in the references listed at the end of this chapter.2,3
Factors Influencing Cardiac Output
The outputs of the right and left ventricle are ultimately influenced by four main factors: heart rate, preload, contractility, and afterload. An individual’s heart rate, which is simply the number of times the heart beats per minute, can vary considerably, depending on the patient’s age and body habitus, core temperature, level of activity, and even psychological state. Indeed, heart rates can range from 50 to 200 beats per minute in a normal healthy adult.
The preload, which is typically defined as the filling pressure of the ventricle at the end of ventricular diastole is estimated by measuring the end-diastolic pressures (EDP). The amount of blood present in the ventricle at the end of ventricular diastole depends on the level of venous return and the compliance of the ventricle. Ultimately preload reflects the length of the ventricular muscle fibers and thus the ability of these fibers to generate the necessary tension in the next ventricular contraction. This is a basic principle of cardiovascular physiology (sometimes called the Frank-Starling mechanism or length-tension relationship). This principle states in most basic terms that the heart pumps what it receives. This relationship holds until one reaches relatively high ventricular volumes when the muscle fibers are overstretched and unable to generate the necessary tension to elicit a contraction that will adequately eject the required stroke volume. The end result at these higher ventricular volumes is ventricular dilation and failure.
The right ventricular end-diastolic pressure (RVEDP) is typically used as an indicator of the right ventricular preload, and the left ventricular end-diastolic pressure (LVEDP) is used to estimate the left ventricular preload. Because both of these intracardiac pressures are difficult to measure in the critical care setting, clinicians rely on measurements of right atrial (RAP) or central venous pressure (CVP) and pulmonary artery occlusion pressure (PAOP, which for practical purposes is equivalent to pulmonary capillary wedge pressure, or PCWP) to estimate the RVEDP and LVEDP, respectively. It is important to understand that CVP and PAOP can accurately reflect the RVEDP and LVEDP only when the former measurements are made at the end of ventricular diastole and if there is no evidence of valve dysfunction because they are registering retrograde* pressures in the right and left atria.
Contractility, which is related to the force that the ventricle generates during each cardiac cycle, can be estimated using the ejection fraction, which is calculated as the ratio of the stroke volume to the ventricular end-diastolic volume. For example, a 154-lb (70-kg) adult male typically has a stroke volume of about 70 mL and an end-diastolic volume of about 140 mL. His ejection fraction would be equal to 0.5 (70 mL/140 mL). Alternatively, contractility can be estimated by calculating the slope of ventricular pressure time interval during the initial period of contraction. This change in pressure relative to time (dP/dT) is thought to be a practical way of estimating the force of ventricular muscle contraction.
Afterload is usually defined as the impedance that the left and right ventricles must overcome to eject blood into the great vessels. Clinically, this impedance is better expressed as systemic and pulmonary vascular resistances. The systemic vascular resistance (SVR) is used to describe the afterload that the left ventricle must overcome to eject blood into the systemic circulation. The pulmonary vascular resistance (PVR) reflects the afterload that the right ventricle must overcome to eject blood into the pulmonary circulation. Increases in afterload are generally associated with reductions in cardiac output, whereas decreases in afterload are associated with increases in cardiac output. For example, systemic hypertension and pulmonary hypertension lead to increases in SVR and PVR, respectively. In both cases, the cardiac output will be reduced. Administering a systemic vasodilator (e.g., nitroprusside) or a pulmonary vasodilator (e.g., tolazoline) will reduce the SVR and PVR, respectively, and result in an increase in cardiac output.
Obtaining Hemodynamic Measurements
Clinicians who perform hemodynamic monitoring must understand the physical and technical factors that can influence intravascular measurements and thus determine the likelihood of obtaining meaningful data. The following sections first describe how hemodynamic measurements are obtained and then discuss how various pathophysiologic events can alter pressure, volume, and flow tracings.
Hemodynamic Monitoring Systems
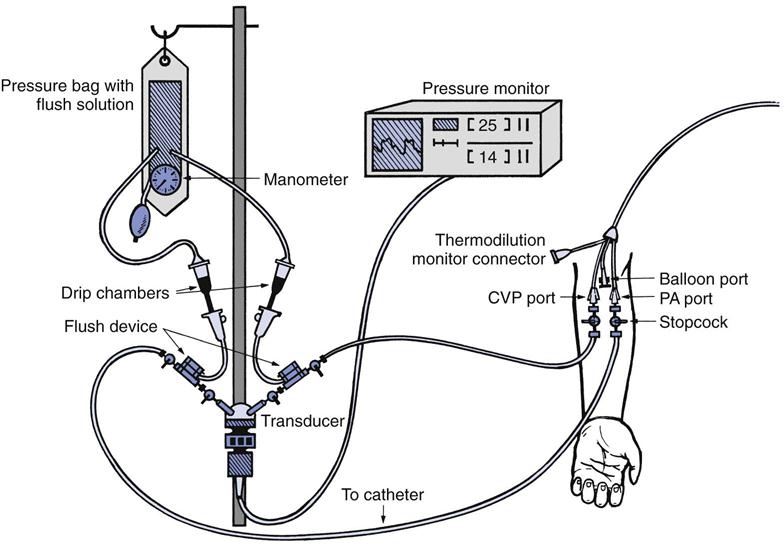
Hemodynamic monitoring systems consist of equipment that detects small physiological signal (vascular pressure) changes and converts them to electrical impulses, which can then be amplified and recorded on a cathode ray tube monitor or strip chart recorder. As shown in the invasive vascular monitoring system in Fig. 11-2, a catheter is inserted into a peripheral artery, a central vein, or pulmonary artery. The catheter transmits pressure changes within the vessel or cardiac chamber through a hollow, plastic tubing filled with a heparinized solution of saline to a transducer, which converts these fluid pressure changes to a digital signal for display.
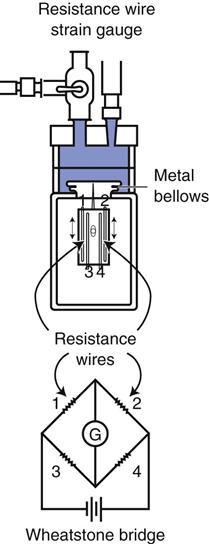
A strain gauge pressure transducer (Fig. 11-3) uses an electrical circuit known as a Wheatstone bridge.3 The operating principle for this type of device is fairly straightforward. Fluid enters the dome portion of the transducer by way of the fluid-filled plastic line (see Figs. 11-2 and 11-3). A diaphragm separates the fluid from the electronic portion of the transducer. Changes in pressure in the fluid result in movement of the diaphragm, which causes an increase or decrease in the length of the wires of the Wheatstone bridge. This, in turn, causes an imbalance or change in resistance to the current flow through the Wheatstone bridge. Thus the pressure changes are directly proportional to the change in current flow through the circuit and inversely proportional to the resistance offered by the circuit.
Fluid Pressures
Fluid can exert pressure while it is in motion (hydrodynamic pressure) or while at a standstill (hydrostatic pressure). These pressures play integral roles when using hemodynamic monitoring systems. Two factors affect fluid-filled systems:
The dynamic pressure element is pressure applied to fluid inside a system by fluid outside a system. It has to do with catheter position in relation to the flow of the blood within the vessel. For example, for an arterial line placed in a radial artery to accurately measure pressures that are the direct result of the work of the left heart, it must be placed with the end of the catheter facing the source of blood flow (“looking” upstream). A PA catheter, which measures pressures within a vessel or chamber, must be placed so that the tip of the catheter is facing downstream with the flow of blood to estimate blood pressures filling the left side of the heart.
Static pressure head refers to the pressure placed on the transducer as related to the tip of the catheter. To measure pressure accurately, the transducer must be at the same height or level as the catheter tip. If the catheter tip is higher than the transducer, the monitor will read higher than the actual pressure as a result of the fluid “pushing” downstream (because of gravity) from the catheter tip to the transducer. If the catheter tip is placed lower than the transducer, the fluid will flow away from the transducer toward the catheter tip and produce a reading lower than the actual pressure. The degree of error is about 1.86 mm Hg for each centimeter of distance from the reference point (e.g., if the transducer is 5 cm above the reference point, then the corrected measurement should be 9.3 mm Hg [5 × 1.86 = 9.3]). This adjustment can be avoided by leveling the transducer with the mid-thoracic line of the patient—the epistatic line to measure CVP accurately. This is about 5 cm behind the sternal angle (the angle of Louis). Once the epistatic line has been determined, it is important to zero-balance the transducer to this reference point. Zero-balancing the transducer references the transducer to atmospheric pressure, which is usually read as zero.
Systemic Artery Catheterization
Direct measurement of the systemic arterial pressure requires the insertion of a catheter into a peripheral artery, such as the radial, brachial, or femoral arteries. Note that the radial artery is the most commonly used site because of easy accessibility and because of collateral circulation to the hand from the ulnar artery. Either a percutaneous technique or a surgical cut-down technique can be used to insert the catheter. The percutaneous approach typically is used in the critical care setting; the surgical cut-down procedure is used when the percutaneous technique is unsuccessful.4,5 Box 11-1 summarizes the recommended technique for inserting and maintaining a systemic arterial line (Key Point 11-1).
 Key Point 11-1
Allen’s test must be performed before a radial artery catheter is inserted.
After the catheter has been positioned in the artery, a surgical dressing is applied and the catheter is secured with tape or sutured to the skin. Maintenance of the arterial line requires the use of a continuous pressurized flush mechanism to irrigate the catheter with a heparinized solution at a low flow (e.g., 2-3 mL/h).5 The irrigating solution consists of a bag of 0.9% sodium chloride (NaCl) containing 1 to 2 units of heparin per milliliter of normal saline (i.e., 100-200 units of heparin/dL). Commercially available arterial line sets also have a rapid flush mechanism for quickly clearing the catheter. Prolonged or frequent flushing of the arterial line should be avoided because this can lead to the inadvertent administration of large amounts of flush volume to the patient. This latter point is a particularly important issue for neonates and pediatric patients who weigh less than 44 lb (20 kg).
Daily inspection of the insertion site for signs of infection, ischemia, and bleeding is essential to avoid serious complications. Certain factors can increase the risk of infections in patients with arterial lines:
Distal ischemia should be suspected when pallor distal to the insertion site occurs, particularly if it is accompanied by pain and parenthesia in the affected limb. The most common cause of decreased perfusion is thrombus formation, which occludes the catheter tip. Other risk factors for acute distal ischemia include hypotension, severe peripheral vascular disease, and the use of vasopressor drugs.4,5
Fever in any patient with an intravascular line should alert the clinician of infectious complications. The catheter is removed if there is evidence of local infection or the presence of distal ischemia. Difficulty withdrawing blood or persistence of damped tracings should also alert the clinician of possible complications, such as the presence of air bubbles in the line or occlusion of the catheterized artery.
Bleeding can occur if the line becomes disconnected or is improperly handled. Hemorrhage is a distinct possibility if the line is left open; therefore the clinician should stabilize the catheterized site by taping the patient’s arm to a board and placing it above the bed linens for easy observation. Another common problem encountered with the insertion of arterial lines is hematoma formation, which can occur if bleeding occurs under the skin during or immediately after the catheterization procedure. Hematoma typically occurs more often when the catheter is placed through a large gauge needle.
Central Venous Lines
Catheters placed in the vena cava or right atria are generally called central venous lines. Although these lines most often are used to administer fluids, drugs, and nutritional solutions, they can also be used to monitor right heart pressures. During ventricular systole or atrial diastole, when the tricuspid valve is closed, the pressure measured in the right atrium or vena cava reflects the RAP. At the end of ventricular diastole and atrial systole, when the tricuspid valve is open, the pressure measured in the right atrium reflects the right ventricular pressure (RVP). Thus, the CVP measured at the end of ventricular diastole can be used to estimate the filling pressure or the preload of the right ventricle (i.e., RVEDP).
CVP catheters are usually inserted percutaneously into a large central vein, such as the internal jugular, or peripherally through the medial basilic or lateral cephalic vein.6 Pressure measurements are usually performed during exhalation and when the patient is supine. The transducer is zeroed at the level of the right atrium. A normal value for CVP is 2 to 6 mm Hg.
The most common problems encountered with insertion of CVP catheters are pneumothorax, hemothorax, and vessel damage. Other potential complications include infection, thrombosis, and bleeding. Placement of the catheter usually is confirmed radiographically.
Pulmonary Artery Catheterization
Bedside catheterization of the right heart and pulmonary artery (PA) became possible when Swan and colleagues7 introduced a balloon-tipped, flow-directed catheter in the early 1970s.8 The balloon-tipped, flow-directed catheter (also referred to as the Swan-Ganz catheter or pulmonary artery catheter) (Fig. 11-4) is a multiple-lumen catheter constructed of radiopaque polyvinylchloride. The standard adult catheter is 110 cm in length and is available in 7 or 8 French (Fr) sizes. Remember that the French size divided by π or 3.14 equals the external diameter of the catheter in millimeters. Pediatric catheters are 60 cm in length and available in 4 or 5 Fr sizes. Both adult and pediatric catheters are marked at 10-cm increments. As with systemic arterial catheters, a pressurized flush solution must be run through the catheter at a rate of 1 to 5 mL/h (except when making pressure measurements) to prevent clot formation within the catheter’s lumen.
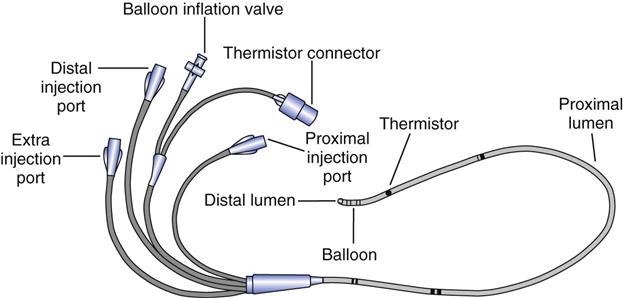
 monitoring and the balloon are also located at the tip. The thermistor bead is located 1.5 inches from the tip and is connected by a wire through the catheter to the connector for the thermodilution cardiac output computer. The proximal lumen located 30 cm back from the tip opens into the right atrium. Catheters are available for ventricular, atrial, or atrioventricular sequential pacing using either pacemaker bands positioned on the catheter or pacing leads, which are passed through the lumen. Ventricular bands or lumens are located 20 cm from the tip; atrial, 30 cm from the tip. CVP, Central venous pressure.
Dual-lumen catheters have one lumen that connects to a balloon located near the tip of the catheter and a second lumen that runs the length of the catheter terminating at a port at the distal end of the catheter. Triple-lumen catheters have an additional proximal port that terminates approximately 30 cm from the tip of the catheter, or at the level of the right atrium. This third lumen can be used to measure right atrial pressures or for administrating intravenous medications. It is also used for instilling the injectate during thermodilution measurements of cardiac output.
Thermodilution catheters incorporate a fourth lumen, which contains electrical wires that connect to a thermistor located approximately  inches (3 cm) from the tip of the catheter. Pacing catheters with bands for atrial, ventricular, and atrioventricular (AV) cardiac pacing are also available. The bands, which are located approximately 20 cm from the tip of the catheter, have external leads that connect to a pacemaker.
As with CVP catheters, PA catheters can be inserted using a percutaneous approach or via surgical cut-down technique. The subclavian, internal jugular, external jugular, femoral, or antecubital veins are usually used for percutaneous insertion; surgical cut-down is often necessary when the subclavian or antecubital veins are used. The clinician must consider a number of potential complications when choosing an insertion site, including pneumothorax, arterial lacerations, venous thrombosis or phlebitis, and air embolism (Table 11-1).
TABLE 11-1
Insertion Sites of the Pulmonary Artery Catheter and Associated Problems
| Site | Associated Problems |
| Internal jugular | Pneumothorax, hemothorax |
| Subclavian | Severe thrombocytopenia (difficult-to-control bleeding), pneumothorax (more frequently than with internal jugular), hemothorax |
| Antecubital | Phlebitis; catheter tip may migrate with movement of the arm ; difficult site for catheter advancement |
| Femoral | Phlebitis; catheter tip may migrate with movement of the leg |
Positioning the catheter can be accomplished by fluoroscopy or by monitoring the pressure tracings generated as the catheter is slowly advanced into the right side of the heart and pulmonary artery. Fluoroscopy typically is reserved for the catheterization laboratory, whereas continuous pressure monitoring with electrocardiography is routinely used in the critical care setting.
Figure 11-5 shows a series of tracings obtained during PA catheter placement.8,9 The catheter is introduced into the peripheral vein and slowly advanced until it enters the intrathoracic vessels (i.e., superior or inferior vena cava). When the catheter enters into the intrathoracic vessels, venous pulse waveforms with characteristic respiratory fluctuations are recorded. If these respiratory fluctuations are absent, the results obtained will be erroneous. Loss of these respiratory fluctuations may indicate that the stopcock is closed between the catheter and the pressure transducer. It can also occur if catheter is kinked or a blood clot or air is present in the tubing. Once the catheter enters the intrathoracic vessels, the balloon is inflated with air so that it can be flow-directed by the blood through the right atrium and right ventricle into the pulmonary artery. (NOTE: It is important to fully inflate the balloon to avoid endocardial or pulmonary artery damage or induce ventricular arrhythmias.) Pediatric (4-5 Fr) catheters have a balloon volume of 0.8 mL; the balloon volume for adult (7-8 Fr) catheters is 1.5 mL. The catheter is slowly advanced until it wedges in a small pulmonary artery.

As shown in Fig. 11-5, the wedge position can be easily identified because the PAOP is characteristically lower than or equal to the pulmonary artery diastolic pressure. An overdamped tracing (i.e., loss of a distinctive PAOP waveform) usually indicates a mechanical problem, such as the presence of an air bubble in the catheter tubing, or the protrusion of the balloon over the tip of the catheter. The mean wedge pressure may exceed the PA diastolic pressure in patients with mitral stenosis or mitral regurgitation.10 The wedge pressure can be identified by another means; when the catheter occludes a small pulmonary artery, a continuous column of blood equilibrates between the left atrium and the distal port of the catheter and the pressure tracing will register a left atrial waveform (i.e., a, c, and v waves).
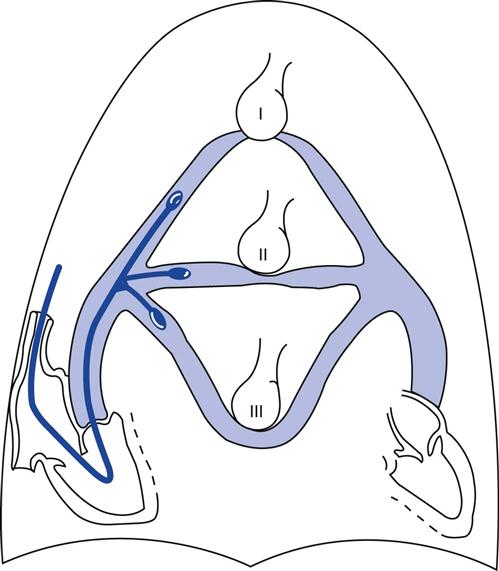
The catheter must be wedged in a zone 3 position in the lung to reflect the pulmonary venous pressure accurately.11 As illustrated in Fig. 11-6, if the catheter is positioned in zone 1 or zone 2, the alveolar pressure will exceed the pulmonary venous pressure and cause the vessels distal to the balloon to collapse (Table 11-2). The intravascular pressure reading will reflect the intraalveolar pressure rather than the pressure transmitted from the left atrium. This problem is accentuated by the application of PEEP during mechanical ventilation (i.e., the alveolar pressure rises) or by hemorrhage when the pulmonary venous pressure is reduced. We will discuss this problem in more detail later in this chapter (Key Point 11-2).
TABLE 11-2
| Lung Zone | Pressure Relationships | Explanation |
| Zone 1 | Palv > Pa > Pv | Basically functions as alveolar dead space—ventilation in excess of perfusion |
| Zone 2 | Pa > Palv > Pv | Blood flow is due to the pressure difference between pulmonary artery and alveolar pressures |
| Zone 3 | Pa > Pv > Palv | Blood flow is due to arteriovenous pressure differences |
*Palv = alveolar pressure; Pa = arterial pressure;  = venous pressure.
 Key Point 11-2
The PA catheter must be wedged in a zone 3 position in the lung to reflect the pulmonary venous pressure accurately.
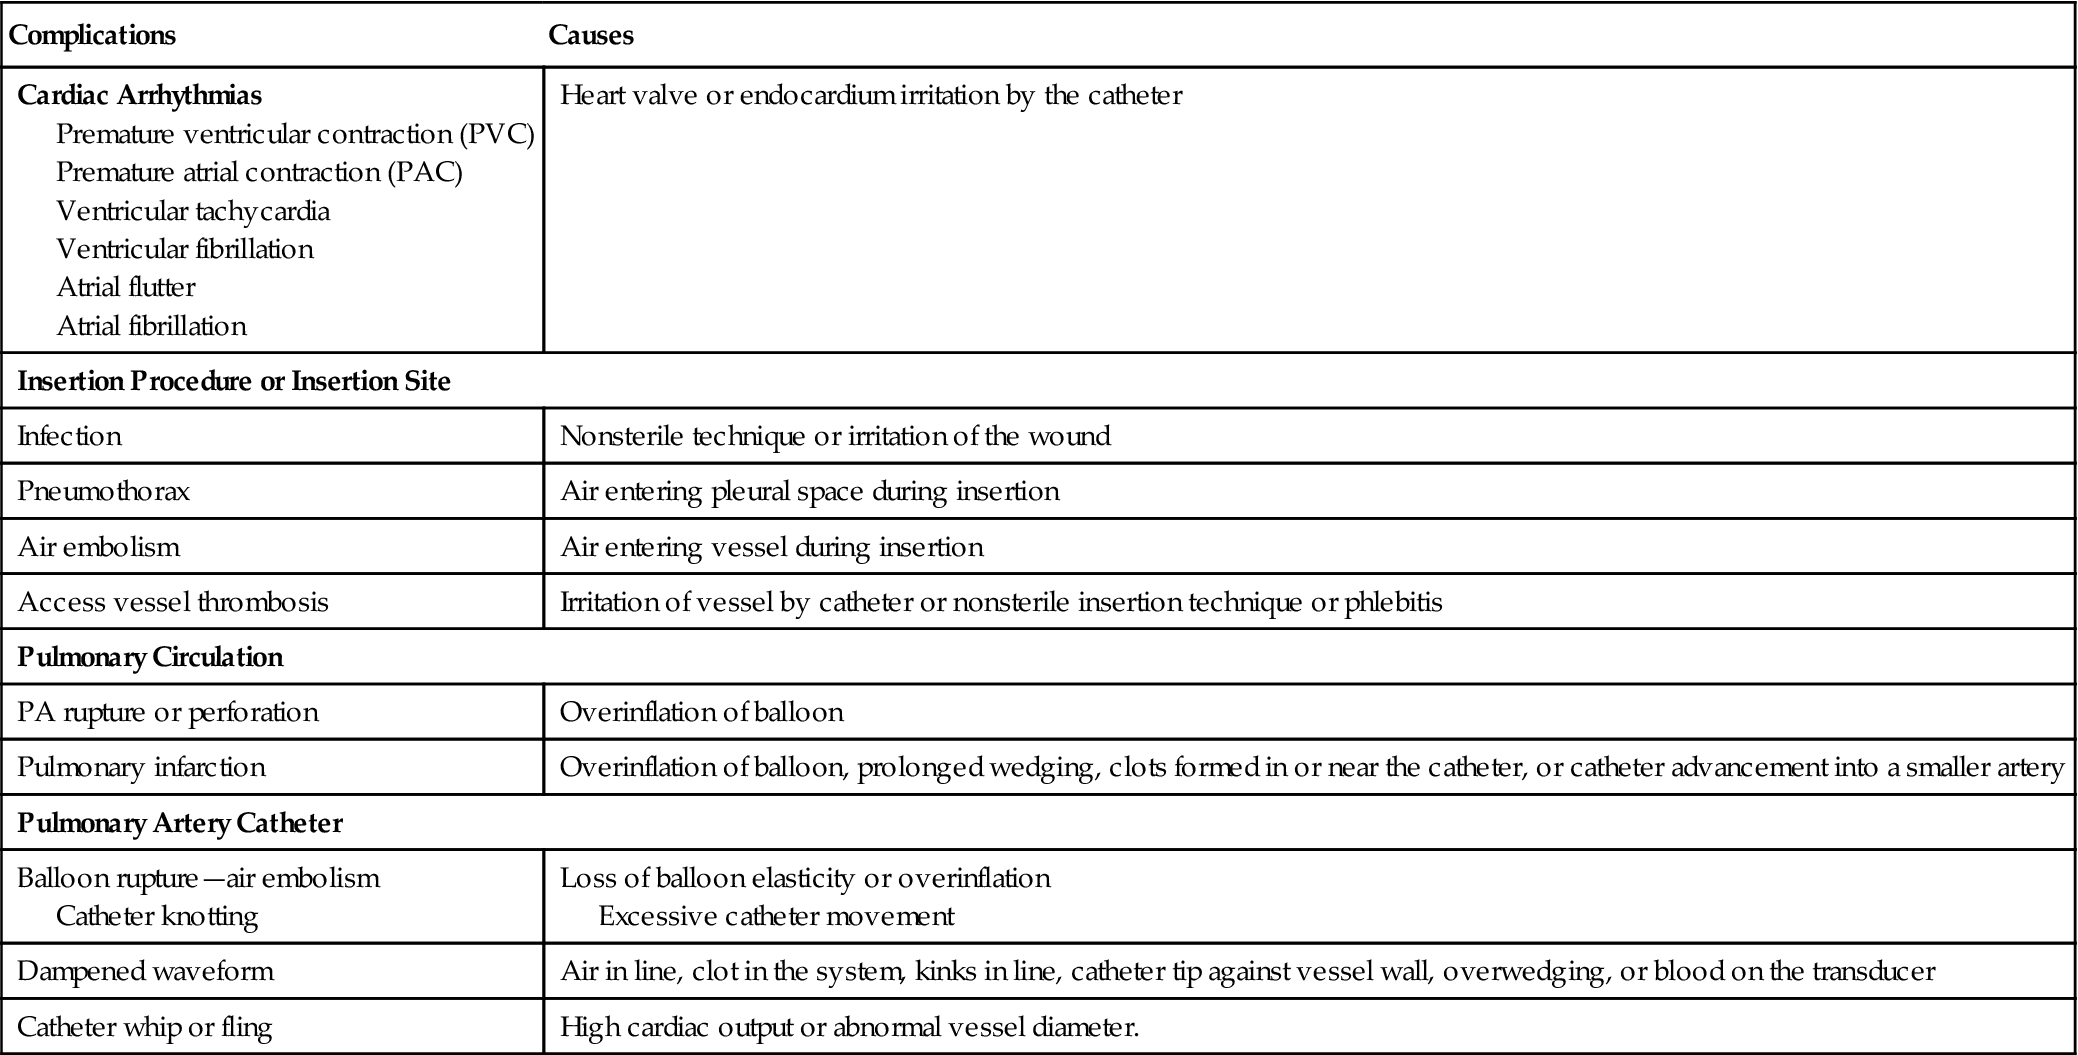
Table 11-3 lists the most common complications associated with right heart catheterization using a balloon-tipped, flow-directed catheter. Ventricular arrhythmias are fairly common during catheter insertion and often are self-limiting. Electrolyte disturbances, hypoxemia, and acidosis increase the risk of developing ventricular ectopy. Careful monitoring of the patient’s electrocardiogram (ECG) during catheter placement can alert the clinician of the development of arrhythmias and reduce chances of provoking a potentially lethal complication such as ventricular tachycardia and fibrillation.
TABLE 11-3
Complications Associated with Pulmonary Artery Catheterization
| Complications | Causes |
| Cardiac Arrhythmias Premature ventricular contraction (PVC) Premature atrial contraction (PAC) Ventricular tachycardia Ventricular fibrillation Atrial flutter Atrial fibrillation | Heart valve or endocardium irritation by the catheter |
| Insertion Procedure or Insertion Site | |
| Infection | Nonsterile technique or irritation of the wound |
| Pneumothorax | Air entering pleural space during insertion |
| Air embolism | Air entering vessel during insertion |
| Access vessel thrombosis | Irritation of vessel by catheter or nonsterile insertion technique or phlebitis |
| Pulmonary Circulation | |
| PA rupture or perforation | Overinflation of balloon |
| Pulmonary infarction | Overinflation of balloon, prolonged wedging, clots formed in or near the catheter, or catheter advancement into a smaller artery |
| Pulmonary Artery Catheter | |
| Balloon rupture—air embolism Catheter knotting | Loss of balloon elasticity or overinflation Excessive catheter movement |
| Dampened waveform | Air in line, clot in the system, kinks in line, catheter tip against vessel wall, overwedging, or blood on the transducer |
| Catheter whip or fling | High cardiac output or abnormal vessel diameter. |
Box 11-2 lists the risk factors most often associated with PA infarction and rupture.12,13 PA infarction and rupture can be minimized by preventing thrombus development, which is accomplished by instilling a continuous flushed solution containing heparin. Pulmonary infarction and rupture can also be reduced by ensuring that the catheter balloon is deflated after wedge pressure measurements are made. Furthermore, it is important that the balloon is inflated for only 15 to 30 seconds when measuring the PAOP, particularly in patients with pulmonary hypertension. Balloon rupture is most often associated with prolonged duration of catheterization because the balloon will typically lose its elasticity with exposure to blood.
Interpretation of Hemodynamic Profiles
As mentioned previously, accurate interpretation of hemodynamic data requires a working knowledge of cardiovascular physiology. The hemodynamic profile ultimately focuses on those factors that influence cardiac output, namely, heart rate, preload, contractility, and afterload.
The information in this section provides an overview of basic measurements and derived variables used in a standard hemodynamic profile. A list of excellent references related to hemodynamic monitoring in clinical practice can be found at the end of this chapter for more detailed information about this area of clinical physiology.
Heart Rate
The resting heart rate of a healthy adult is typically 60 to 100 beats/min. The heart rates for neonates and infants are considerably higher. Although the resting heart rates for toddlers and adolescents are higher than for adult subjects, the difference is minimal by the end of the first decade of life.14 Table 11-4 compares the mean and normal range for heart rate at various stages of life.14
TABLE 11-4
Normal Blood Pressures and Heart Rates in Children
| Age | Blood Pressure Average for Males (girls 5% lower) | Heart Rate | |
| Average | Range | ||
| Neonate | 75/50 | 140 | 100-190 |
| 1-6 mo | 80/50 | 145 | 110-190 |
| 6-12 mo | 90//65 | 140 | 110-180 |
| 1-2 yr | 95/65 | 125 | 100-160 |
| 2-6 yr | 100/60 | 100 | 65-130 |
| 6-12 yr | 110/60 | 80 | 55-110 |
| 12-16 yr | 110/65 | 75 | 55-100 |
Stay updated, free articles. Join our Telegram channel

Full access? Get Clinical Tree


