Assessment of Respiratory Function
Learning Objectives
On completion of this chapter, the reader will be able to do the following:
1 Describe the principle of operation of the pulse oximeter.
2 Identify conditions that can influence the accuracy of pulse oximetry readings.
4 Discuss the normal components of a capnogram.
5 Give examples of pathophysiologic conditions that can alter the contour of the capnogram.
6 Identify the normal value for arterial-to-end-tidal partial pressure of carbon dioxide (P(a-et)CO2.)
8 Explain the theory of operation of transcutaneous PO2 and PCO2 monitors.
9 List the clinical data that should be recorded when making transcutaneous measurements.
10 Describe the major components of an indirect calorimeter.
12 Discuss some clinical applications of metabolic monitoring in critically ill patients.
14 Calculate mean airway pressure, dynamic compliance, static compliance, and airway resistance.
15 Identify pathological conditions that alter lung compliance and airway resistance.
Key Terms
• Capnography
• Fractional hemoglobin saturation
• Functional hemoglobin saturation
• Indirect calorimetry
• Pulse oximetry
• Transcutaneous monitoring
Procedures and devices, such as pulse oximetry, capnography (capnometry), transcutaneous monitoring of blood gases, indirect calorimetry, and bedside lung function testing have made it possible for respiratory therapists to noninvasively monitor respiratory function in mechanically ventilated patients. When it is used appropriately, noninvasive monitoring can provide valuable information for clinicians managing patients receiving ventilatory support. However, if it is used indiscriminately, it can be distracting and confusing for the clinician and economically costly for the patient.
Noninvasive Measurements of Blood Gases
Pulse Oximetry
Hypoxemic events in mechanically ventilated patients are most often associated with apnea, airway obstruction, equipment failure or disconnection, and incorrect gas flow settings. Visual recognition of hypoxemia by physical examination is often unreliable because of intraobserver variability, differences in patients’ skin pigmentation, and interference by ambient lighting.1,2 Laboratory measurement of arterial blood gases (ABGs) remains the gold standard for measuring the level of hypoxemia (see Evolve website for a review of ABGs); however, this procedure is performed intermittently and may fail to detect transient hypoxic episodes.
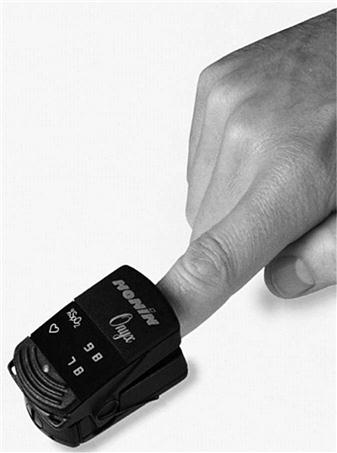
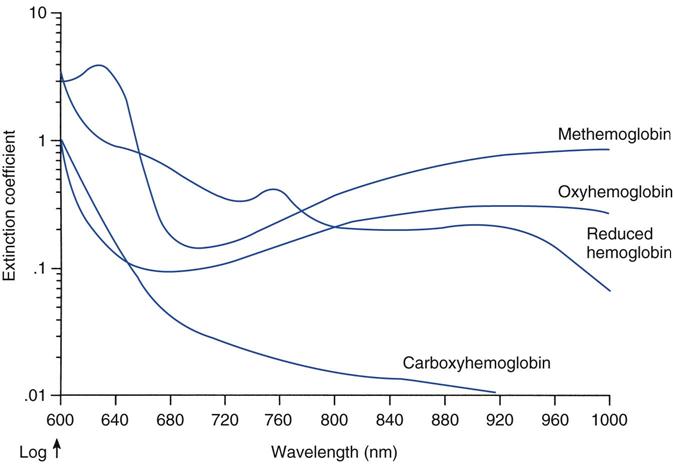
Pulse oximetry provides continuous, noninvasive measurements of arterial oxygen saturation.3 A sensor is placed over a digit, an earlobe, the forehead or the bridge of the nose; this sensor measures the absorption of selected wavelengths of light beamed through the tissue (Fig. 10-1). For example, oxyhemoglobin can be differentiated from deoxygenated hemoglobin by shining two wavelengths of light (660 and 940 nm) through the sampling site. As Fig. 10-2 illustrates, at a wavelength of 660 nm (red light), deoxygenated hemoglobin absorbs more light than oxyhemoglobin. Conversely, oxyhemoglobin absorbs more light at 940 nm (infrared light [IR]) than does deoxygenated hemoglobin.
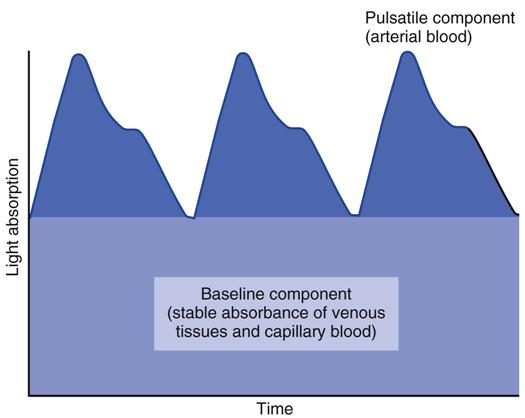
Pulse rate is determined by relating cyclical changes in light transmission through the sampling site with blood-volume changes that occur during ventricular systole and diastole. That is, as local (e.g., finger, toe, or earlobe) blood volume increases during ventricular systole, light absorbency increases and transmitted light decreases. In contrast, as blood volume decreases during diastole, absorbency decreases, and transmitted light increases. Fig. 10-3 illustrates the pulsatile or alternating current (AC) and nonpulsatile or direct current (DC) components of a typical pulse oximetry signal.
The percentage of oxyhemoglobin present can be determined by first calculating the ratio of absorbencies for pulsatile and nonpulsatile flow, at the two specified wavelengths, or
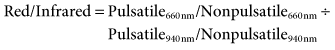
This ratio is then applied to an algorithm that relates ratios of these two absorbencies to oxyhemoglobin saturation.4
Physiologic and Technical Concerns
Pulse oximeters generally are accurate for oxygen saturations greater than 80%.5,6 Pulse oximeter saturations less than 80% should be confirmed with laboratory analysis of ABGs, including CO-oximetry.7,8 A number of physiologic and technical factors can influence the accuracy of pulse oximetry measurements, including low perfusion states, the presence of dysfunctional hemoglobins and dyes, variations in patients’ skin pigmentation, and ambient light interference. The following is a summary of various factors that can influence pulse oximetry readings. A more detailed discussion of each of these factors can be found in the references listed at the end of this chapter.
Low Perfusion States
It should be apparent that the accuracy of a pulse oximeter reading is dependent on the identification of an arterial pulse. In cases where perfusion is low, such as hypovolemia, the pulse oximeter may not be able to accurately identify a pulsatile signal, resulting in either an intermittent or absent SpO2 reading. Other situations that may contribute to this problem include administering peripheral vasoconstrictors, hypothermia, and heart-lung bypass (i.e., extracorporeal membrane oxygenation).9 Although some oximeters are better than others in dealing with low perfusion states, compensation for the weak signal associated with low perfusion states is limited. The reason for this limitation is that a low perfusion state produces a low signal-to-noise ratio and, thus, a signal that can be potentially altered by motion artifacts.
The Masimo Signal Extraction Technology (SET) (Masimo Corp, Irvine, Calif.) pulse oximeter is a relatively new processing system that uses special algorithms to minimize interference from motion artifacts. Conventional pulse oximetry assumes that arterial blood accounts for the pulsations or AC component of the pulse oximetry signal, while venous blood produces a non-pulsatile or DC component of the signal. During patient motion, the venous blood may also contribute to the pulsatile signal and cause the pulse oximeter to underestimate the SpO2 because it cannot distinguish between the arterial and venous blood. Masimo SET signal processing identifies the venous blood signal, isolates it, and using adaptive filters, cancels the noise and extracts the arterial signal. When tested on healthy individuals simulating various motion artifacts, the Masimo SET oximeter exhibited a much lower error rate compared with conventional pulse oximeters. Studies with critically ill patients also demonstrated fewer false alarms of hypoxemia when compared to conventional pulse oximeters10
Dysfunctional Hemoglobins and Dyes
Adult blood typically contains four types of hemoglobin: reduced or deoxygenated hemoglobin (HHb), oxyhemoglobin (O2Hb), carboxyhemoglobin (COHb), and methemoglobin (MetHb). Two terms that are often used when describing oxyhemoglobin saturation are fractional and functional saturations. Fractional hemoglobin saturation is calculated by dividing the amount of oxyhemoglobin measured by the sum of concentrations all four types of hemoglobin present, or

Functional hemoglobin saturation is calculated by dividing the oxyhemoglobin concentration by the concentration of hemoglobin capable of carrying oxygen, or

Laboratory CO-oximeters measure all four types of hemoglobin by using separate wavelengths of light to identify each species, whereas pulse oximeters use only two wavelengths to quantify the amount of O2Hb and HHb present. Laboratory CO-oximeters are therefore capable of reporting fractional oxyhemoglobin saturations, and pulse oximeters are typically described as evaluating functional hemoglobins.
This description of a pulse oximeter capability may be somewhat misleading because, as Fig. 10-2 shows, O2Hb and COHb have similar absorption coefficients for red light (660 nm), whereas COHb is relatively transparent to infrared light (940 nm). Additionally, MetHb and HHb have the same absorption coefficients for red light; however, MetHb demonstrates a greater absorbency for infrared light (940 nm) than does oxyhemoglobin. Accordingly, the presence of significant levels of COHb, as occurs in carbon monoxide poisoning, will lead to an overestimation of SpO2 (Key Point 10-1).8 Methemoglobinemia, a complication of administering benzocaine (topical anesthetic) and dapsone (an antibiotic used to treat malaria and Pneumocystis carinii), can cause erroneous SpO2 values because MetHb absorbs both red and IR light.11 If enough MetHb is present to dominate all pulsatile absorption, the pulse oximeter will measure a red-to-IR ratio of 1 : 1, corresponding to an SpO2 of about 85%. Consequently, the pulse oximeter reading will overestimate or underestimate the true oxyhemoglobin saturation, depending on whether the actual SaO2 is less than or more than 85%.9,11
 Key Point 10-1
Abnormal hemoglobin, such as carboxyhemoglobin (smoke exposure), produces an erroneously high SpO2. If an abnormal hemoglobin is suspected, a CO-oximeter should be used to evaluate the oxygen saturation.
It is well documented that intravascular dyes can adversely affect SpO2 values by absorbing a portion of the incident light emitted by the pulse oximeter diodes. Scheller and colleagues12 demonstrated that injection of methylene blue and indigo carmine into human volunteers caused a false drop in SpO2, whereas indocyanine green had little effect on pulse oximeter values.
Nail Polish
Nail polish (particularly blue and black nail polish) can severely affect SpO2 readings. Some believe that nail polish causes light to be shunted around the finger periphery (called optical shunting).13,14 The transmitted light never comes in contact with the vascular bed; consequently, SpO2 values can be erroneously high or low, depending on whether this light takes on a pulsatile character. This problem can largely be alleviated by placing the device over the lateral aspects of the digit rather than over the nail.
Skin Pigmentation
Theoretically, skin pigmentation should have no effect on pulse oximeter readings. In practice, however, SpO2 readings are typically higher for patients with dark skin pigmentation. For example, an SpO2 of 95% in an African American patient may actually represent an SaO2 of only 92%.15–17 Many clinicians, therefore, use higher threshold values (i.e., SpO2 >92%) for initiating oxygen therapy in African American patients. Although using higher target SpO2 values does not lead to untreated hypoxemia in most of these patients, some will have arterial oxygen pressure (PaO2) values as high as 200 mm Hg when therapy is based on measured SpO2.
Bilirubin, a breakdown product of heme metabolism, is the pigment responsible for the yellow discoloration seen in jaundiced patients. Although an elevated bilirubin level (>20 mg/dL) has been shown to affect O2Hb values recorded with CO-oximetry, pulse oximetry measurements do not appear to be affected by hyperbilirubinemia.18,19
Ambient Light
Direct sunlight and external light sources (e.g., fluorescent lights, heat lamps, fiberoptic light sources, and surgical lamps) have been shown to affect SpO2 readings adversely.20–22 Most commercially available pulse oximeters attempt to compensate for this interference by continually cycling the transmitted red and IR light on and off at a rate of about 480 cycles per second.
Clinical Applications
The usefulness of pulse oximetry as an early warning system for detecting hypoxemia in patients with unstable oxygenation status is well recognized. Pulse oximetry is an excellent trending device in critically ill patients, providing a continuous display of oxygen saturation. However, changes in SpO2 may not represent an equivalent change in actual SaO223,24 This discrepancy is particularly evident when pulse oximetry is used in the neonatal intensive care unit (ICU). Although it is generally used to trend oxygen saturations in neonates, pulse oximetry is not used as a basis for prescribing oxygen therapy in neonates; most neonatologists prefer to base oxygen therapy decisions on PaO2 rather than oxygen saturation.25,26
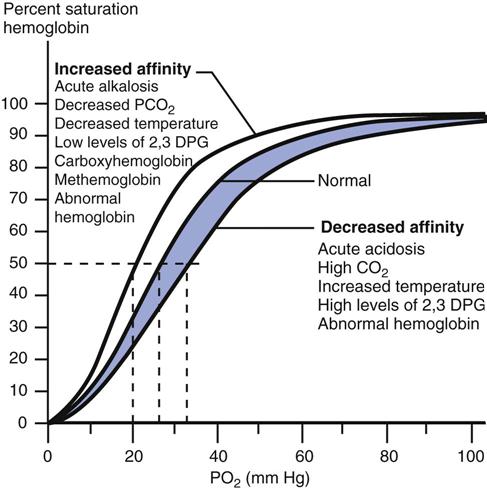
A review of the relationship between SaO2 and PaO2 (i.e., the oxyhemoglobin dissociation curve) is helpful before the use of pulse oximetry to detect hypoxemia is discussed. SaO2 varies with the PaO2 in a sigmoidal or S-shaped manner. (See Fig. 10-4 for the oxyhemoglobin dissociation curve for arterial blood.) For oxygen saturations greater than 90% saturation, PaO2 may rise considerably without much change in SaO2. When saturation is less than 80%, the PO2 values fall rapidly. Although an SaO2 of 97% is considered normal, maintaining an oxyhemoglobin saturation of at least 90% is considered acceptable for adult patients. As a result, many algorithms for oxygen therapy typically use 90% or slightly higher as an indication for increasing the fractional inspired oxygen concentration (FIO2). (As mentioned, because dark skin pigmentation can lead to erroneously high SpO2, many clinicians use a threshold of 94% to 95% for these patients as an indication for adjusting the FIO2.) In the case of hyperoxygenation, pulse oximeters can provide limited information about PaO2 values because of the flat portion of the oxyhemoglobin dissociation curve above 90%.
Several criteria should be met to ensure that pulse oximetry values are meaningful. Box 10-1 contains a summary of the American Association for Respiratory Care (AARC) clinical practice guidelines for pulse oximetry. These guidelines provide valuable information, which practitioners should use to determine whether SpO2 values are valid.
Advances in light-emitting diode (LED) technology have led to simplification of pulse oximeter transmitters and sensors, making them easy to use and available at a relatively low cost. Pulse oximetry probes are available in neonatal, pediatric, and adult sizes. The response time of the pulse oximeter (i.e., the time required for the pulse oximeter to detect a change in central oxygenation level [left-heart PO2]) depends on the location of the probe. The lag time is shortest for probes placed on earlobe; on the finger, the lag time is longer by 12 seconds or more than for the earlobe; and probes placed on the toe have the longest lag time.
As mentioned earlier, pulse oximetry routinely is used to monitor the oxygenation status of critically ill patients continuously with unstable oxygenation status and to monitor oxygen saturation during surgery and bronchoscopy, Pulse oximetry can be particularly useful in the ICU for titrating FIO2 and positive end-expiratory pressure (PEEP) in mechanically ventilated patients and for monitoring the oxygenation status of patients undergoing chest physical therapy and suctioning.22
Although pulse oximetry can be effective when prescribing oxygen therapy in hospitalized patients, it may not be as useful in prescribing oxygen therapy for homecare patients. Carlin and colleagues25 demonstrated that the use of pulse oximetry only can disqualify a significant number of patients applying for reimbursement for oxygen therapy. Under the guidelines of the Centers for Medicare and Medicaid Services (CMS),* a patient must demonstrate a PaO2 of 55 torr or lower or a saturation of 85% or lower to qualify for oxygen therapy.24 Any of the aforementioned physiological or technical problems can significantly affect SpO2 measurements. To resolve this problem, invasive ABG analyses should be done in chronically ill patients to establish the need for oxygen therapy. Case Study 10-1 involves pulse oximetry.
 Case Study 10-1
Causes of Cyanosis
You are preparing a patient for bronchoscopy. As you are administering an aerosol treatment with benzocaine, you note that the patient appears to be cyanotic but does not demonstrate any signs of distress. Pulse oximetry readings indicate that the SpO2 is 85%. You immediately obtain arterial blood gases that demonstrate a pH of 7.36, PCO2 of 42 torr, and PO2 of 80 torr. Explain the cause of the cyanosis. What diagnostic test would confirm this explanation?
See Appendix A for the answer.
Capnography (Capnometry)
Capnography is the measurement of carbon dioxide concentrations in respired gases. Although the terms capnography and capnometry often are thought to be synonymous, capnography describes the continuous display of carbon dioxide concentrations as a graphic waveform called a capnogram; capnometry involves the display of exhaled CO2 numerically without a waveform.27
Technical Considerations
Both chemical and spectroscopic methods can be used to perform capnometry. Chemical devices that rely on a disposable colorimetric detector provide qualitative estimates of exhaled CO2. Spectroscopic devices (e.g., IR, Raman, acoustic, and mass spectroscopy) provide quantitative data on the concentration of expired CO2. Because chemical and IR analyzers are most often used for mechanically ventilated patients in the critical care setting, the following discussion will focus on these devices.
Chemical Methods
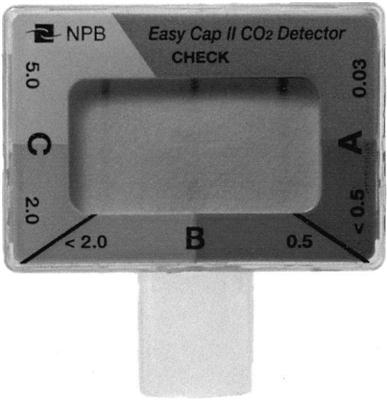
Chemical capnometers are handheld devices composed of specially treated filter paper in a plastic casing that can be attached to the patient’s endotracheal tube (ET) (Fig. 10-5). The amount of CO2 present in the patient’s inspired and exhaled gas can be estimated by noting the color changes in the filter paper. Each device uses a characteristic series of colors to indicate the approximate CO2 concentrations. For example, the Portex CO2 Clip device, which is manufactured by Smiths Medical Canada (St. Paul, Minn.), appears blue when 0 to less than 1% CO2 in the respired gas, green when the exhaled gas contains 1% to 2%, and green-yellow to indicate a CO2 concentration of 2% to 5%; and yellow for CO2 concentrations over 5.0%.
Chemical capnometers are particularly useful in emergency situations in assessing airway placement. It is important to understand that changes in the color of the filter paper are the result of a chemical reaction that affects the pH of the filter paper. (Note that acidic liquids like regurgitated gastric contents contact the filter paper; an irreversible color change will occur and render the device unusable.28) Proper placement of an ET can be determined because the color of the paper will change continually as inhaled and exhaled CO2 levels vary while the patient breathes into and out of the device. In some cases, ET placement in the trachea rather than the stomach may be difficult to determine because the patient’s gastric PCO2 may be elevated after receiving mouth-to-mouth breathing or if the patient has recently ingested a carbonated beverage.
Infrared Spectroscopy
Infrared spectroscopy is based on the principle that molecules containing more than one element absorb infrared light in a characteristic manner.29 CO2 absorbs IR radiation maximally at 4.26 µm. The concentration of CO2 in a gas sample can be estimated because its concentration is directly related to the amount of IR light absorbed.30 The presence of other gases (e.g., water [H2O] and nitrous oxide [N2O]) can adversely affect the accuracy of CO2 measurements by causing a phenomenon called pressure broadening. This phenomenon occurs because the peak absorbance of IR radiation by CO2 lies between the peak absorbencies of H2O and N2O. The presence of these gases increases the absorption of infrared radiation and result in erroneously high CO2 readings. Pressure broadening can be minimized by removing water vapor from the gas sample before it is analyzed and by using electronic filters to subtract the IR absorption by gases other than CO2.21
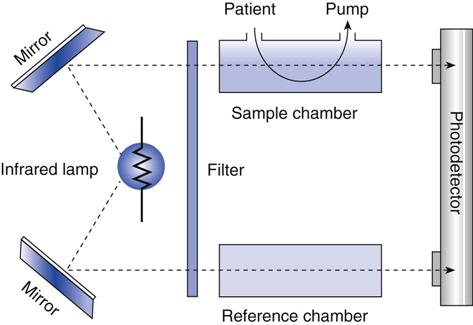
Figure 10-6 is a schematic of a double beam, positive-filter capnograph. The gas is drawn into a cuvette inside the sample chamber. IR radiation is beamed through the cuvette and through a reference chamber containing CO2-free gas. The CO2 in the sample chamber absorbs some of the radiation, reducing the amount of radiation that reaches the detector. The difference between the radiation transmitted through the sample cell and the radiation transmitted through the reference causes movement of a diaphragm in the detector chamber. This movement is converted into an electrical signal, which is amplified and displayed. The displayed value can be displayed in millimeters of mercury (mm Hg) representing the partial pressure, or as percent CO2 (% CO2).
In clinical practice, IR analyzers are typically classified according to the method of sampling of respired gases. Fig. 10-7 illustrates two methods: sidestream sampling and mainstream sampling. In sidestream devices, gas from the airway is extracted through a narrow plastic tube to the sample measuring chamber, which is located in a separate console. In mainstream devices, the sampling chamber attaches directly to the ET and analysis is performed at the airway.
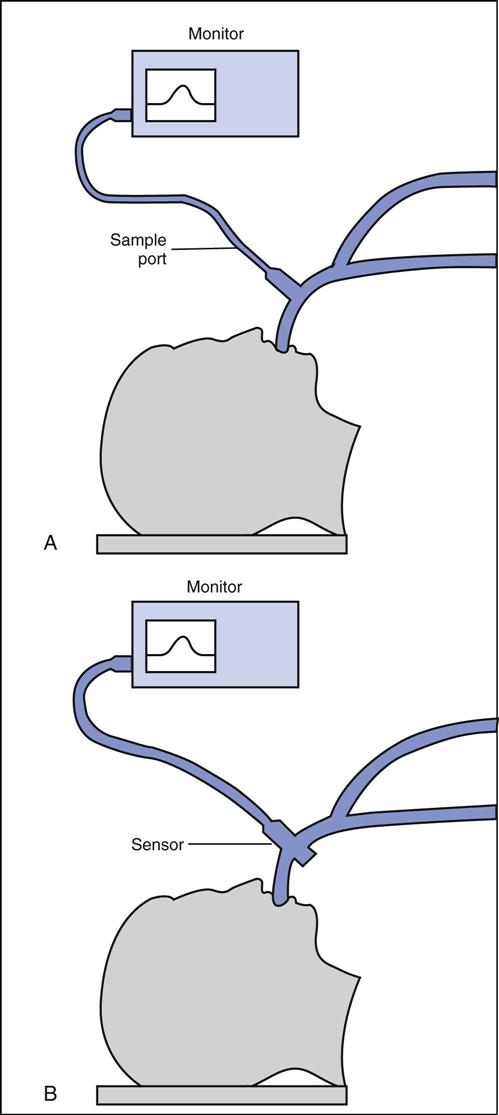
Sidestream devices show a slight delay between sampling and reporting times because of the time required to transport the sample from the airway to the sample chamber. The plastic tube that transports the sample of gas to the analyzer is prone to plugging with water and secretions, which interferes with the delivery of gas to the analyzer. Contamination with ambient air, caused by leaks in the sample line, is also a concern.
In mainstream devices the analyzer is attached directly to the ET; therefore no delay occurs between sampling and reporting times. However, this type of device adds a small amount of dead space to the airway. The analyzer must be properly supported because the added weight it places on the artificial airway increases the possibility of dislodgement or complete extubation. Also, because the analyzer is attached directly to the airway, it is handled often and subject to damage from mishandling (i.e., dropping).
Physiologic Considerations
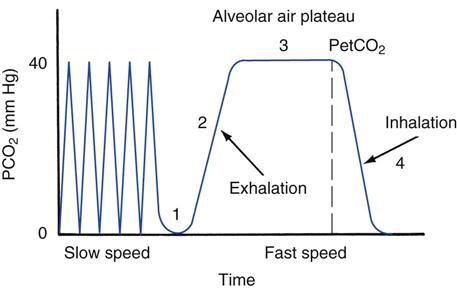
Inspired air contains essentially no carbon dioxide (≈0.3% CO2). Expired air normally contains about 4.5% to 5.5% CO2, which is primarily the product of cellular metabolism. Figure 10-8 illustrates a capnogram for a healthy, resting adult breathing-room air. The waveform, which displays the fractional concentration of expired CO2 (FECO2) versus time, is divided into four phases. In phase 1, the initial gas exhaled is from the conducting airways, which contain low levels of CO2 from inspired air. During phase 2, alveolar gas containing CO2 mixes with gas from the anatomic airways, and the CO2 concentration rises. In phase 3, the curve plateaus as alveolar gas is exhaled (this phase is often referred to as the alveolar plateau). The concentration of CO2 at the end of the alveolar phase (just before inspiration begins) is referred to as the end-tidal PCO2, or PetCO2. In phase 4 (inspiration), the concentration falls to zero.
The PetCO2 is dependent on the alveolar PCO2 (PACO2), which is ultimately influenced by CO2 production ( ) and the effectiveness of ventilation (i.e., matching of ventilation to perfusion). The production of CO2 is primarily determined by the metabolic rate. Fever, sepsis, hyperthyroidism, and seizures increase metabolic rate and
  . Hypothermia, starvation, and sedation reduce metabolic rate and
  .
.
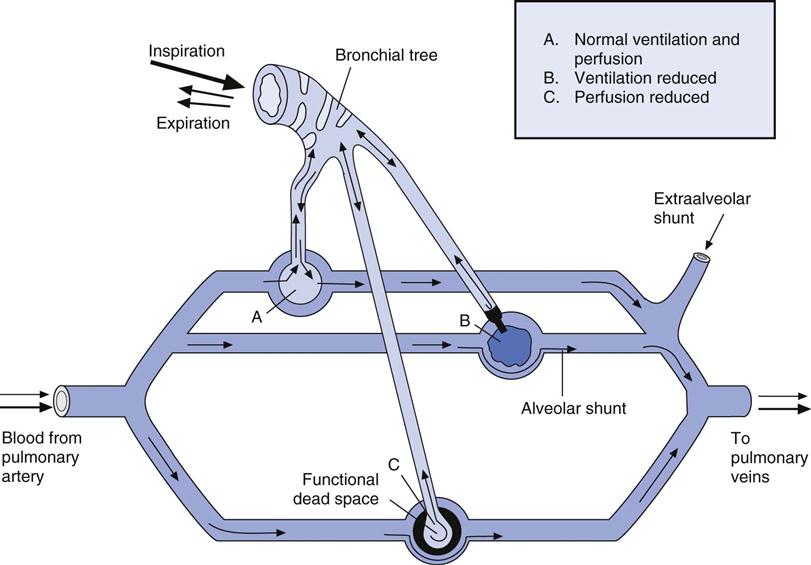
The relationship between ventilation and perfusion of the lung and gas exchange (i.e., PACO2) can be expressed using  relationships.31 Figure 10-9 shows three
  relationships that can potentially affect the level of alveolar PCO2. In A, ventilation and perfusion are equally matched. The partial pressure of arterial CO2 (PaCO2) and PACO2 are nearly equal. The PetCO2 is normally about 4 to 6 mm Hg lower than the PaCO2. In B, ventilation decreases relative to perfusion (low
  ). The PACO2 eventually equilibrates with the mixed venous PCO2 (
 ). Clinical situations in which this type of
  relationship can exist throughout the lung (leading to higher than normal PetCO2 values) include respiratory center depression, muscular paralysis, and chronic obstructive pulmonary disease (COPD). In C, ventilation is higher than perfusion (high
  ). Physiological dead space ventilation increases, and the PACO2 approaches inspired air (0 torr). Decreased PetCO2 values are found with this type of
  ] relationship in patients with pulmonary embolism, excessive PEEP (added or intrinsic), and any disorder marked by pulmonary hypoperfusion.
 . C, High
  .
. Clinical Applications
Capnography has been shown to be a useful measurement in both spontaneously breathing and mechanically ventilated patients. Box 10-2 summarizes the key points of the AARC’s clinical practice guideline for using capnography/capnometry in ventilated patients.27 The following section discusses some of the most common uses of capnography.
Box 10-2
Summary of AARC Clinical Practice Guideline for Capnography/Capnometry During Mechanical Ventilation
Indications
Based on current evidence, capnography is useful for the following:
 relationships. It may also provide valuable information about therapy directed at improving coronary blood flow.
2 Used as an adjunct to determine that tracheal rather than esophageal intubation has taken place
3 Monitoring the integrity of the mechanical ventilatory circuit and artificial airway
4 Monitoring the adequacy of pulmonary and coronary blood flow
5 Screening patients for pulmonary embolism
6 Detection of CO2 rebreathing and the waning effects of neuromuscular blockade
Contraindications
There are no absolute contraindications to capnography in mechanically ventilated adult patients.
Monitoring
During capnography, the following should be recorded:
 imbalances
Limitations
Although capnography can provide valuable information about the efficiency of ventilation, as well as systemic, pulmonary, and coronary perfusion, PaCO2 should be routinely determined by standard arterial blood gas analysis. Leaks in the ventilator circuit or leaks around the tracheal tube can lead to inaccurate measurements of expired CO2. The reliability of the contour of the capnogram can also be affected by the stability of the minute volume, tidal volume, cardiac output, and CO2 body stores. High breathing frequencies may exceed the response capabilities of the capnograph and therefore affect the integrity of the capnogram recorded. Low cardiac output may cause a false-negative result when attempting to verify the endotracheal tube (ET) position in the trachea. Positioning the ET in the pharynx, as well as the presence of antacids and carbonated beverage in the stomach can lead to false positive results when assessing ET placement.
(Source: AARC Clinical Practice Guideline: Capnography/capnometry during mechanical ventilation, 2003 revision and update, Respir Care 48(5):534-539, 2003.)
Capnograph Contours
Changes in the contour of the capnogram can be used to detect increases in dead space ventilation, hyperventilation and hypoventilation, apnea or periodic breathing, inadequate neuromuscular blockade in pharmacologically paralyzed patients, and CO2 rebreathing. They can also be used to monitor the effectiveness of gas exchange during cardiopulmonary resuscitation (CPR) and to detect accidental esophageal intubation.
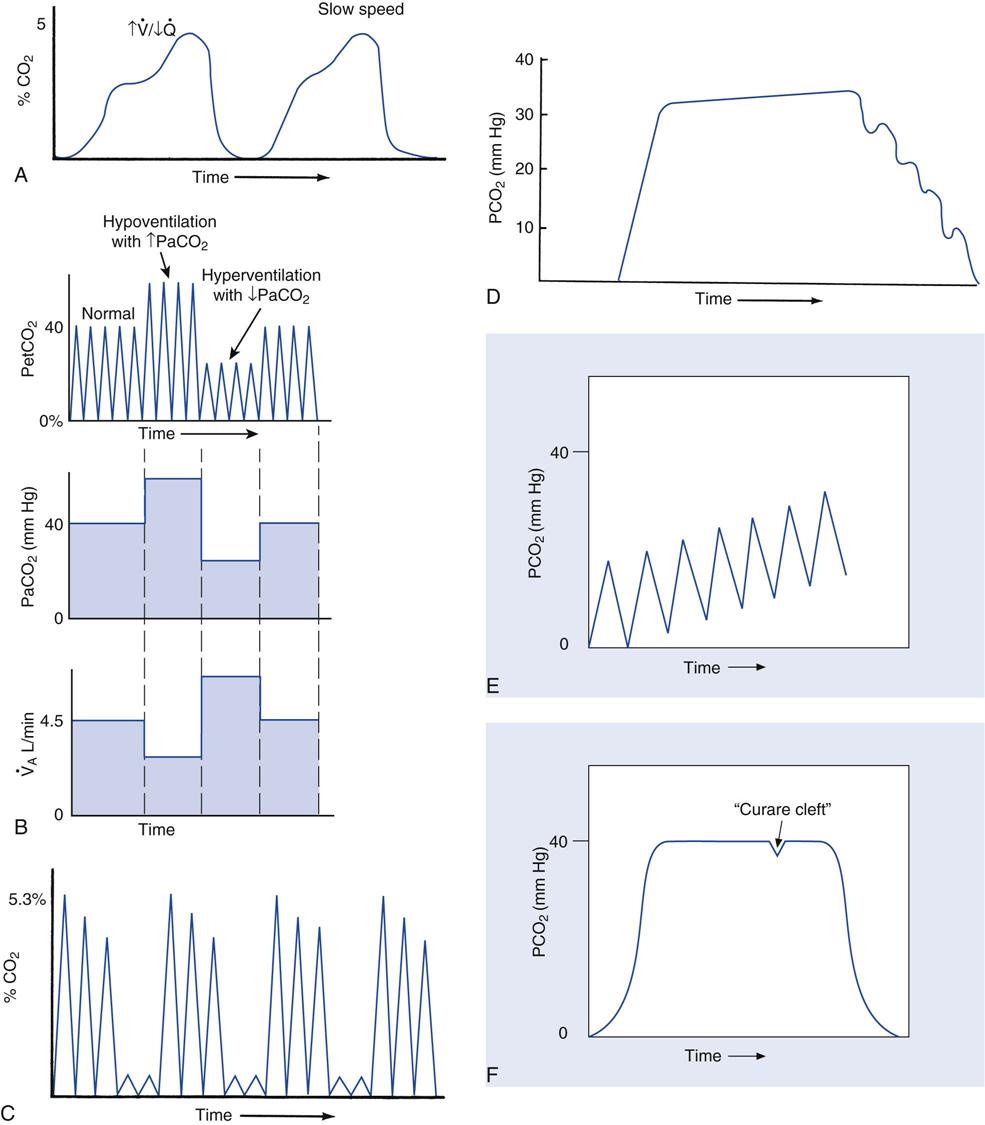
Phase 3 (i.e., alveolar plateau) becomes indistinguishable when physiological dead space increases (as occurs in COPD) (Fig. 10-10, A). Hyperventilation is characterized by a reduction in PaCO2 and, therefore, PetCO2 (Fig. 10-10, B). Conversely, hypoventilation is associated with elevated PaCO2 and PetCO2 (see Fig. 10-10, B). Figure 10-10, C, is a capnogram of a patient with Cheyne-Stokes breathing. During bradypnea, phase 4 will occasionally show cardiac oscillations resulting from the motion of the beating heart transferred to the conducting airways (Fig. 10-10, D). Failure of the capnogram to return to baseline is an indicator of rebreathing of exhaled gas (Fig. 10-10, E). Figure 10-10, F, shows a capnogram for a paralyzed patient, demonstrating the characteristic “curare cleft” during phase 3. This is a positive sign that the paralyzed patient is receiving insufficient neuromuscular blockade; however, other factors can contribute to this capnographic finding, such as patient inspiratory effort during controlled ventilation (e.g., patient-ventilator asynchrony).
Capnography can be used to detect pulmonary blood flow cessation, such as occurs with pulmonary embolism or during cardiac arrest. A number of investigators have advocated the use of capnography as an adjunct to CPR. Laboratory studies suggest that the capnogram can be used as an indication of the progress and success of the event. These studies demonstrated that PetCO2 increases as  is restored to normal.
As mentioned, capnography can also be used to detect accidental esophageal intubation. The gastric PCO2 generally is equal to room air; therefore failure to detect the characteristic changes in CO2 concentration during ventilation possibly indicates esophageal intubation. However, low perfusion of the lungs is associated with low PetCO2 and should not be confused with esophageal intubation. Also, the gastric PCO2 may be elevated after mouth-to-mouth breathing or if the patient recently ingested a carbonated beverage. Case Study 10-2 gives an example situation of the use of capnographic data (Key Point 10-2).
 Case Study 10-2
Capnography during Intubation
After considerable difficulty, an endotracheal tube is inserted without visualization of the trachea into a patient’s airway during CPR. Capnography results show a PetCO2 of 3 torr; a standard arterial blood gas measurement demonstrates a PaCO2 of 75 torr. Explain the cause of this discrepancy in the capnography and arterial blood gas results.
See Appendix A for the answers.
 Key Point 10-2
Capnography can be a valuable adjunct to verify tracheal rather than esophageal intubation during CPR.
Arterial to Maximum End-Expiratory PCO2 Difference
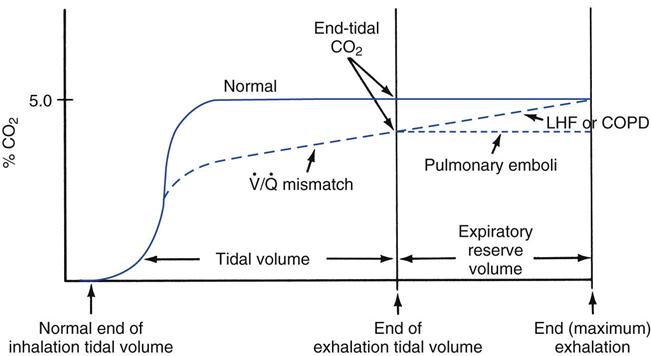
The P(a-et)CO2 for tidal breathing should be approximately 4 to 6 mm Hg. It is elevated in patients with COPD, left-sided heart failure, and pulmonary embolism caused by an increase in physiological dead space.31 Another technique that can be used to further evaluate the severity of the disease is to compare arterial PCO2 measurements with maximum expired PCO2 measurements (the arterial to maximum expiratory PCO2 gradient). With this technique, the expired PCO2 recorded at the end of a maximum exhalation is compared with the PaCO2. The difference normally is minimal. Patients with COPD and left-sided heart failure do not show an arterial to maximum expired PCO2 difference, whereas patients with pulmonary embolism do show an increased gradient. Fig. 10-11 shows the capnographic appearance of these differences.
Stay updated, free articles. Join our Telegram channel

Full access? Get Clinical Tree


