Chapter 7 Ventricular Conduction Disturbances Bundle Branch Blocks and Related Abnormalities
Please go to expertconsult.com for supplemental chapter material.
Recall that in the normal process of ventricular activation the electrical stimulus reaches the ventricles from the atria by way of the atrioventricular (AV) node and His-Purkinje system (see Chapters 1 and 4). The first part of the ventricles to be stimulated (depolarized) is the left side of the ventricular septum. Soon after, the depolarization spreads to the main mass of the left and right ventricles by way of the left and right bundle branches. Normally the entire process of ventricular depolarization in adults is completed within about 0.1 sec (100 msec). This is the reason the normal width of the QRS complex (measured by computer) from all 12 leads is less than or equal to 110 msec (about 2.5 small boxes on the ECG graph paper by eye). Any process that interferes with the physiologic, near simultaneous stimulation of the ventricles may prolong the QRS width or change the QRS axis. This chapter primarily focuses on a major topic: the effects that blocks or delays within the bundle branch system have on the QRS complex and ST-T waves.
ECG in Ventricular Conduction Disturbances: General Principles
A unifying principle in predicting what the ECG will show with a bundle branch or fascicular block is the following: The last (and usually dominant) component of the QRS vector will be shifted in the direction of the last part of the ventricles to be depolarized. In other words, the major QRS vector shifts toward the regions of the heart that are most delayed in being stimulated (Box 7-1).
BOX 7-1 QRS Vector Shifts in Bundle Branch and Fascicular Blocks
• Right bundle branch block (RBBB): late QRS forces point toward the right ventricle (positive in V1 and negative in V6).
• Left bundle branch block (LBBB): late QRS forces point toward the left ventricle (negative in V1 and positive in V6).
• Left anterior fascicular block (LAFB): late QRS forces point in a leftward and superior direction (negative in II and positive in I and aVL).
• Left posterior fascicular block (LPFB): late QRS forces point in an inferior and rightward direction (negative in I and positive in II and III).
Right Bundle Branch Block
Normally the first part of the ventricles to be depolarized is the interventricular septum (see Fig. 4-6A). The left side of the septum is stimulated first (by a branch of the left bundle). On the normal ECG, this septal depolarization produces a small septal r wave in lead V1 and a small septal q wave in lead V6 (Fig. 7-1A). Clearly, RBBB should not affect the septal phase of ventricular stimulation because the septum is stimulated by a part of the left bundle.
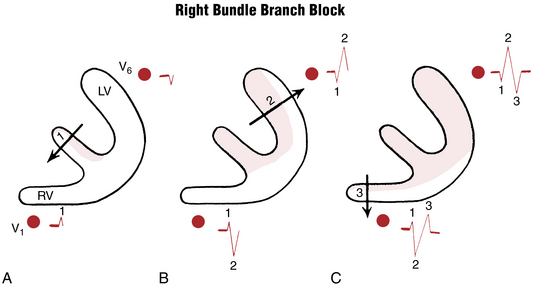
Figure 7-1 Step-by-step sequence of ventricular depolarization in right bundle branch block (see text).
The second phase of ventricular stimulation is the simultaneous depolarization of the left and right ventricles (see Fig. 4-6B). RBBB should not affect this phase either, because the left ventricle is normally electrically predominant, producing deep S waves in the right chest leads and tall R waves in the left chest leads (Fig. 7-1B). The change in the QRS complex produced by RBBB is a result of the delay in the total time needed for stimulation of the right ventricle. This means that after the left ventricle has completely depolarized, the right ventricle continues to depolarize.
This delayed right ventricular depolarization produces a third phase of ventricular stimulation. The electrical voltages in the third phase are directed to the right, reflecting the delayed depolarization and slow spread of the depolarization wave outward through the right ventricle. Therefore, a lead placed over the right side of the chest (e.g., lead V1) records this phase of ventricular stimulation as a positive wide deflection (R′ wave). The rightward spread of the delayed and slow right ventricular depolarization voltages produces a wide negative (S wave) deflection in the left chest leads (e.g., lead V6) (Fig. 7-1C).
To make the initial diagnosis of RBBB, look at leads V1 and V6 in particular. The characteristic appearance of QRS complexes in these leads makes the diagnosis simple. (Fig. 7-1 shows how the delay in ventricular depolarization with RBBB produces the characteristic ECG patterns.)
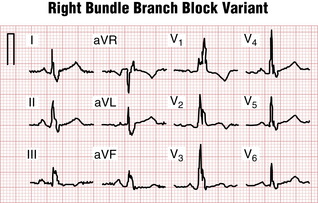
With an RBBB pattern the QRS complex in lead V1 generally shows an rSR′ pattern (Fig. 7-2). Occasionally, however, the S wave never quite makes its way below the baseline. Consequently, the complex in lead V1 has the appearance of a large notched R wave (Fig. 7-3).
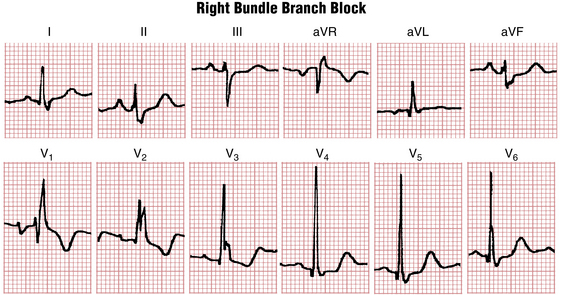
Figures 7-2 and 7-3 are typical examples of RBBB. Do you notice anything abnormal about the ST-T complexes in these tracings? If you look carefully, you can see that the T waves in the right chest leads are inverted. T wave inversions in the right chest leads are a characteristic finding with RBBB. These inversions are referred to as secondary changes because they reflect just the delay in ventricular stimulation. By contrast, primary T wave abnormalities reflect an actual change in repolarization, independent of any QRS change. Examples of primary T wave abnormalities include T wave inversions resulting from ischemia (see Chapters 8 and 9), hypokalemia and certain other electrolyte abnormalities (see Chapter 10), and drugs such as digitalis (see Chapter 10).
Some ECGs show both primary and secondary ST-T changes. In Figure 7-3 the T wave inversions in leads V1 to V3 and leads II, III, and aVF can be explained solely on the basis of the RBBB because the inversions occur in leads with an rSR′-type complex. However, the T wave inversions or ST segment depressions in other leads (V4 and V5) represent a primary change, perhaps resulting from ischemia or a drug effect.
Clinical Significance
RBBB may be caused by a number of factors. First, some people have this finding without any identifiable underlying heart disorder. Therefore RBBB, itself, is an isolated ECG abnormality in many people; however, RBBB may be associated with organic heart disease. It may occur with virtually any condition that affects the right side of the heart, including atrial septal defect with left-to-right shunting of blood, chronic pulmonary disease with pulmonary artery hypertension, and valvular lesions such as pulmonary stenosis, as well as cardiomyopathies and coronary disease. In some people (particularly older individuals), RBBB is related to chronic degenerative changes in the conduction system. It may occur after cardiac surgery.
By itself, RBBB does not require any specific treatment. RBBB may be permanent or transient. Sometimes it appears only when the heart rate exceeds a certain critical value (rate-related RBBB), a nondiagnostic finding. However, as noted later in patients with acute anterior wall infarction, a new RBBB may indicate an increased risk of complete heart block, particularly when the RBBB is associated with left anterior or posterior fascicular block and a prolonged PR interval. A new RBBB with acute ST segment elevation anterior myocardial infarction (MI) is also a marker of more extensive myocardial damage, often associated with heart failure or even cardiogenic shock (see Chapter 8, Fig. 8-20).
A pattern resembling RBBB (“pseudo-RBBB”) is characteristic of the Brugada pattern, important because it may be associated with increased risk of ventricular tachyarrhythmias (see Chapter 19; Fig. 19-9).
Stay updated, free articles. Join our Telegram channel

Full access? Get Clinical Tree


