Ventilator Graphics
Learning Objectives
On completion of this chapter, the reader will be able to do the following:
Key Terms
• Asynchrony
• Hysteresis
• Scalar
Most modern ventilators (e.g., Dräger v500 [Dräger Medical Inc., Telford, Pa.], CareFusion AVEA [CareFusion, Viasys Corp, San Diego, Calif.], Maquet Servoi [Maquet Inc. Wayne, N.J.], Puritan Bennett 840 [Covidien-Nellcor and Puritan Bennett, Boulder, Colo.], and Hamilton G5 [Hamilton Medical, Bonzduz, Switzerland]) incorporate computer monitors into their interfaces to provide real-time displays of pressure, volume, and flow waveforms. These graphic displays allow real-time measurements of the patient-ventilator interaction and add valuable insight into the mechanics of breathing during mechanical ventilation. As such, ventilator graphics can be used to monitor ventilator function, evaluate the patient’s response to the ventilator, and help the clinician adjust ventilator settings.3,4
Acquiring an appreciation for how ventilator graphics can be used in clinical practice requires time and practice. Once this skill is mastered, however, it can greatly enhance a clinician’s ability to assess ventilator-dependent patients and improve patient care.2 Indeed, ventilator graphics can alert the clinician to abnormalities even before clinical signs become obvious and provide a graphic record of the pathophysiological changes that can lead to patient-ventilator asynchrony and respiratory distress.1
It is important to understand how the ventilator measures, computes, and displays various parameters. For example, the Puritan Bennett 840 and Servoi ventilators measure flow and pressure during each breath using sensors located on the inspiratory side of the ventilator just before the point where gas exits the ventilator to the patient and on the expiratory side of the ventilator just as gas enters the ventilator through the exhalation valve. The Hamilton G5 and the CareFusion (Pulmonetics) LTV series monitor flow and pressure signals at the patient’s airway through proximal monitoring devices.8
Proprietary software programs written by the ventilator manufacturers perform the calculations on measured variables and graph the waveforms on real-time displays. (See the following section for more details.)
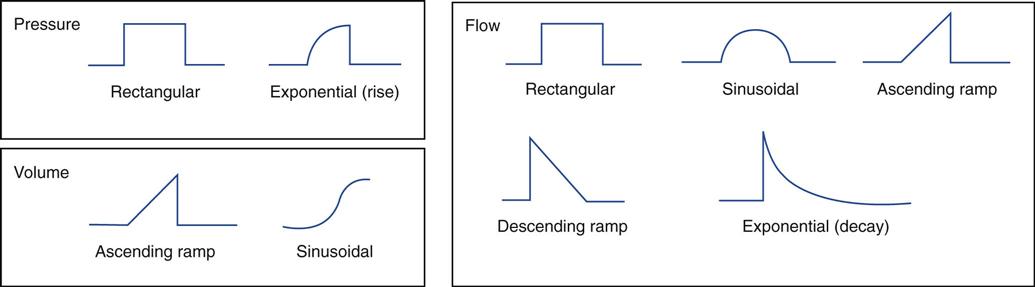
The term scalar is used to specify the waveforms for pressure, flow, and volume that are graphed relative to time (e.g., pressure, flow, and volume scalars).5 Basically, six shapes (waveforms) are produced with scalars during mechanical ventilation (Fig. 9-1 and Box 9-1).5–7 The term loop is used to describe a graph of two variables plotted on the x and y coordinates, such as pressure-volume and flow-volume loops (these are discussed later in the chapter).
Relationship of Volume, Flow, Pressure, and Time
Volume, flow, pressure, and time must be determined to produce the various waveforms and loops. The following principles explain the basic interrelationship of volume, pressure, flow, and time as they are used to create a waveform display:
1 The volume (V) delivered depends on the amount of flow and the inspiratory time (TI) (V = Flow × TI)
3 The amount of pressure (ΔP) required to inflate the lungs depends on the patient’s lung compliance and airway resistance. If the lungs are very compliant and easy to inflate, not much pressure is required. If the lungs are very stiff (low compliance), more pressure is required to inflate them (ΔP = ΔV/CL). For airway resistance, the most important factor affecting the degree of resistance is the diameter of the airways (or more specifically the radius according to Poiseuille’s law). The larger the diameter of the airway, the lower the resistance and the greater the flow. Conversely, the smaller the diameter of the airway, the higher the resistance and the lower the flow (Key Point 9-1). Note that the ventilator’s microprocessor can calculate both compliance and resistance using the measured data.
 Key Point 9-1
The pressure at the mouth at any point in time is the sum of the transairway pressure (Pta) and the alveolar pressure (Palv).
Volume-Controlled Ventilation with Constant Flow
To illustrate the basic concepts in ventilator waveform graphic analysis, this section reviews how the points on a graph for the different variables (volume, flow, pressure, and time) are calculated or selected and how they are plotted. Volume-targeted ventilation with a constant flow will be used to demonstrate graphing of points. This provides an easy-to-understand example for presenting the basic concepts of ventilator waveform generation.
A ventilator must generate enough force to provide a constant flow of gas into the lungs regardless of the stiffness of the lungs or the airway resistance to gas flow. For example, a ventilator connected to a cylinder of compressed gas with a 50 lb per square inch gauge (psig) regulator would have a high-pressure power source. The 50-psig pressure is equal to about 3500 cm H2O above atmospheric (1 psig ≈ 70 cm H2O).
Alveolar pressure is very low, nearly zero (ambient). Consequently, connecting a 50-psig gas source to a lung would be dangerous; however, a clamp (in technical terms a high internal resistor) placed in-line between the gas source and the lungs could regulate the amount of flow (Fig. 9-2, top left). Because this type of ventilator possesses a high-pressure power source, any desired gas flow or volume could be achieved regardless of the stiffness of the lungs. Additionally, the high-pressure source would prevent back-pressure on the system from slowing the flow of gas from the cylinder. In other words, even if the ventilator had to work against considerable resistance, the force provided would be so strong that the resistance would not affect the ability to deliver flow. Note that many of the newer microprocessor-controlled ventilators have very high gas pressure sources, in the range of 400 to 700 cm H2O. This is enough pressure to produce a constant flow of gas during inspiration in any clinical situation.
Producing Ventilator Graphics
The following case study uses the type of ventilator just described.
 Clinical Scenario: Producing Ventilator Graphics
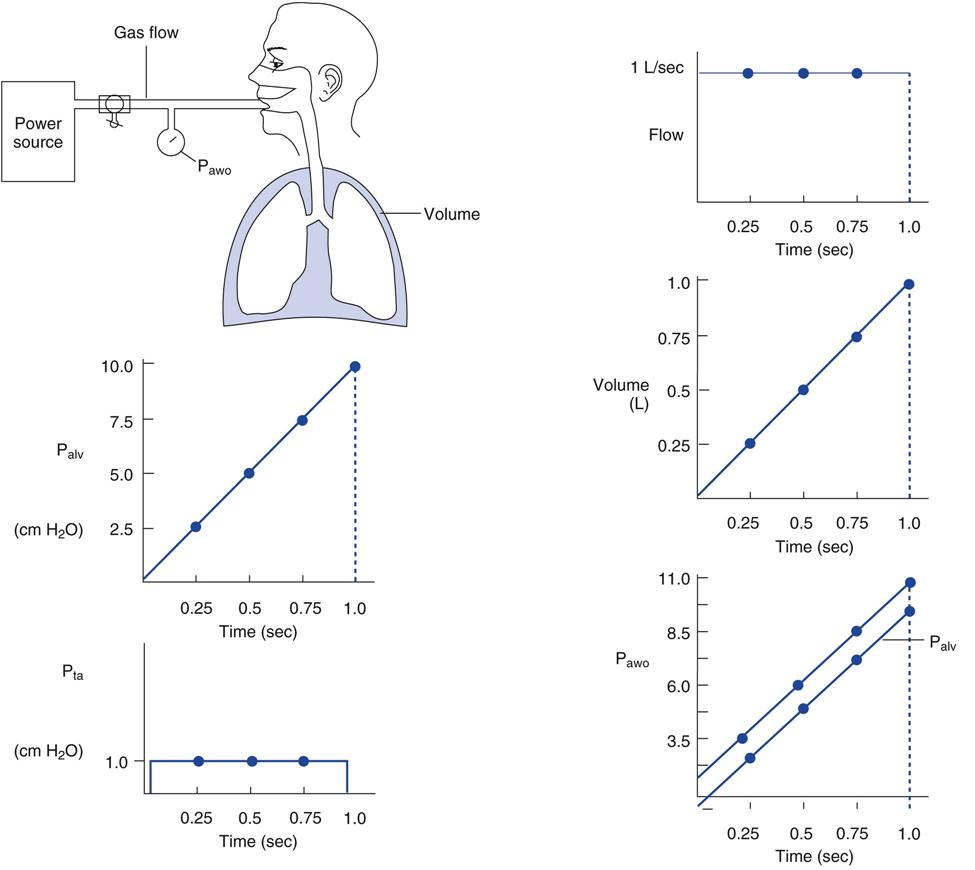
A patient has a lung compliance (CL) of 100 mL/cm H2O (0.1 L/cm H2O) and an airway resistance (Raw) of 1 cm H2O/L/s. The respiratory therapist sets the ventilator to deliver an average gas flow of 60 L/min (1 L/s, constant) and an inspiratory time (TI ) of 1 second.* What type of graphic waveforms would this generate? The specific waveforms of interest are (1) flow versus time, (2) alveolar pressure (Palv) versus time, (3) tidal volume (VT) delivery versus time, (4) transairway pressure (Pta) versus time, and (5) pressure at the airway opening (Pawo) versus time (Pawo = Palv + Pta). For each time interval on the horizontal axis (i.e., 0.25, 0.5, 0.75, and 1 second), the value for each of the variables on the vertical axis (i.e., flow, volume, and pressure) must be calculated because they will change over time (see Fig. 9-2; Box 9-2). Note that ventilators graph flow-time, airway pressure–time, and volume-time curves but not Pta or Palv; those variables are provided here to construct a mathematical model of the way various curves are produced.
| Time(s) | TI × Flow | Volume (L) |
| 0.25 | 0.25 × 1 L/s | 0.25 |
| 0.5 | 0.5 × 1 L/s | 0.5 |
| 0.75 | 0.75 × 1 L/s | 0.75 |
| 1 | 1 × 1 L/s | 1 |
Alveolar pressure (Palv) = change in volume (ΔV)/Static compliance (CS):
| Time(s) | ΔV/CS (0.1 L/cm H2O) | Palv (cm H2O) |
| 0.25 | 0.25 | 2.5 |
| 0.5 | 0.5 | 5.0 |
| 0.75 | 0.75 | 7.5 |
| 1 | 1.0 | 10.0 |
Transairway pressure (Pta) = Flow × Airway resistance (Raw):
| Time(s) | Flow × Raw | Pta (cm H2O) |
| 0.25 | 1 L/s × 1 cm H2O/(L/s) | 1 |
| 0.5 | 1 L/s × 1 cm H2O/(L/s) | 1 |
| 0.75 | 1 L/s × 1 cm H2O/(L/s) | 1 |
| 1 | 1 L/s × 1 cm H2O/(L/s) | 1 |
Pressure at the airway opening (Pawo) = Alveolar pressure (Palv) + Pressure caused by airway resistance (Pta):
| Time(s) | Palv + Pta | Pawo (cm H2O) |
| 0.25 | 2.5 cm H2O + 1 cm H2O | 3.5 |
| 0.5 | 5 cm H2O + 1 cm H2O | 6 |
| 0.75 | 7.5 cm H2O +1 cm H2O | 8.5 |
| 1.0 | 10 cm H2O + + 1 cm H2O | 11* |
*Peak inspiratory pressure (PIP), the highest pressure achieved during inspiration.
For this example, a constant-flow ventilator is used to show how the graphic waveforms are produced by the ventilator’s software. Many ventilators perform these calculations automatically, and the example given here is a considerably simplified version of that function.
The scalars most often displayed on the ventilator screen are Pawo, V, and flow. The following steps are used in this example to do the calculations and draw the waveforms:
Calculations
The values calculated in Box 9-2 are graphed in Fig. 9-2. The following six rules apply:
1 With a constant flow, the flow-time curve is a straight line parallel to the x axis.
2 With a constant flow, the rise in volume is delivered at a constant rate (linear rise).
3 The Palv curve resembles the V delivery curve, regardless of the type of volume waveform present.
4 The Pta curve always resembles the flow curve, regardless of the type of flow waveform present.
6 TI is the amount of time required for the volume to be delivered at the specified flow (TI = V/Flow). The waveforms for Pawo, V, and flow in Fig. 9-2 are the patterns seen whenever a ventilator uses a constant, or rectangular, flow. Regardless of the type of ventilator, as long as the power driving the breath has enough force (pressure) behind it, the curves for pressure, flow, and volume will be the same as those pictured.
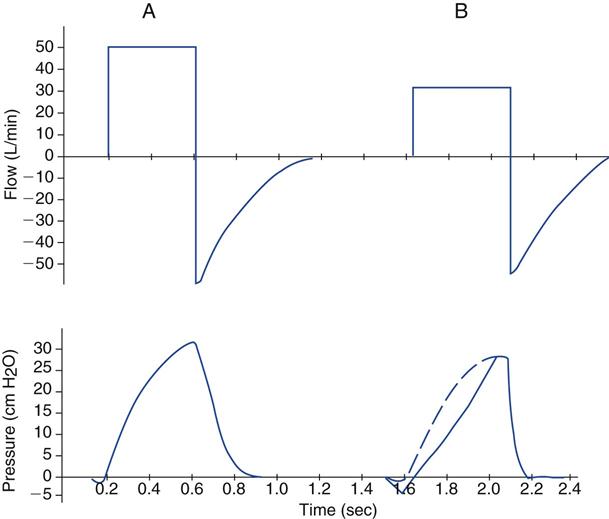
Figure 9-2 shows only the inspiratory part of the breath. The expiratory part is simple and is pictured in Fig. 9-3, A, along with the inspiratory curves. Although some slight changes are present with different clinical situations, the basic patterns are the same as those shown. For example, the pressure curve for a constant-flow pattern is slightly tapered and is not always a straight line. Fig. 9-3, B, shows a descending (decelerating) flow waveform and the resulting pressure and volume scalars.9
Appendix C offers an opportunity to calculate and graph data. It provides an exercise in graphing for additional practice in this aspect of ventilator graphics.
A Closer Look at the Flow-Time Scalar in Volume-Controlled Continuous Mandatory Ventilation
Figure 9-4 illustrates several important points about the flow-time scalar. At point A, the inspiratory valve opens and inspiratory gas flow begins. This is also the point where expiration ends. Flow rises quickly to point B, which is the peak inspiratory flow set on the control panel of the ventilator. What is the inspiratory flow setting in this example? At point C, inspiratory flow delivery stops. Has an inspiratory pause been set on the ventilator? What is the length of TI? What is the flow during the pause period?*
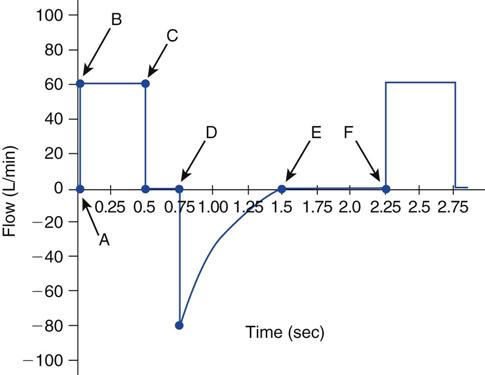
In this example, as the expiratory valve opens at point D, gas leaves the patient and the ventilator circuit and passes through the ventilator’s expiratory valve. Flow during exhalation is graphed below the baseline, as specified by the software program. Look at the expiratory flow curve. What is the peak expiratory flow rate (PEFR)?*
Continue to follow the expiratory flow curve. Note that at point E, expiratory flow ends; however, the total expiratory time (TE) lasts from point D to point F, and the TE continues until the next inspiration begins (point F). How long is TE? How much of TE is represented by a period of no gas flow?†
Several different patterns can occur in the flow-time waveform during volume ventilation with a constant flow.
Variation One
Figure 9-5 shows another set of scalars for flow, pressure, and volume. Look first at the inspiratory portion of the pressure-time curve. Note that the baseline pressure is 5 cm H2O, indicating that there is positive end-expiratory pressure (PEEP) set at 5 cm H2O. It is important to remember that even though the baseline pressure is positive, the flow and volume curves start from a zero baseline and end at a zero baseline.
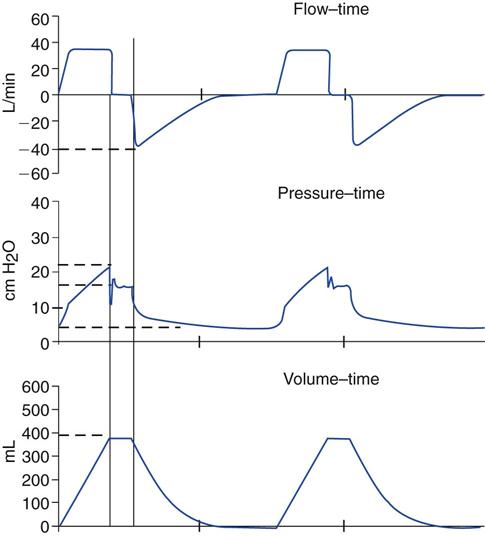
What is the peak inspiratory pressure (PIP)? Has an inspiratory pause been set? What is the plateau pressure (Pplateau)? What is volume delivery? Are these breaths patient triggered or time triggered?*
Note what happens to the flow curve during the inspiratory pause (see Fig. 9-5). Compare the flow and volume curves at the same moment in time. Note that when no flow occurs, there is no volume delivery. The volume curve also looks as if it has a pause, or plateau. (See Case Study 9-1 for several calculation exercises based on Fig. 9-5.)
 Case Study Exercise 9-1
Calculation of Pta, CS, and Raw
A patient is volume ventilated at the following settings: PIP = 24 cm H2O, Pplateau = 17 cm H2O, and VT = 400 mL (0.4 L), PEEP = 5 cm H2O. What is the Pta? What is the patient’s static compliance? Flow is about 35 L/min. What is the Raw? Is this Raw normal?
See Appendix A for the answers.
Look at the expiratory flow curve in Fig. 9-6. Is there any difference between the flow scalars in Fig. 9-3, A, and Figure 9-6? Fig. 9-3, A, shows a constant flow, whereas the flow waveform in Fig. 9-6 looks like a modified sine wave. Is there an inspiratory pause in Figure 9-6?*
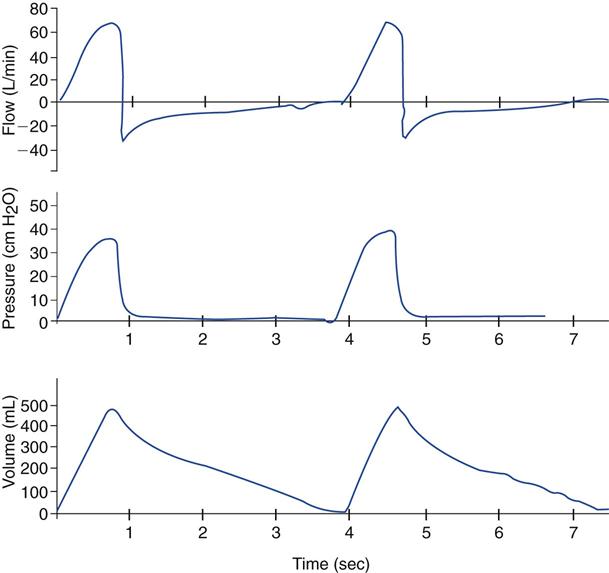
Look at the peak expiratory flow in Fig. 9-6. It is approximately 30 L/min (absolute value). Note that the expiratory flow is very slow and rises to the zero baseline just before the next breath starts. Also look at the expiratory volume curve. Apparently the gas takes a long time to leave the patient’s lungs. In fact, this patient has increased airway resistance. Because of the resistance limitation on expiratory gas flow, flow and volume take longer to leave the lungs. This kind of expiratory pattern typically occurs in patients with chronic obstructive pulmonary disease (COPD) and severe asthma.1
Variation Two
Figure 9-7, A, shows pressure-time and flow-time scalars during pressure ventilation. (Pressure ventilation will be reviewed later in this chapter.) Look at the expiratory portion of the flow curve. How does this compare with the one shown in Fig. 9-4? Note that flow does not return to zero at the end of exhalation in Fig. 9-7. Expiratory flow is still leaving the patient when the next breath begins. This pattern indicates air trapping, or the presence of auto-PEEP.
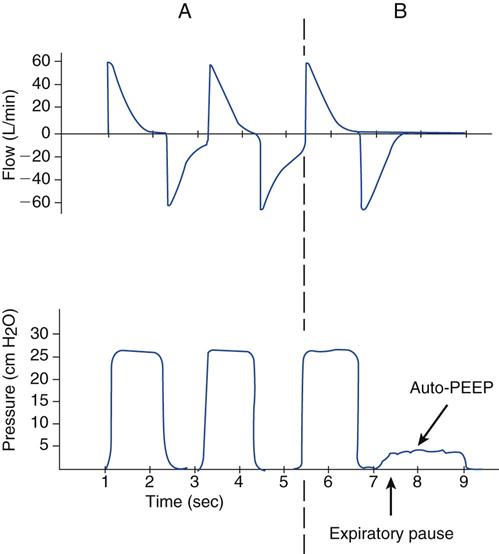
Older-model ventilators without a graphics screen cannot provide the information that indicates the presence of auto-PEEP. With these machines, the easiest way to determine whether the patient has air trapping is to place a respirometer in line between the ET and the Y-connector (see Fig. 9-2). (If the respirometer’s needle is still rotating when the next breath occurs, air trapping is present.) Many current intensive care unit (ICU) ventilators have expiratory pause buttons that allow direct measurement of auto-PEEP. When this control is activated, the ventilator waits until the end of the current breath and then closes the inspiratory and expiratory valves. Delivery of the next mandatory breath is delayed as long as the expiratory pause is activated. The pressure in the patient’s lungs and the pressure in the ventilator circuit equilibrate, and the auto-PEEP value is displayed. The pressure-time curve resembles the waveform in Fig. 9-7, B. Inspiration is delivered, exhalation occurs, and the expiratory hold (expiratory pause control) is activated (the expiratory pause is labeled with an arrow in Fig. 9-7, B). The pressure then rises slightly to the auto-PEEP level. Auto-PEEP usually can be estimated using a 1- to 2-second expiratory pause. Patients with expiratory flow limitations (e.g., individuals with asthma) may require a longer pause (i.e., 2-4 seconds) for pressures to equilibrate throughout the lungs. However, sustaining a long expiratory pause without interruption of the maneuver by the patient’s active effort to breathe may be difficult.*
This measurement is not valid if the patient actively inhales. If this occurs, the ventilator generally does not display the measured auto-PEEP because the value would be inaccurate. Unless a stable pause is achieved, auto-PEEP cannot be measured.
When reporting the level of auto-PEEP, some ventilators display the total PEEP (PEEPTOT), which is the sum of the auto-PEEP and the set PEEP (PEEPE). Others subtract the PEEPE from the PEEPTOT and display auto-PEEP (Box 9-3). Ventilator manufacturers may also refer to this value as the level of intrinsic PEEP (auto-PEEP).
Variation Three
The waveforms in Fig. 9-8 represent flow, volume, and pressure scalars in the Servoi ventilator. The Servoi normally provides constant flow during inspiration (solid line). Note that flow suddenly increases during inspiration (dashed line and shaded area). What could cause this change?†
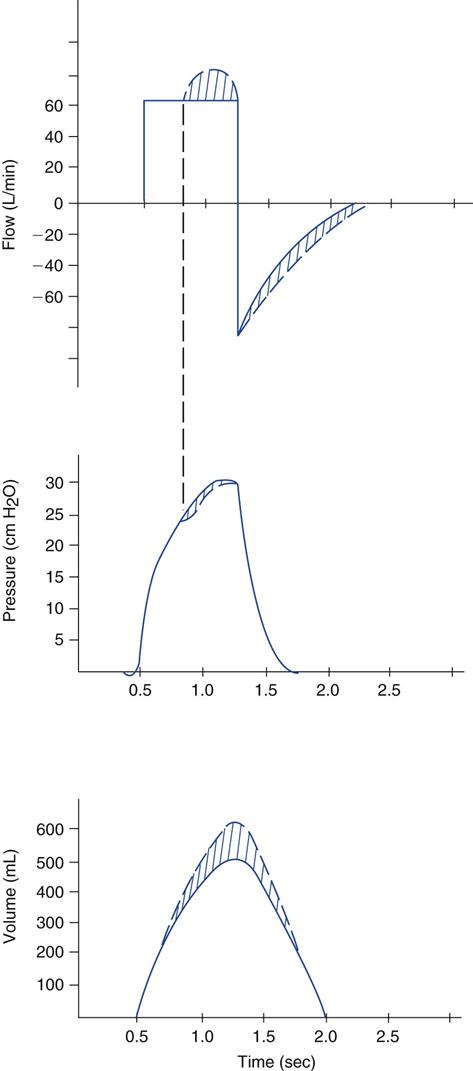
Note the slight dip in the pressure curve that occurs simultaneously with an increase in flow. The dashed lines represent actual flow, pressure, and volume delivery. The solid line represents the process without active patient inspiration.
Several current ICU ventilators allow patients who can actively inspire during volume ventilation to receive additional flow. With the Servoi, when the pressure drops 2 cm H2O below Pawo, flow to the patient increases. This feature allows a patient who wants additional flow to receive it. It also increases volume delivery above the set value. The increased flow and VT do not increase the pressure delivery. Pawo decreases slightly with active patient inspiration. Pleural pressures and alveolar pressures also decrease as a result of respiratory muscle activity. This type of variability in flow delivery is based on patient demand and thus would seem to be more comfortable and accommodating for the patient, although no current clinical studies have addressed this point.
Changes in the Pressure-Time Curve
The curves in Fig. 9-9, A, represent the normal pressure and flow scalars obtained during volume-controlled ventilation. Note the slight pressure deflection that occurs just before the start of the breath in Fig. 9-9, A, represents the patient’s effort to begin inspiration; this is therefore a patient-triggered breath. Compare parts A and B of Fig. 9-9. What ventilator parameters have not been set correctly? First, the ventilator is not sensitive enough to the patient effort in part B; note how many centimeters of water pressure are required to trigger the breath. A normal trigger range would be a pressure drop of about 1 to 2 cm H2O below baseline in adult patients.
Second, look at the way the pressure curve increases to PIP in part A compared with part B. Also compare the two set flows in parts A and B. These are examples of breath delivery by a ventilator that holds flow constant at the set value regardless of the amount of flow the patient tries to receive. (The Puritan Bennett 840 during volume-controlled continuous mandatory ventilation (VC-CMV) is one example of this type of ventilator.) The flow the operator sets during volume-controlled ventilation is the maximum flow the patient can receive. What ventilator setting changes could the respiratory therapist make to accommodate the patient?*
An inappropriate sensitivity setting and an inadequate flow setting are two causes of asynchrony between the patient and the ventilator.10
Volume Scalar
Volume-time scalars in this section show normal inspired and expired volumes (see Fig. 9-3), as well as those with an inspiratory pause (see Fig. 9-5). Fig. 9-10, A, illustrates a concept that was introduced in Chapter 8. What is the problem in Fig. 9-10, A?*
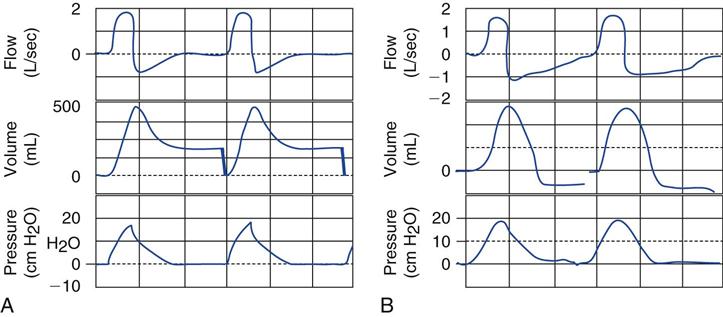
Fig. 9-10, B, shows another unusual volume-time curve. Here the volume drops below the baseline during exhalation. What might cause this situation? One answer is active exhalation by the patient. Observing the patient’s chest and abdomen during exhalation might determine whether the patient is actively exhaling or the inspiratory time is set too long for the patient. Active exhalation sometimes is seen when air trapping has occurred. Another possibility is that the flow transducer for the ventilator is not calibrated properly and needs to be recalibrated. This type of calibration problem was observed with an older-generation ventilator (i.e., Bear 1000, Viasys Corp., San Diego, Calif.) when the flow transducer (original version) was calibrated for one type of humidifier (heat and moisture exchanger [HME]), but another type was used (a heated humidifier). Current microprocessor-controlled ventilators perform frequent self-calibrations; therefore this type of technical error occurs much less frequently.
Volume-Controlled Ventilation with Varying Gas Flow Waveforms
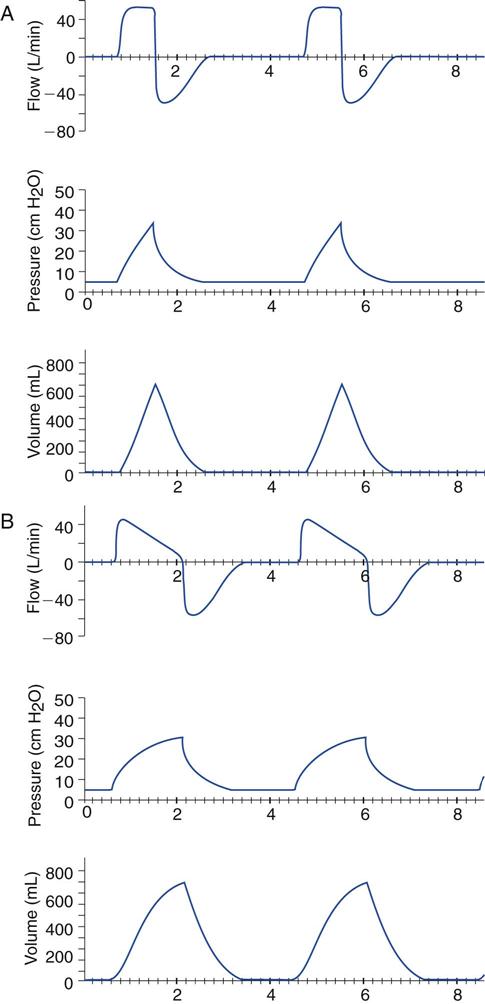
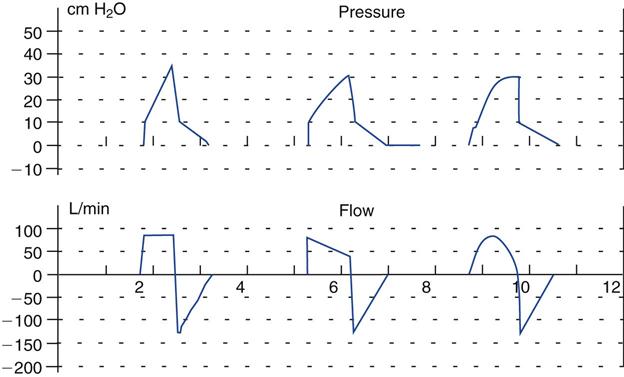
In Chapter 6 we reviewed the various flow patterns available during volume-controlled ventilation and mentioned the benefits of the descending ramp. Figure 9-11 shows a constant, descending flow and a sine flow waveform with accompanying pressure scalars. Although other waveforms are available, they are not commonly used.5
Stay updated, free articles. Join our Telegram channel

Full access? Get Clinical Tree


