Venous System
Ivan Pedrosa
Eric Zeikus
Douglas E. Green
Marc V. Gosselin
Introduction
Methods available for imaging the venous system are plentiful, including conventional, direct venography, grayscale and Doppler ultrasound (US), contrast-enhanced (CE) computed tomography (CT), and both noncontrast and CE magnetic resonance imaging (MRI). With the current imaging technologies, the venous system anatomy and pathology can be readily and reliably demonstrated.
Relatively noninvasive assessments of the venous system can be achieved over large fields-of-view (FOVs) with CT and MR. The cross-sectional evaluations available from both modalities provide excellent soft tissue detail and high levels of contrast between the veins and adjacent structures; this offers a depiction of venous anatomy, an ability to delineate masses affecting the veins, a demonstration of intraluminal pathology, and the capacity to reveal communications with other structures.
This chapter will review the anatomy, anomalies, and pathology of the systemic veins and the expanding role for both multidetector CT (MDCT) and MRI in venous evaluations. Clinical applications are discussed in detail, emphasizing detection of central venous thrombosis, thrombus characterization, definition of venous anatomy pre-central venous catheterization, and primary neoplasms of the veins as well as pitfalls in interpretation.
Spectrum and Prevalence of Diseases
Delineation of venous patency and anatomy is required in various clinical scenarios. Venous thrombosis is a common medical condition and can cause venous thromboembolism, which accounts for up to 250,000 hospitalizations and approximately 50,000 deaths per year in the United States (1). Its incidence is increased among elderly patients, those with reduced mobility (e.g., postsurgical states),
pregnancy and postpartum states, oral contraceptives, hormone replacement therapy, and malignancy, as well as among patients with underlying hematological disturbances, coagulopathies, or prolonged medical illness (2). Incidence is also increased in patients with extrinsic venous compression, long-term indwelling catheters for hemodialysis, chemotherapy, and hyperalimentation (3).
pregnancy and postpartum states, oral contraceptives, hormone replacement therapy, and malignancy, as well as among patients with underlying hematological disturbances, coagulopathies, or prolonged medical illness (2). Incidence is also increased in patients with extrinsic venous compression, long-term indwelling catheters for hemodialysis, chemotherapy, and hyperalimentation (3).
Localized venous thrombosis may influence surgical management in patients with renal and hepatic tumors. Imaging studies are indicated not only to confirm the presence or absence of thrombus but also to evaluate for an underlying cause, the extent and chronicity of thrombus, and to characterize the thrombus as bland or tumoral. This information can directly impact the patient’s prognosis and the suitability for surgical resection as well as the optimal surgical approach.
Venous occlusion has become a frequent problem in patients with long-term indwelling catheters. In these patients, defining the venous anatomy and patency is critical in order to achieve venous catheterization. In addition, due to a myriad of congenital variants, evaluation of venous anatomy is essential for central venous line placement in patients with anomalously coursing catheters seen on chest radiography. Evaluation of inferior vena cava (IVC) and renal venous anatomy may be critical in patients with anatomic variants receiving an IVC filter.
Embryology, Anatomy, and Congenital Anatomic Variants
Embryologic Development and Anatomy
Thoracic Veins: Upper Extremity and Intrathoracic Systemic Veins (Superior Vena Cava and Azygous System)
The internal and external jugular veins drain the face, neck, and head. They extend to drain into the brachiocephalic veins bilaterally. About 2.5 cm superior to this end point, there are a pair of valves in the internal jugular system. The vertebral vein drains in the brachiocephalic vein and also has a pair of valves near its orifice (4).
The subclavian vein arises at the outer edge of the first rib and represents the continuation of the axillary vein. It unites with the jugular vein in the region behind the sternoclavicular joint, forming the brachiocephalic vein. The right brachiocephalic vein is shorter and courses in a straighter and more vertical plane behind the sternum. The left brachiocephalic typically courses anterior to the brachiocephalic arteries. It unites with the contralateral brachiocephalic vein to form the superior vena cava (SVC) (4,5).
The tributaries of the brachiocephalic veins include the thymic, internal thoracic, inferior thyroid, intercostal, and pericardiophrenic veins. The internal thoracic veins extend along the medial aspect of the sternum and receive blood from the anterior intercostals and abdominal veins, such as the inferior epigastric veins. The right internal thoracic vein opening lies near the origin of the SVC, and thus, catheters can occasionally extend into the vein (4,5).
The pericardiophrenic vein drains the pericardium, pleural, and diaphragmatic regions and interconnects with the inferior phrenic vein, which drains into the IVC. This vein courses along the mediastinum with the phrenic nerve. This allows another central collateral pathway to bypass any central venous obstructions.
Azygous and Hemiazygous Systems
The azygous vein represents a collection of different venous systems draining the posterior chest wall and lumbar spinal region. It originates as a continuation from the right lumbar vein, and as it ascends, it receives the numerous posterior intercostal veins before coursing anterior over the right main bronchus into the SVC. There are between one and four valves, usually incomplete, located throughout the azygous and hemiazygous system. Usually, a valve is present within the azygous arch and can occasionally be seen on CT when there is reflux of contrast material (6).
The hemiazygous venous system is similar to the azygous system, receiving similar drainage but predominantly from the left intercostal veins. The two systems have numerous interconnections between them along the posterior ascending vertebral portion. It empties into the azygous vein at about the fifth vertebral body level.
The intercostal veins are divided three regions: supreme, superior, and standard intercostals. In each intercostal space are one posterior and two anterior intercostal veins.
The supreme intercostal veins (first intercostal space) drain into the brachiocephalic vein. The superior intercostal veins receive the drainage from the second through fourth intercostal veins, with the left also receiving flow from the hemiazygous vein. The right superior intercostal vein empties into the posterior superior aspect of the arch of the azygous vein. The left superior intercostal vein drains into the left brachiocephalic vein and also receives flow from the hemiazygous vein. The next eight posterior intercostal vessels drain directly into the azygous-hemiazygous system. The anterior veins drain into the internal mammary and musculophrenic venous systems (5).
A comprehensive understanding of the embryology that underlies the multiplicity of possible congenital variants is beyond the scope of this text, but some valuable references are provided to the interested reader (7,8,9,10). In general, redundant development and the variance in the
selective regression of multiple separate venous systems results in either a conventional configuration of the central veins or alternative configurations. Given the complex sequence of appearance and regression of multiple vessels, there are many possible anatomical variants.
selective regression of multiple separate venous systems results in either a conventional configuration of the central veins or alternative configurations. Given the complex sequence of appearance and regression of multiple vessels, there are many possible anatomical variants.
Congenital Variants
Superior Vena Cava/Azygous System Anomalies
Most variants of the SVC and azygous systems are asymptomatic unless they are associated with congenital heart disease.
Persistent Left Superior Vena Cava
A persistent left SVC can be seen with (double SVC) or without (left SVC) a right SVC. Up to 67% of patients with persistent left SVC have a bilateral or double SVC due to patency of the right and left anterior cardinal veins (11). Prevalence in the general population is 0.3%, while it reaches over 11% in patients with congenital heart disease (12). The right brachiocephalic trunk empties normally into the right atrium.
The left brachiocephalic trunk can flow into the coronary sinus, and with this pattern, patients can be asymptomatic (13). The left trunk can also empty into the left atrium or into the left superior pulmonary vein, both of which cause mixing of deoxygenated and oxygenated blood, causing profound hypoxemia and erythrocytosis (14,15). In addition, 50% to 70% of patients with this form are at risk of paradoxical embolism because of accompanying lesions (atrial septal defect, unroofed coronary sinus, or direct communication of the vein to the left atrium) (11).
In the absence of a right SVC, the left SVC usually empties into the coronary sinus, which in turn empties into the right atrium (Fig. 24-1). It derives from persistence of the left anterior cardinal vein instead of the right anterior cardinal vein. Individuals with the anomaly are asymptomatic. Incidence is 0.3% to 0.5% of the general population and 3% to 5% of patients with congenital heart disease.
A double or persistent left SVC draining into the coronary sinus should be considered as a potential cause of a dilated coronary sinus detected on transesophageal echocardiograms (13).
Anomalous Pulmonary Venous Drainage
Typically, four pulmonary veins drain into the left atrium; however, anatomic variants are common. In a study on 201 patients undergoing chest CT for pulmonary embolism, pulmonary stenosis, or aortic injury, conventional anatomy with two atrial ostia for the right upper and lower lobe veins, with the middle lobe vein joining the upper lobe vein, was present in 68% of patients (16). Anatomic variants were noted on the right lung in the rest of patients with independent drainage of the middle lobe vein (or veins) directly into the left atrium (26% of patients) (16). In the same study, variability in the left lung was less common, with 86% of patients having two ostia for the left upper and lower lobe veins (16). A common trunk for these two veins was the most common anatomic variant (14%) (16).
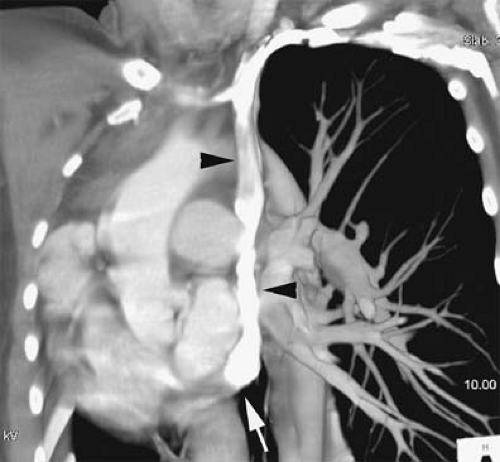 Figure 24-1 Left SVC. VR reconstruction of a CE CT of a patient with a persistent left-sided SVC (black arrowheads). Note its course, emptying into the coronary sinus (white arrow). |
Anomalous pulmonary venous drainage (APVD) is a spectrum of pulmonary venous anomalies that result from failure of connection between the primitive pulmonary splanchnic plexus and the common pulmonary vein derived from the atrium (10). APVD has been classified into four groups depending on the level of the drainage of the anomalous vein: supracardiac, cardiac, infradiaphragmatic, and mixed (10). Pulmonary venous blood drains directly into the right side of the heart or systemic veins, causing an extracardiac left-to-right shunt (10). APVD can be total, when all pulmonary veins drain anomalously, or partial, when one or more of the pulmonary veins drain normally within the left atrium (Figs. 24-2, 24-3). For survival, total APVD requires the presence of a right-to-left shunt via a cardiac septal defect or patent ductus arteriosus (10). A more detailed discussion of APVD can be found in Chapter 16.
Hypogenetic lung (Scimitar) syndrome is the result of an abnormal development of the lung, occurring almost
always on the right. A small lung is associated, with a small or absent pulmonary artery and systemic arterial supply as well as anomalous venous return (10). The anomalous pulmonary venous return usually drains into the IVC below the right hemidiaphragm, although it may drain in the suprahepatic portion of the IVC (Fig. 24-4), hepatic vein, portal vein, azygous vein, coronary sinus, or right atrium (10). Other anomalies can be present, including anomalies of the right bronchial tree, which is commonly a mirror image of the left, and diverticula (10). Other cardiovascular anomalies are also frequent (10).
always on the right. A small lung is associated, with a small or absent pulmonary artery and systemic arterial supply as well as anomalous venous return (10). The anomalous pulmonary venous return usually drains into the IVC below the right hemidiaphragm, although it may drain in the suprahepatic portion of the IVC (Fig. 24-4), hepatic vein, portal vein, azygous vein, coronary sinus, or right atrium (10). Other anomalies can be present, including anomalies of the right bronchial tree, which is commonly a mirror image of the left, and diverticula (10). Other cardiovascular anomalies are also frequent (10).
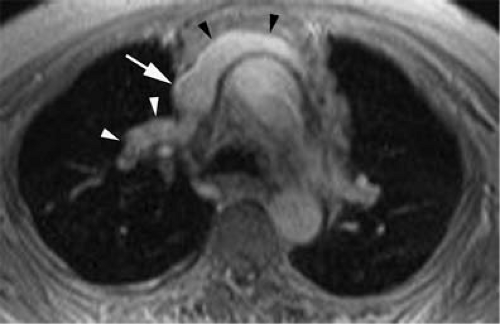 Figure 24-2 Partial anomalous pulmonary venous return—right upper pulmonary vein. Axial 2D magnetization-prepared T1-weighted gradient echo image during the delayed venous phase shows the left brachiocephalic vein (black arrowheads) joining with the SVC (white arrow). The right upper pulmonary vein (white arrowheads) is identified draining into the SVC, indicating partial anomalous pulmonary venous return. The rest of the pulmonary veins (not shown) drained normally into the left atrium. |
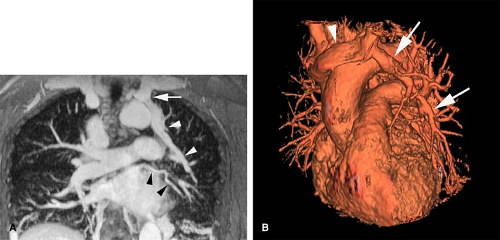 Figure 24-3 Partial anomalous pulmonary venous return—left upper pulmonary vein. A: Coronal thick-slab MIP reconstruction of a 3D fat-saturated T1-weighted gradient echo acquisition obtained during the delayed venous phase shows an aberrant left upper lobe pulmonary vein (white arrowheads) draining into the left subclavian vein (white arrow). Note a tiny vestigial left superior pulmonary vein (black arrowheads) draining into the left atrium. The right and inferior left pulmonary veins (not shown) drained normally into the left atrium. B: VR reconstruction of the same acquisition as (A) better displays the relationship of the aberrant left pulmonary vein (white arrows) draining into the left brachiocephalic vein (white arrowhead) in this case of partial anomalous pulmonary venous return. |
Absence of the Azygous Vein
This very rare asymptomatic anomaly occurs as the result of embryologic developmental failure of the cranial aspect of the right supracardinal veins. The azygous vein receives nearly all the venous drainage from the right intercostal veins. In agenesis of the azygous vein, the hemiazygous vein plays an important role in the hemodynamics, draining almost all of the right and left intercostal veins. This condition increases the venous flow into the left superior intercostal vein (17).
Inferior Vena Cava Anomalies
Many of the IVC system anomalies can occur as isolated entities or in combination.
Double Inferior Vena Cava
This derives from the persistence of both supracardinal veins. Prevalence is 0.2% to 0.3%. The left infrarenal IVC
typically joins with the left renal vein, and the right infrarenal IVC has a conventional configuration (Figs. 24-5, 24-6).
typically joins with the left renal vein, and the right infrarenal IVC has a conventional configuration (Figs. 24-5, 24-6).
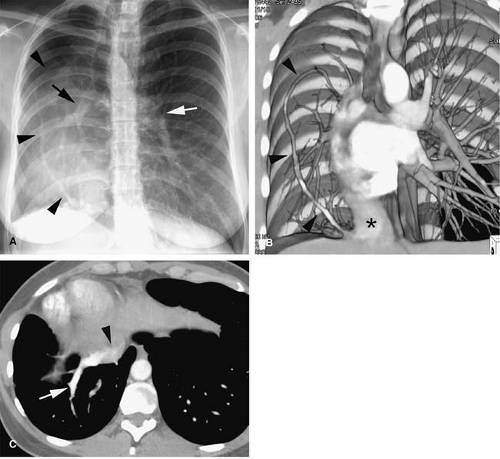 Figure 24-4 Scimitar syndrome. A: Anteroposterior chest radiograph showing a curvilinear opacity in the right lung base (black arrowheads). Note the small-sized right lung with rightward tracheal deviation and mediastinal shift. The right pulmonary artery (black arrow) is also small compared with the left pulmonary artery (white arrow). B: 3D VR reconstruction from a CT angiogram in the same patient confirms the presence of an aberrant (scimitar) pulmonary vein (black arrowheads) in the right lung draining into the inferior vena cava (*). C: Axial CE CT image (same acquisition as B) better demonstrates the aberrant (scimitar) vein (white arrow) emptying into the suprahepatic IVC (black arrowhead). |
Left Inferior Vena Cava
This derives from regression of the right supracardinal vein with persistence of the left supracardinal vein. The left IVC typically joins with the left renal vein, which merges with the right renal vein to form a normally positioned right-sided suprarenal IVC. Prevalence is 0.2% to 0.5%.
Double Right Inferior Vena Cava
This is a very uncommon variant, with two cases reported in the literature. The anomaly occurs by persistence of the infrarenal portions of both the supracardinal and subcardinal veins. The ureter must course laterally with respect of the two veins to rule out a persistent right posterior cardinal vein.
Azygous Continuation of the Inferior Vena Cava
Also known as absence of the hepatic segment of the IVC with azygous continuation, this condition occurs following anastomotic failure between the right vitelline vein and the right subcardinal vein, with resulting atrophy of the right subcardinal vein. Blood is thus diverted through the subcardinal-supracardinal anastomosis into the supracardinal system. The azygous vein is derived from thoracic segments of the supracardinal vein and drains normally into the SVC.
Azygous continuation of an anomalous IVC is seen in 0.6% of patients with congenital heart disease and has
been associated with the polysplenia/asplenia syndrome. It is a common cause of dilatation of the azygous vein. The IVC is usually interrupted at the level of the intrahepatic IVC, and blood returning from the abdomen and legs is routed through the azygous and hemiazygous veins (Fig. 24-7).
Occasionally, the hemiazygous vein may be the main collateral pathway from the abdomen to the chest (Fig. 24-8). The hepatic veins drain into the hepatic segment of the IVC, which drains directly into the right atrium (8).
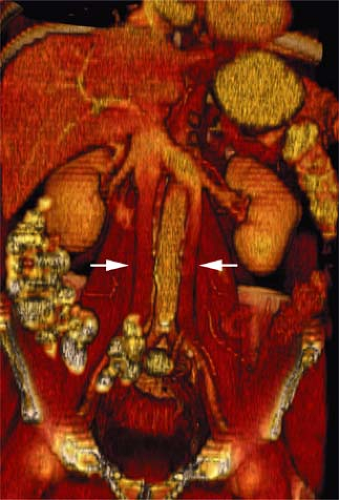 Figure 24-5 Double IVC demonstrated with CT. Coronal volume rendering reconstruction from a CE MDCT examination of the abdomen and pelvis shows an IVC (white arrows) at each side of the aorta. The left IVC drains into the left renal vein. (Courtesy of Alejandro Zuluaga.) |
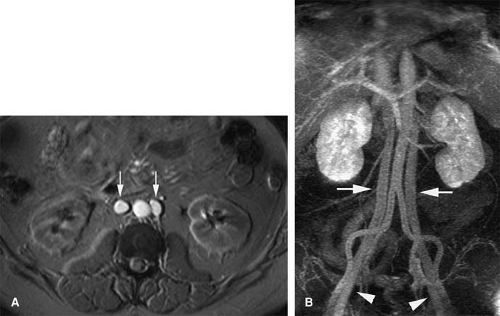 Figure 24-6 Double IVC demonstrated with MR. A: Axial TOF image shows two large patent vessels (white arrows) at each side of the aorta. B: Coronal MIP reconstruction from a 3D T1-weighted gradient echo sequence obtained during the delayed phase confirms the enhancement of the duplicated IVC (white arrows). Note continuation of each IVC with each ipsilateral iliac and femoral (white arrowheads) veins. (Courtesy of Stanford University Cardiovascular Imaging.) |
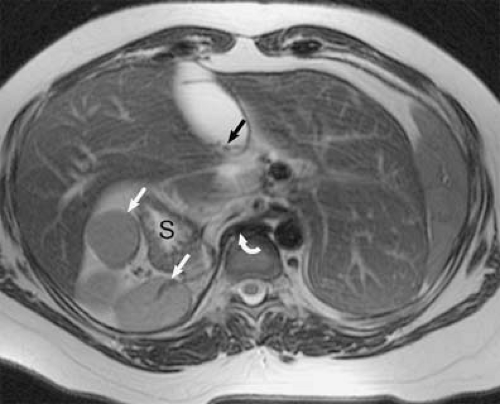 Figure 24-7 Polysplenia. Axial T2-weighted FSE image shows a midline liver and a gallbladder, which contains a few small gallstones (black arrow). Multiple right-sided splenules (white arrows) are seen. Note lack of visualization of the IVC in this patient with azygous continuation, which is visualized as a retrocrural flow void (curved arrow). The stomach (S) is on the right. |
The IVC passes posterior to the diaphragmatic crura to anastomose with the azygous vein. Conventional renal venous anatomy is preserved, except that both right and left gonadal veins drain into the ipsilateral renal vein.
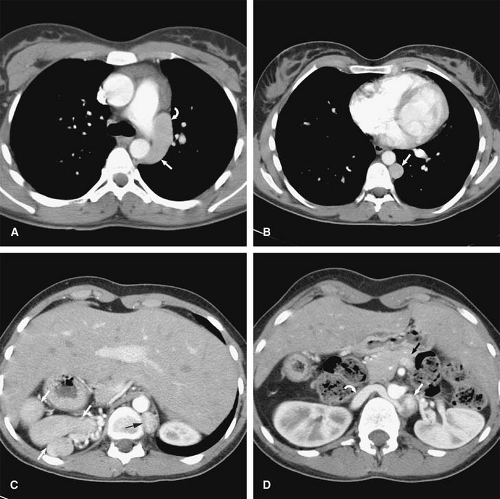 Figure 24-8 Polysplenia with hemiazygous continuation. Axial CE CT images of the chest in a patient with polysplenia shows an enlarged hemiazygous vein (white arrows in A and B). C: Axial CT image at the level of the upper abdomen shows a midline liver anteriorly and multiple splenules (white arrows) in the right upper quadrant. The enlarged hemiazygous vein (black arrow) is seen again. D: Axial CT image inferior to C shows communication between the azygous vein (white arrow) and the IVC (curved arrow), crossing the midline behind the aorta. A truncated tail of the pancreas and absence of the uncinate process is seen. There is an abnormal relationship of the superior mesenteric vessels (black arrow) indicating intestinal malrotation. Overall, these findings are all hallmark imaging findings of polysplenia. |
Left Infrarenal Inferior Vena Cava with Hemiazygous Continuation
This results from a persistence of the left supracardinal vein, with regression of the right supracardinal vein. The left supracardinal vein eventually becomes the hemiazygous vein in the thorax, which empties via the normal pathway. The right and left renal veins and suprarenal IVC are of conventional configuration.
Absence of the Infrarenal Inferior Vena Cava
The venous drainage of the lower extremities occurs via multiple collaterals in the lumbar, sacral, and inferior epigastric systems. It is thought by many not to be a true congenital anomaly but instead caused by in utero thrombosis of the infrarenal IVC.
Renal Vein Anomalies
Retroaortic Left Renal Vein
A persistence of the dorsal arch of the renal collar, with regression of the intersubcardinal anastomosis, gives rise to a retroaortic left renal vein. The prevalence is 2.1%. A single left renal vein passes posterior to the aorta (Fig. 24-9).
Circumaortic Left Renal Vein
Circumaortic left renal vein occurs from persistence of the dorsal limb of the embryonic left renal vein and the dorsal arch of the renal collar. Prevalence has been reported as high as 8.7%. The superior vein receives the left adrenal vein and courses anterior to the aorta. The inferior left renal vein receives the gonadal vein and courses posterior to the aorta.
Double Inferior Vena Cava with Retroaortic Right Renal Vein and Hemiazygous Continuation of the Inferior Vena Cava
This anomaly is the result of failure of anastomosis of the right subcardinal vein to the vitelline vein, with persistence of the left supracardinal system. The right renal vein and infrarenal right supracardinal vein meet and pass posterior to the aorta to meet the left supracardinal vein, the cranial aspects of which become the hemiazygous vein, which empties via the conventional pathway via a rudimentary azygous vein. There is persistence of the dorsal right renal collar and atrophy of the ventral collar. There are multiple additional variations on where the hemiazygous vein can empty, including the coronary vein or via the accessory hemiazygous vein into the left brachiocephalic vein.
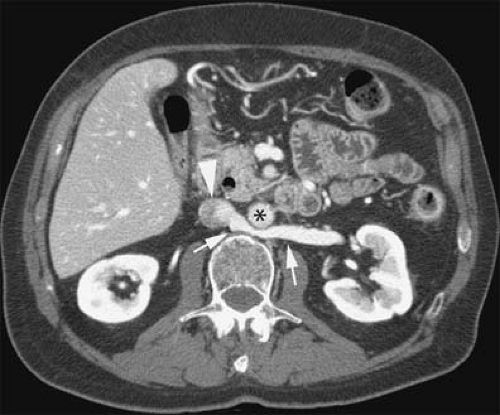 Figure 24-9 Retroaortic renal vein. Axial CE CT image at the level of the upper abdomen shows a retroaortic left renal vein (white arrows) as it crosses behind the aorta (*) to join the IVC (white arrowhead). |
Double Inferior Vena Cava with Retroaortic Left Renal Vein and Azygous Continuation of the Inferior Vena Cava
This occurs due to persistence of both supracardinal veins and the dorsal arch of the left renal collar, with regression of the ventral arch of the left renal collar. The anastomosis of the right subcardinal vein to the vitelline vein also fails. The left supracardinal vein empties into the left renal vein, which then empties into the right supracardinal system, the cranial aspect of which becomes the azygous vein. The azygous vein then drains normally into the SVC. This can reportedly be diagnosed with US by visualizing the renal artery crossing abnormally anterior to the IVC.
Retrocaval Ureter
This rare anomaly is also referred to as circumcaval ureter. With the exception of one case described in the literature, it always occurs on the right. The anomaly is due to failure of the right supracardinal venous system to develop, so the infrarenal segment of the IVC is formed by persistence of the right posterior cardinal vein, which anatomically lies ventrolateral to the embryonic kidney. Thus, the developing ureter will be located dorsal to the infrarenal IVC. Patients with this anomaly may develop partial right ureteral obstruction or recurrent urinary tract infections. Treatment is via surgical relocation of the ureter.
Double Inferior Vena Cava with Left Retrocaval Ureter
There are only three reported cases of this extremely rare anomaly. The embryologic development is similar to a double IVC, except that the left IVC is formed not from persistence of the left supracardinal vein but by persistence of the left subcardinal vein. The subcardinal vein lies ventral to the developing left kidney.
Complex Anomalies
Double Superior Vena Cava and Inferior Vena Cava
This is an uncommon anomaly that is rarely reported in the literature. It occurs from persistence of the left anterior cardinal vein, the left supracardinal vein, and the left subcardinal vein. The abdominal venous systems are thus bilaterally symmetrical. The left SVC and IVC both empty into the left atrium, however, and cause cyanotic heart disease.
Left Superior Vena Cava and Inferior Vena Cava
This occurs from persistence of the left anterior cardinal vein in the thorax and the supracardinal vein in the abdomen. There is failure of the anastomosis between the right subcardinal vein and the vitelline vein, and the left supracardinal vein persists above the level of the left renal vein and continues on into the thorax as the hemiazygous vein, which anastomoses with the left SVC formed from the left anterior cardinal vein. This empties into the coronary sinus and into the right atrium.
Azygous Continuation of the Inferior Vena Cava with Left Superior Vena Cava
This occurs from failure of anastomosis of the right vitelline vein with the right subcardinal vein in conjunction with persistence of the right supracardinal vein and left anterior cardinal vein. The left SVC empties into the coronary sinus and then into the right atrium.
Left Inferior Vena Cava with Hemiazygous Continuation and Double Superior Vena Cava
This occurs exactly as left SVC and IVC except for persistence of the thoracic portions of both anterior cardinal veins.
Double Inferior Vena Cava with Azygous Continuation
This occurs from persistence of both abdominal supracardinal systems and the intersupracardinal anastomosis at the level of the diaphragm. There is atrophy of the left abdominal supracardinal system above the anastomosis and persistence of the right with continuity with the azygous. The blood from the left lower abdomen empties into the right supracardinal system via the intersupracardinal anastomosis, which then empties via the azygous vein into the SVC. There is agenesis of the suprarenal IVC with both renal veins draining via the supracardinal system. The hepatic veins drain conventionally into the right atrium.
Double Inferior Vena Cava with Azygous and Hemiazygous Continuation
This occurs exactly as double IVC with azygous continuation except that the intersupracardinal anastomosis regresses. The hemiazygous follows conventional drainage through the azygous into the SVC.
Absence of the Suprarenal Inferior Vena Cava with Azygous and Hemiazygous Continuation
This occurs from regression of the right vitelline vein and both suprarenal subcardinal veins. Below the renal veins, both supracardinal and subcardinal veins persist, along with the supracardinal-subcardinal anastomosis. Blood flows via the ipsilateral supracardinal systems into the azygous and hemiazygous veins, which drain conventionally into the SVC. There has been only one reported case of this anomaly.
Absent Superior Vena Cava with Azygous Drainage into the Inferior Vena Cava
This occurs from regression of both anterior cardinal veins. Drainage of the thorax is from the supracardinal system, which flows retrograde via the azygous and hemiazygous veins and anastomoses with the IVC at the level of the renal hilum. There is one case report of this anomaly.
Double Inferior Vena Cava with Hemiazygous Continuation of the Left Inferior Vena Cava
This is similar to double IVC except that the left renal vein empties into the left IVC, and the suprarenal supracardinal vein persists and continues into the thorax as the hemiazygous, which drains conventionally into the azygous vein. The right IVC is otherwise conventional.
Technical Considerations
Computed Tomography
Computed tomographic venography (CTV) has several intrinsic advantages over conventional venography. CT has superior contrast resolution, allowing the use of less concentrated contrast material. Less concentrated contrast material reduces the incidence of phlebitis (18). Venous structures poorly opacified by conventional venography are well visualized with CT (19). CT can also depict important extraluminal pathology.
CTV can be performed with either direct or indirect opacification. In direct venography, contrast is injected into an upstream vein and then imaged as during the first pass of media through the vein of interest. With indirect venography, veins are imaged after contrast has passed through the arterial system. Indirect venography has two important advantages that can offset the generally diminished contrast enhancement relative to direct techniques: (a) concurrent imaging of pulmonary or systemic arteries can be performed, and (b) direct injection into the peripheral veins of the hand or foot is averted.
The advantages in volume coverage speed performance enjoyed by the MDCT scanner are not as essential in venous imaging. Most venous pathology can be diagnosed with anisotropic data sets, and the enhancement of venous structures follows a broader trajectory than their companion arteries. The greater tube heating tolerances of modern, direct cooled tubes with MDCT facilitates combined arterial and indirect venous examinations.
CT evaluation after metallic stent placement in the venous system represents an important capability. MDCT imaging allows for accurate evaluation of the intrastent lumen (Fig. 24-10), while MRI suffers from susceptibility effects cause by certain metallic stents. CT is the examination of choice in patients with venous stents in whom there is clinical concern for occlusion or stenosis and no contraindication for iodinated contrast.
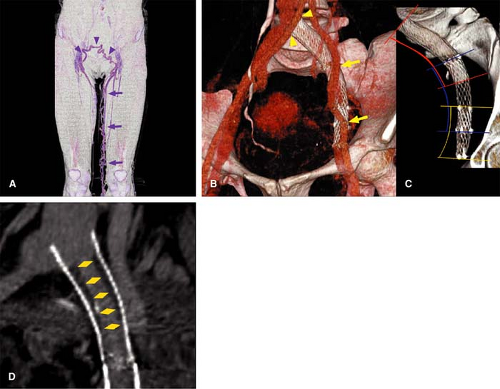 Figure 24-10 Neointimal hyperplasia after stenting. Neointimal hyperplasia 2½ years after common and external iliac vein stenting. CT scan from a 40-year-old female with a history of chronic DVT, 2½ years after left common and external iliac venous stenting to treat May-Thurner syndrome. A: VR shows extensive superficial varicosities (arrows) along the medial aspect of the left thigh draining into the right deep venous system through a network of superficial epigastric veins (arrowheads). B: VR of the pelvis shows three stents extending from the proximal common iliac vein to the distal external iliac vein. Note that the right common iliac artery (arrowheads) and the left common and external iliac arteries (arrows) cross over these stented segments. Although unusual, in this case, both the right and the left common iliac arteries resulted in compression of the left common iliac vein to cause the May-Thurner syndrome. C: VR shows the metallic structure as well as the overlap of the three stents (extent of stents demonstrated with different colors). D: Magnified curved planar reformations shows the longitudinal cross section of the stents. In the segment marked by yellow diamonds, there are linear areas of low density paralleling the stent wall, which result in luminal narrowing. Findings indicate moderate neointimal hyperplasia in the proximal stent. (Courtesy of Stanford University Cardiovascular Imaging.) |
Magnetic Resonance
Magnetic resonance venography (MRV) can be performed without (nonenhanced) and with (enhanced) the intravenous administration of contrast media. Nonenhanced techniques include flow-dependent or flow-independent sequences. CE MRV is usually performed with three-dimensional (3D) gradient echo sequences, although a two-dimensional (2D) approach with sequential acquisition can be useful in patients with limited breath-hold capacity.
Breath-hold imaging should be attempted in cooperative patients when imaging veins in the chest; abdomen; and to a lesser extent, the pelvis. Breathing artifacts degrade image quality and impair visualization of blood vessels. Additional artifacts secondary to physiologic motion can arise from cardiac pulsations and bowel peristalsis. Nonenhanced fast imaging and single-shot pulse sequences minimize
these artifacts and can facilitate the evaluation of central veins in the chest, abdomen, and pelvis.
these artifacts and can facilitate the evaluation of central veins in the chest, abdomen, and pelvis.
In general, suspended respiration is most reproducible during end-expiration. This is an essential consideration for subtraction postprocessing (see subtraction technique). End-expiratory breath holding is maximized by a brief coaching session prior to the exam, informing the patient about the importance of avoiding extremes in respiratory efforts. A nasal cannula to administer oxygen can greatly increase the individual’s breath-hold ability (20). MRI at end-inspiration with or without oxygen supplementation can further improve a patient’s respiratory capacity. A temporary suspension of the respirator in ventilated patients generally yields high-quality, motionfree images. Finally, if these strategies fail, rapid, motion-insensitive MR sequences are frequently used as a nonbreath-hold protocol.
Nonenhanced Techniques
Flow-independent Sequences
Spin Echo Imaging
With traditional T1- and T2-weighted spin echo (SE) sequences, moving blood appears homogeneously hypointense or black as the excited spins exit the imaged slice. This exit phenomenon yields no signal and is commonly termed as flow void (21). With flow void, intraluminal thrombus is appreciated as signal residing within a vessel lumen. Thrombus signal intensity depends on age of the thrombus but does not necessarily follow the same predictable time-dependent appearance as intracranial hemorrhage. Slow flow in a patent vessel can also demonstrate increased signal (21). Conventional T1- and T2-weighted SE sequences are not recommended as a first-line strategy for chest and abdominal MRV, as these require long acquisition times.
Fast Spin Echo Imaging
Fast spin echo (FSE) sequences (or turbo SE sequences) can be used to decrease long acquisition times associated with conventional SE sequences. For FSE sequences, multiple 180-degree refocusing pulses are applied after each 90-degree pulse, and the subsequent echoes are used to fill in the lines of k-space sequentially (22). With multiple phase-encoded steps performed per repetition time (TR), the speed of sequence acquisition is reduced proportional to the echo train length.
It is possible to use FSE to exploit the long T2 characteristics of blood and provide bright signal within blood vessels, independent from the direction or velocity of the flow (23). The T2 of blood depends on its oxygenation level and thus varies from 60 milliseconds in venous blood (oxygenation between 60% and 75%) to 220 milliseconds for arterial blood (24).
The T2 of venous blood is substantially longer than that of the other tissues on FSE acquisitions with long tau (time between 180° refocusing pulses) (25). A short echo time (TE) (<100 milliseconds) and a longer inter-TE can augment the signal difference between venous and arterial blood (25). At 1.5 T, a TE of 50 milliseconds provided maximum contrast-to-noise in the calf veins using a fat-saturated FSE sequence (23) although a TE >60 milliseconds can offer adequate suppression of the muscle (25). Fat-saturation techniques further improve suppression of the background signal, allowing for improved depiction of the veins, particularly when maximum intensity projection (MIP) algorithms are used.
The FSE MR venographic method can produce high-quality MR venograms in small extremity veins (e.g., calf and forearm) and is especially sensitive for depicting small branch veins (23).
In clinical practice, FSE sequences may have some value in cases where intravenous contrast is not recommended and other nonenhanced techniques provide inconclusive results. Improved visualization of small vessels in the calf by using FSE sequences has been described compared with time-of-flight (TOF) imaging (23).
Single-shot Turbo Spin Echo Imaging
In single-shot FSE imaging, all lines of k-space for a given slice are filled by multiple 180-degree refocusing pulses applied after a single excitation pulse (22). The “effective TE” in single-shot imaging represents the time between the excitation pulse and the particular TE of the echo train in which the central k-space line is acquired. Low-frequency lines in the center of k-space are typically sampled earlier in the echo train to provide adequate T2-weighted contrast and optimal signal-to-noise ratio (SNR). However, there is inherent blurring of single-shot images due to signal decay during the acquisition of the long echo train.
Half-Fourier techniques are commonly applied in conjunction with single-shot FSE sequences to further decrease acquisition time. These techniques rely on the inherent symmetry of k-space. By acquiring approximately 60% of the data to fill the k-space in half-Fourier techniques, such as half-Fourier single-shot turbo spin echo (HASTE, Siemens, Erlanger, Germany) or single-shot fast spin echo (SSFSE, General Electric Healthcare, Waukesha, WI), the remainder of the k-space can be mathematically calculated based on its symmetry. Since single-shot echo train imaging can be performed either with or without half-Fourier reconstruction, the acronym HASTE, which clearly connotes the use of half-Fourier reconstruction, will be used for the remainder of this chapter.
HASTE allows for very fast T2-weighted imaging, with most slices taking less than 1,000 milliseconds to acquire.
The quality of single-shot imaging is related to gradient performance. As a specific absorption rate (SAR)–intensive sequence, the number of slices obtainable in a multislice sequence can be constrained and compensated for with reduced flip angle (FA)–refocusing pulses.
The quality of single-shot imaging is related to gradient performance. As a specific absorption rate (SAR)–intensive sequence, the number of slices obtainable in a multislice sequence can be constrained and compensated for with reduced flip angle (FA)–refocusing pulses.
Multislice acquisitions are acquired in a sequential manner, with each slice completely acquired before it proceeds to the acquisition of the next slice. This sequence provides a motion-insensitive strategy for imaging patients with limited or no breath-hold capacity. If the patient can cooperate, however, breath holding is still recommended to preserve sequential display of the anatomy.
HASTE images, like conventional T1- and T2-weighted SE images, characteristically demonstrate a flow void within the vessels as the excited protons exit the imaging slice. Slow flow may allow the blood protons to spend enough time within the imaging slice to provide intravascular signal. Since HASTE acquisitions are T2 weighted and the T2 of blood is relatively long, vessels with slow flow may demonstrate very bright signal in these images. For more uniform suppression of blood signal, so-called double inversion strategies can be effective (28,29).
Bright signal from slow flow should not be confused with thrombus, the latter typically demonstrating intermediate gray signal intensity on HASTE sequences (Fig. 24-11). While this may be a source confusion, in the authors’ experience, the negative predictive value of HASTE imaging when intravascular flow voids are present is excellent.
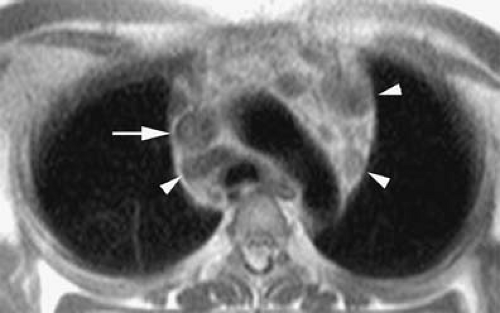 Figure 24-11 Acute SVC thrombosis on HASTE. Axial HASTE image through the level of the aortic arch in a 22-year-old female with history of Hodgkin lymphoma now referred for new face and neck swelling shows a normal flow void in the aortic arch. Multiple enlarged mediastinal lymph nodes are also present (white arrowheads). There is loss of the normal flow void in the SVC (white arrow), which shows intermediate signal intensity, indicating thrombus. Note the similarity of signal intensity to that of adjacent lymph nodes. Postcontrast images (not shown) confirmed the presence of occlusive thrombus in the SVC. |
The inherent T2 contrast and short acquisition times make this sequence an excellent approach for an initial survey of the body as well as dynamic acquisitions during Valsalva maneuvers. Dynamic HASTE imaging is a widely available technique that provides a rapid screening for venous thrombosis without the need for intravenous administration of contrast.
Dynamic single-shot FSE images are acquired perpendicular to the vessel of interest by using the following parameters: TR 800 milliseconds; TE 62; FA 120; 192 ÷ 256 matrix; slice thickness = 6 mm. Images are obtained during end expiration at a relaxed status and following a sequence command. The patient is instructed to perform a series of seven gradually increasing and then decreasing Valsalva maneuvers (relax, mild push, moderate push, extreme push, moderate push, mild push, relax). These seven images can then be displayed as a single acquisition in a movie loop that facilitates visualization of changes in signal intensity and vessel size.
The Valsalva maneuver increases the intrathoracic pressure with a subsequent decrease in the venous return to the heart. Valsalva also decreases blood velocity and causes enlargement of peripheral veins. With gradually increasing Valsalva effort, normal veins become gradually larger, reflecting vessel distensibility, and increased signal intensity of the blood can appear as a result of slow flow and temporary pooling (Fig. 24-12). The demonstration of both increased signal intensity within the vessel lumen and expansion of vessel caliber in response to a Valsalva maneuver has excellent negative predictive value to exclude venous thrombosis (unpublished data). Thrombosed veins demonstrate intermediate gray signal intensity before and after Valsalva maneuvers on these images without apparent signal intensity change or vessel enlargement (Fig. 24-13).
Steady-state Free Precession Imaging
Steady-state free precession (SSFP) imaging is a coherent steady-state technique in which a fully balanced gradient waveform is used to recycle transverse magnetization to preserve signal intensity in species with a long T2 (30). Examples of these techniques among different manufacturers include true fast imaging with steady-state precession (true FISP, Siemens, Erlanger, Germany), fast imaging employing steady state acquisition (FIESTA, GE Healthcare, Waukesha, WI), or balanced fast field echo (balanced FFE, Philips, Bothell, WA). The transverse magnetization is maintained in the steady state from one TR to the next by rewinding the gradient waveforms on all axes (30). The gradients are perfectly balanced, and the total gradient area is zero at the end of each cycle (30).
Image contrast depends on the T2/T1 ratio and is nearly independent of blood flow (31). The high T2/T1 ratio of blood yields high signal intensity on true FISP images without intravenous contrast material (30). The
rapid nature of this sequence provides diminished sensitivity to motion.
rapid nature of this sequence provides diminished sensitivity to motion.
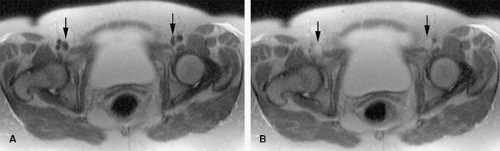 Figure 24-12 Dynamic Valsalva HASTE imaging—normal signal intensity patterns. Imaging was performed for a 25-year-old woman with acute onset of shortness of breath 3 days after vaginal delivery. A: Axial HASTE images at the level of the inguinal region obtained at rest shows normal flow voids in the femoral veins (arrows). B: Axial HASTE images obtained at the same level as image (A) during maximum Valsalva effort demonstrates increased size and signal intensity in the femoral veins, findings that virtually exclude the diagnosis of venous thrombosis in this location. |
SSFP images obtained perpendicular to the vessel or vessels of interest are usually the most useful. Multislice acquisitions are acquired in a sequential manner, with each image acquired in approximately 1 second or less. This imaging approach is insensitive to respiratory artifacts and allows for a rapid evaluation of the entire chest, abdomen, or pelvis in a single breath hold. Short TRs and very short TEs are recommended to decrease artifacts related to T2* decay and off-resonance effects.
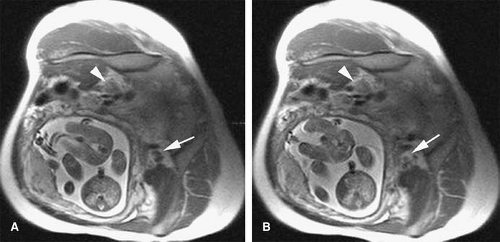 Figure 24-13 Dynamic Valsalva HASTE imaging of left iliac deep vein thrombosis in a 42-year-old pregnant woman (20 weeks gestational age) with acute left lower extremity swelling. TOF imaging (not shown) in the supine position failed to show flow in the left iliac vein. The patient was placed in the right lateral decubitus in an attempt to decompress the left iliac vein. A: Axial HASTE image at the level of the upper pelvis obtained at rest shows normal flow void in the right iliac vein (arrow). The left iliac vein (arrowhead) is enlarged and shows intermediate signal intensity. B: Axial HASTE image obtained during maximum Valsalva maneuver. The right iliac vein (white arrow) increases in size and signal intensity, confirming the presence of normal flow. The appearance of the left iliac vein (white arrowhead) remains unchanged, which is consistent with venous thrombosis. Follow-up gadolinium-enhanced MR after delivery following anticoagulation therapy showed a narrowed recanalized left iliac vein. |
SSFP imaging has been proposed as an alternative to gadolinium-enhanced magnetic resonance angiography (MRA) for rapid assessment of patients with suspected
acute aortic dissection (32) and comprehensive evaluation of the entire hepatic vasculature in potential liver donors (33). It allows for thrombus to be visualized as intravascular filling defects with low signal intensity compared with the surrounding hyperintense blood (Fig. 24-14) and has been recently proposed as a noninvasive, fast approach for detection of venous thrombus in the veins of the abdomen, pelvis, and lower extremities (34).
acute aortic dissection (32) and comprehensive evaluation of the entire hepatic vasculature in potential liver donors (33). It allows for thrombus to be visualized as intravascular filling defects with low signal intensity compared with the surrounding hyperintense blood (Fig. 24-14) and has been recently proposed as a noninvasive, fast approach for detection of venous thrombus in the veins of the abdomen, pelvis, and lower extremities (34).
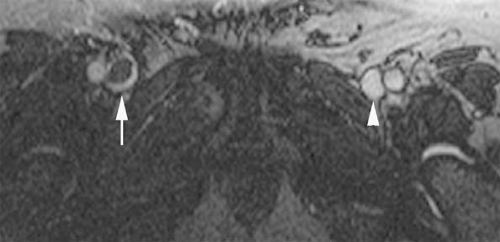 Figure 24-14 SSFP imaging of right common femoral deep vein thrombosis. Axial SSFP through the common femoral vessels in a patient with prior renal transplant and right lower extremity edema shows a round hypointense filling defect (white arrow) within the right common femoral vein. Note the difference in caliber compared with the normal left common femoral vein (white arrowhead), which demonstrates uniform normal high signal. High signal blood surrounds the filling defect in the right common femoral vein, indicating an acute partially occlusive thrombus. |
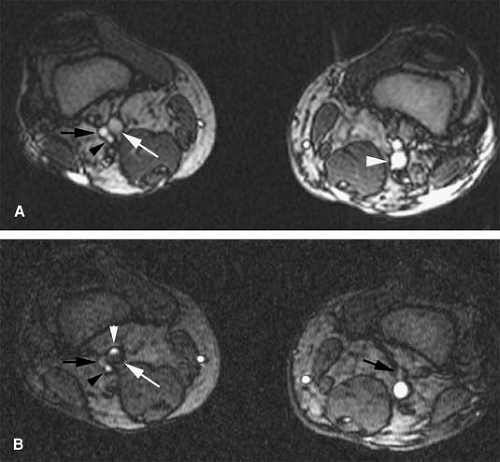 Figure 24-15 Popliteal thrombus missed with true FISP imaging. A: Axial true FISP image at the level of the popliteal fossa in a patient with suspected right-sided venous thrombosis shows slightly heterogeneous high signal intensity in the right popliteal vein (white arrow). Incidentally, a duplicated deep venous system is appreciated with an accessory right popliteal vein (black arrowhead). Laterally, the right popliteal artery (black arrow) is noted. A single left popliteal vein (white arrowhead) is seen. B: Axial TOF image acquired at the same level as (A), with a saturation band above the imaging slice to eliminate the inflowing signal from arterial spins. A nonocclusive thrombus (white arrow) is visualized in the right popliteal vein, which demonstrates flow anteriorly (white arrowhead). Normal flow is seen in the accessory right popliteal vein (black arrowhead) as well as the left popliteal vein. Note the lack of signal in the popliteal arteries (black arrows) due to the use of a superior saturation band. |
Pulsatility artifacts in SSFP images (30) may cause heterogeneous signal intensity that can be misinterpreted as thrombus (35). These artifacts are more common at the level of the confluence of veins or in areas where the veins change abruptly in direction. Furthermore, venous thrombus can be missed on these images in patients scanned in the subacute stage (1 to 3 weeks after onset of symptoms) (35) (Fig. 24-15). This is presumably related to the thrombus having T2/T1 characteristics similar to that of the blood pool. Increased signal intensity on T1- and T2-weighted images of carotid thrombi induced in swine has been described with the relative increase in SI significantly
higher on T2-weighted images than that on the T1-weighted images occurring during the first 3 weeks (36). This phenomenon may account for increased signal intensity within the thrombus and false-negative results of SSFP imaging in patients who are imaged in the subacute stage (35). Nevertheless, SSFP imaging can be valuable in patients without intravenous access and suspected venous thrombosis in whom gadolinium-enhanced techniques are not feasible. This is particularly true in those patients with limited breath-hold capability due to the relatively motion-insensitive nature of this sequence compared with other unenhanced techniques (e.g., TOF, phase contrast [PC]). In a recent study, SSFP had a sensitivity of 66% and a specificity of 77% for the diagnosis of venous thrombosis when compared with gadolinium-enhanced T1 gradient echo images (35).
higher on T2-weighted images than that on the T1-weighted images occurring during the first 3 weeks (36). This phenomenon may account for increased signal intensity within the thrombus and false-negative results of SSFP imaging in patients who are imaged in the subacute stage (35). Nevertheless, SSFP imaging can be valuable in patients without intravenous access and suspected venous thrombosis in whom gadolinium-enhanced techniques are not feasible. This is particularly true in those patients with limited breath-hold capability due to the relatively motion-insensitive nature of this sequence compared with other unenhanced techniques (e.g., TOF, phase contrast [PC]). In a recent study, SSFP had a sensitivity of 66% and a specificity of 77% for the diagnosis of venous thrombosis when compared with gadolinium-enhanced T1 gradient echo images (35).
A potential advantage of SSFP imaging is the possibility to obtain cine acquisitions with the use of cardiac triggering (30). Cardiac triggering may reduce pulsatile artifacts and thus improve the homogeneity of the signal within vessels. To the authors’ knowledge, the impact of cardiac triggering in the diagnostic accuracy of MRV with SSFP sequences has not yet been explored. However, in their experience, this approach is particularly valuable in the evaluation of the SVC and segments of the IVC close to the right atrium. Cardiac triggering virtually eliminates pulsation artifact in these vessels and allows for continued display of intraluminal thrombus during the cardiac cycle (37) (Fig. 24-16). Extreme degrees of motion of venous thrombus within the SVC and IVC may correlate with higher risk for thromboembolic events.
Flow-dependent Sequences (“Bright Blood” Magnetic Resonance Venography)
Time-of-flight Imaging
A major accomplishment for MR imaging was the realization that TOF properties could be exploited for MR vascular imaging (38,39,40,41). TRs shorter than the longitudinal relaxation time (T1) of the stationary spins within the imaging slice lead to decreased signal from partial saturation effects (41). When unsaturated blood spins (not excited by the spatially selected radio frequency pulses) move from outside the slice into the imaging slice, they produce a much stronger signal than the partially saturated signal of the stationary spin within the imaging slice (41). This produces the “entry slice phenomenon” or “inflow enhancement,” in which signal intensity within the vessels is strong while signal in the stationary tissue is weak. For details on TOF imaging techniques, please refer to Chapter 2.
TOF optimization to depict slow flow within veins includes prescription of the imaging slices perpendicular to the vessel of interest and the use of thin sections (3 to 5 mm). A determination of vessel patency over a large FOV with TOF can be time-consuming. Fewer slices with interslice spacing reduce the total acquisition time. A demonstration of bright intraluminal signal in those slices will establish vessel patency. However, the relatively limited sampling could result in undetected, small partial thrombosis and in an inability to render a meaningful MIP reconstruction. This sparsely sampled TOF approach can be effective before gadolinium-enhanced MRV is performed for assessment of vessel patency and the direction of flow within the vein of interest.
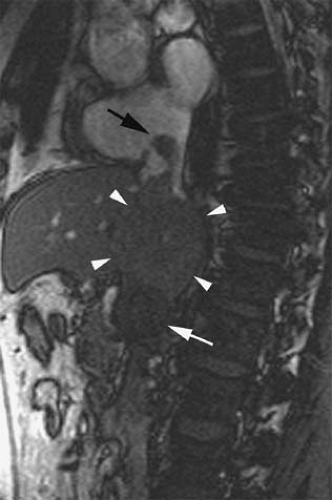 Figure 24-16 True FISP imaging of IVC thrombus extending into the right atrium. Sagittal FISP through the IVC shows expansion of the intrahepatic segment of the cava (white arrowheads), with complete loss of normal bright blood signal within the IVC, indicating complete thrombosis. Slightly lower signal intensity is seen in the infrahepatic IVC (white arrow), which corresponds to a previously placed IVC filter. A fragment of thrombus that extends into the right atrium (black arrow) is only attached to the larger IVC thrombus by a thin stalk and is at risk for detachment and embolization. |
Increased signal intensity caused by the entry-slice phenomenon is not directional. Systemic arteries and veins, when adjacent to each other, tend to run in opposite directions, but both appear bright on the slice imaged with TOF. A saturation band is used to selectively eliminate the signal from the flowing spins entering the slice from a chosen direction (42). For uniform suppression, the saturation
band is applied in a consistent, close proximity to the slice, referred to as a traveling saturation band.
band is applied in a consistent, close proximity to the slice, referred to as a traveling saturation band.
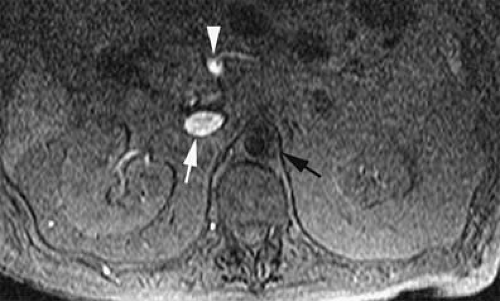 Figure 24-17 Saturation band showing portal venous flow direction. A saturation band may be applied either above or below the imaging slice to suppress signal from spins moving into the imaging slice from above or below, respectively. Appropriate usage of saturation bands allows for evaluation of flow direction. In normal circumstances, blood flow in the portal vein is in a caudal-cranial direction and parallels flow in the IVC. In this image with a saturation band above the imaging slice, flow-related signal is only seen in the caudad to craniad direction, within both the IVC (white arrow) and portal vein (white arrowhead). This indicates both portal vein patency as well as appropriate hepatopetal flow direction. Note that signal intensity within the aorta (black arrow) is suppressed by the saturation band. |
MRV is performed by saturating the signal from the arterial spins. Placement of the saturation band, either above or below the imaging slice, depends on the anatomic location of the slice as it relates to the heart. Below the heart, the aortic signal is suppressed by placing the saturation band above the slice. In so doing, bright signal is selectively displayed within those vessels that have blood entering from below the slice (i.e., IVC, portal vein) (Fig. 24-17). This approach can be used for determination of both the vessel patency and its flow direction.
Above the heart, axial venographic TOF images are acquired with a saturation band applied below the imaging slice in order to eliminate the signal from arterial spins (Fig. 24-18). For the subclavian veins, sagittal images are needed for a perpendicular orientation with respect to the vessel orientation (Fig. 24-19). In order to suppress the arterial signal, the saturation band located medial to the imaging slice (left to the slice for the right hemithorax and right to the slice for the left hemithorax) will provide MRV TOF images of the subclavian veins.
Typical MR acquisition parameters for TOF imaging are TR = 25 to 30 milliseconds; TE = 6 to 10 milliseconds; FA = 30 to 45°; thickness 3 to 5 mm; matrix 128 ÷ 256, and application of flow compensation gradients. Low FAs (<20°) can lead to decreased suppression of the background signal as well as a poor SNR. Very high FAs (>45°) can cause saturation of the slower venous blood signal. A MIP algorithm applied to TOF images can generate venogram-like images, displaying the venous anatomy (and the extent of occlusion)
in a familiar and readily accepted manner (Fig. 24-20).
in a familiar and readily accepted manner (Fig. 24-20).
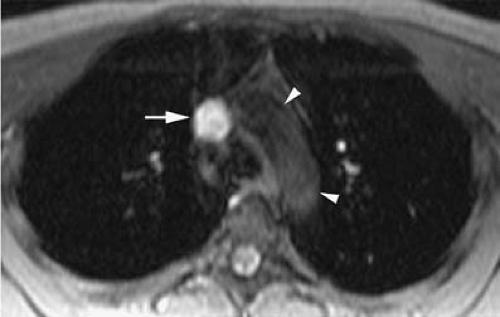 Figure 24-18 Normal TOF imaging of the great vessels with an inferior saturation band. Axial TOF image of the chest acquired with an inferior saturation band shows normal craniocaudal flow in the SVC (white arrow). Flow in the aortic arch (white arrowheads) entering the slice inferiorly has been saturated by the inferior saturation band. |
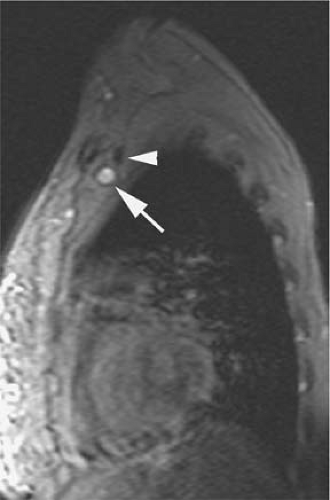 Figure 24-19 Normal TOF imaging of the subclavian vein with a medial saturation band. Sagittal TOF image at the level of the left mid clavicular line obtained with a saturation band positioned medial to the slice shows homogeneous high signal intensity in the left subclavian vein (white arrow), while the signal in the subclavian artery (white arrowhead) has been saturated. |
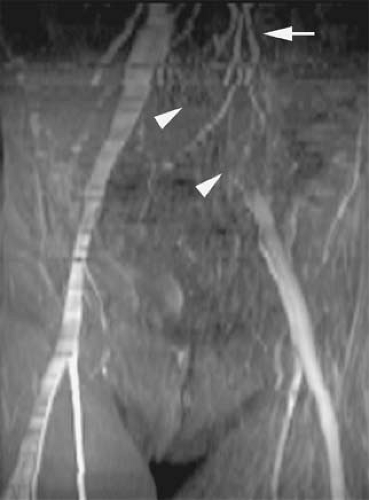 Figure 24-20 TOF imaging of left iliac venous thrombosis. MIP reconstruction of an axial multislice TOF acquisition of the pelvis shows lack of signal intensity in the left iliac vein (white arrowheads) due to thrombosis. Multiple smaller collateral veins (white arrow) are identified in the region. |
With TOF, venous thrombosis will appear as a hypointense filling defect within the hyperintense column of flowing blood (43,44,45,46). MR using 2D TOF has demonstrated good correlation with conventional venography in the diagnosis of venous thrombosis (44,47,48,49). Reported sensitivity and specificity are also high compared with duplex sonography (49). Pitfalls can result from in-plane saturation of the intraluminal signal simulating venous thrombus, particularly when blood is not flowing orthogonal to the imaging slice. Turbulent flow can manifest as an area of low signal intensity, seen often near venous confluences, also mimicking a filling defect. Subacute clot can demonstrate high signal intensity similar to that of the flowing blood, blending imperceptive with the normal blood signal (50). Thrombus that is not completely occlusive, especially small areas of clot adhering to the vessel wall, can be difficult to visualize by TOF (45).
Phase Contrast Imaging
PC is another technique that exploits the moving nature of blood to create an image. Spins moving in the presence of a magnetic field gradient accumulate additional phase shift (51,52,53). The amount of shift is directly proportional to the velocity of the spins and the strength of the gradient (52).
Flow-induced phase shifts arise only from the component of motion along the gradient direction. Thus, three orthogonal gradient directions must be employed in evaluating multidirectional flow (53). The strength of the gradient must also be carefully matched to the velocity of the blood being imaged.
Thus, it is desirable to know the velocity of the blood to be imaged before performing the imaging. Ideally, velocity-encoding values should be chosen to exceed the maximum expected velocity by about 25% (25). For PC imaging of the venous system, a velocity-encoding value of approximately 20 cm/second is typically used (25). Phase contrast venography (PCV) is rarely used in the body.
Contrast-enhanced Magnetic Resonance Venography
Three-dimensional T1-weighted gradient echo sequences allow for assessment of larger anatomic areas, with excellent spatial resolution during a single breath hold, and largely eliminate the artifacts from flow turbulence and in-plane saturation that typify noncontrast MRV techniques (45,54). The 3D sequences are acquired during and after intravenous administration of gadolinium contrast media. CE MRV relies on the T1-shortening effect of intravenous gadolinium preparations on blood, yielding high signal intensity.
CE MRV can be done either directly or indirectly. Direct MRV consists of injection of dilute contrast in the distal aspect of the affected extremity, with subsequent image acquisition. Indirect MRV relies on circulation of injected concentrated contrast media, with subsequent imaging at calculated vascular phases (arterial, venous, delay).
Contrast Agents
Conventional gadolinium contrast agents, distributed in the extravascular, extracellular fluid (ECF), offer excellent signal to noise during a delayed, equilibrium phase and yield intense homogeneous venous enhancement even after administration of a single dose of gadolinium. The relative safety and efficacy of gadolinium venography makes it an excellent choice for patients with certain degrees of renal insufficiency or an allergy to iodinated contrast media (55,56,57). Gadolinium venography has been useful to identify venous access for patients with renal failure (58). Recent concerns associating severe renal insufficiency, gadolinium contrast administration, and nephrogenic systemic fibrosis will need to be considered when balancing the risk:benefit ratio for gadolinium venography in this patient population (59,60,61).
Blood pool agents (e.g., MS-325, NC100150) offer prolonged and strong venous enhancement (62,63)
(Fig. 24-21). This capacity can significantly improve diagnostic conspicuity and contrast in iliocaval venous opacification compared with extracellular contrast media–enhanced MRV (63). The prolonged half-life may offer additional convenience with the possibility of contrast material administration preceding transfer of the patient to the imaging suite.
(Fig. 24-21). This capacity can significantly improve diagnostic conspicuity and contrast in iliocaval venous opacification compared with extracellular contrast media–enhanced MRV (63). The prolonged half-life may offer additional convenience with the possibility of contrast material administration preceding transfer of the patient to the imaging suite.
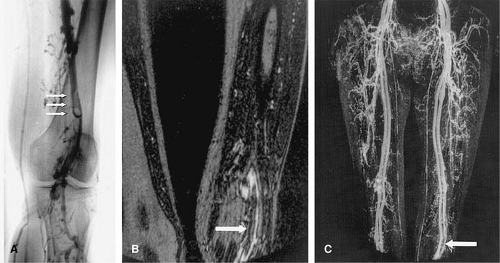 Figure 24-21 Superficial femoral vein thrombus with blood pool MR contrast media (Clariscan). Thrombus in the superficial femoral vein (arrows) with exact agreement between conventional venography (A) and MRV (B, C). The MIP image does not show the full extent of the disease (C). Despite motion degradation, the study was rated diagnostic. (With permission from Aschauer M, Deutschmann HA, Stollberger R, et al. Value of a blood pool contrast agent in MR venography of the lower extremities and pelvis: preliminary results in 12 patients. Magn Reson Med. 2003;50:993–1002.) |
Indirect Magnetic Resonance Venography
Three-dimensional T1-weighted gradient echo sequences cover a large area of anatomy in a single vascular phase. Twenty- to twenty-five-second acquisitions provide sufficient anatomic coverage during end expiration breath holds, when needed. Subsequent vascular contrast phases can then be obtained, while allowing the patient time to breathe in the interim. With reproducible breath-holding, subtraction technique can be used to maximize target to background contrast and to generate a venogram (64).
After a timing run and calculation of an appropriate delay time, the authors perform indirect MRV by using a 3D fat-saturated T1-weighted gradient echo sequence (TR = 4.2, TE = 1.7, FA = 25, 160 ÷ 256 matrix, slice thickness 1.5 to 2.5 interpolated, slab thickness 80 to 160 mm). Fat saturation should be avoided in the chest and neck, where inadvertent water suppression could eliminate the gadolinium signal (65). Contrast administration consists of a double dose (0.2 mmol/kg body weight) of gadopentetate dimeglumine (Magnevist, Berlex Laboratories, Wayne, NJ) through intravenous access in an antecubital vein. When upper extremity thrombosis is in question, the contralateral arm is injected.
With conventional extracellular-gadolinium agents, a biphasic administration yields good-quality enhancement of the blood pool. The total dose of gadolinium is administered as follows: 0.1 mmol/kg body weight at 2 cc/second immediately followed by 0.1 mmol/kg body weight at 0.8 cc/second, in a single injection. An additional 20 cc of saline flush is injected at 0.8 cc/second. Evaluation of the visceral veins, including the portal and renal veins, is typically performed with a single dose of gadolinium (0.1 mmol/kg body weight at 2 cc/second) with excellent results.
Bolus injection timing is essential when a selective venous study is desired. First, a “vein-free” arterial phase is captured by using a timing examination with administration of 1 cc of gadopentetate dimeglumine at a rate of 2 cc/second through a peripheral intravenous line in an antecubital vein, as previously described by Earls and associates (66). This approach ensures acquisition of the central region of the k-space during the middle of the administered bolus, thus guaranteeing appropriate arterial enhancement throughout that entire 3D data set. The delay time (Td), or the time between injection initiation and the scan start time, can be effectively calculated with the following equation:
Td = Tc +Ti/2 – Ts/2
where Tc is the circulation time, Ti is the injection time for the first component of the injection (administered at 2 cc/ second), and Ts is the scan acquisition time. Tc is the time between injection initiation and the peak arterial enhancement in the anatomic region of interest (ROI), and it is estimated by the timing run.
For example, if the contrast arrives to the abdominal aorta 20 seconds after initiation of the injection of 1 cc of gadolinium at 2 cc/second, then Tc equals 20. If the patient’s weight is 80 kg, a double dose (0.2 mmol/kg body weight) will be 80 ÷ 0.4 = 32 cc. A single dose (16 cc) is given intravenously at 2cc/second followed by a second dose (16 cc) at 0.8 cc/second in a single injection. The injection time for the first component of the injection given at 2 cc/second is 16/2 = 8 seconds. For an acquisition time of 24 seconds, the time delay for starting the acquisition would be:
Td = 20 + 8/2 – 24/2 = 20 + 4 – 12 = 12 seconds
In this example, acquisition of the first 3D data set (arterial phase) should be timed so that the acquisition is initiated 12 seconds into the gadolinium administration. Breathing instructions are typically given before starting the acquisition. Hyperventilation prior to the breath-hold procedure improves the patient’s performance. In the authors’ experience, two cycles of the command “breath in, breath out” take approximately 6 seconds and yield good results. Therefore, in the theoretical patient, two sets of breathing instructions would be started 6 seconds after the initiation of the contrast injection, and the acquisition would be started immediately after completing the breathing instructions (12 seconds after initiation of the injection of contrast).
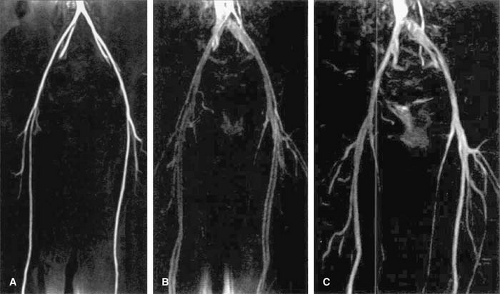 Figure 24-22 Indirect MRV with subtraction display in a 49-year-old woman. This woman with clinically suspected iliac deep venous thrombosis represents source data lacking appreciable flow-related enhancement. A: MIP MR image from arterial phase gadolinium-enhanced 3D MR acquisition (5/2;FA, 50) shows normal aortoiliac system. B: MIP MR image from blood pool phase gadolinium-enhanced 3D MR acquisition (5/2; FA, 50) shows normal aortoiliac veins and arteries. C: MIP MR image from subtraction venogram (blood pool phase minus arterial phase) shows normal venous anatomy. (Adapted with permission from Lebowitz JA, Rofsky NM, Krinsky GA, et al. Gadolinium-enhanced body MR venography with subtraction technique. AJR Am J Roentgenol. 1997;169:755–758.) |
After the “venous-free” acquisition is obtained during the arterial phase, two additional acquisitions are obtained at 40 seconds and 90 seconds delay after the arterial peak. Typically, delayed blood pool acquisitions are used for making the diagnosis.
The arterial (A) acquisition can be used as a mask that is subtracted from the delayed blood pool phase, the latter containing both arteries and veins (AV) (64). MIP reconstructions of the subtraction result, AV – A, resemble conventional venography images (64) (Fig. 24-22).
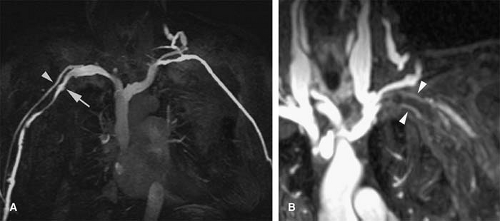 Figure 24-23 Direct MRV. A: MIP reconstruction of a 3D fat-saturated T1-weighted gradient echo acquisition during the simultaneous administration of diluted gadolinium (1:20) through distal veins of both arms shows the normal right cephalic (white arrowhead) and subclavian (white arrow) veins. A single vessel is seen on the left, which corresponds to a mildly enlarged cephalic vein. Similar to conventional venography, patent veins are readily seen with direct venography, while thrombosed veins are not seen. B: Thick-slab MIP reconstruction of a 3D fat-saturated T1-weighted gradient echo acquisition obtained during the delayed venous phase after (A) coned in on the proximal left subclavian vein. There is occlusive thrombus (white arrowheads) in the left subclavian vein. Note the enhancement of its wall, indicating subacute (likely less than 2 weeks) thrombosis. Direct MRV can be followed by delayed acquisition indirect venography, which allows for exquisite visualization of thrombosed vessels. |
Three-dimensional T1-weighted gradient echo sequences provide accurate reconstructions in any plane, facilitating the evaluation of tortuous veins and veins that are oriented parallel to the acquisition plane.
Direct Venography
Direct gadolinium-enhanced MRV (67) uses a very low concentration of gadolinium chelate to avoid first-pass susceptibility effects that can obscure key information. Diluted gadolinium contrast media (3 cc in 60 cc of saline for a 1:20 solution) is injected directly through peripheral intravenous access in the affected extremity. Bilateral intravenous access may be needed in both upper extremities for the assessment of the SVC in order to minimize mixing artifacts from nonopacified blood entering the SVC from the contralateral extremity. A tourniquet in the lower extremities helps to prevent enhancement of the superficial venous system (67).
A 3D fat-saturated T1-weighted gradient echo sequence as described earlier is used when direct MRV is performed during the administration of the contrast media. The acquisition can be started 7 to 10 seconds after the initiation of contrast media delivery. Multiple acquisitions may be obtained over time to improve visualization of small veins and veins with slow flow enhancing in a delayed fashion.
This technique improves visualization of patent veins compared with indirect MR techniques. In addition, lack of arterial enhancement facilitates the interpretation of these examinations as well as multiplanar and volumetric reconstructions (i.e., MIP, volume rendering [VR]). The diagnosis of venous thrombosis is made based on the nonvisualization of a particular venous segment. However, similar to conventional venography, early acquisitions during the administration of contrast may fail to demonstrate venous pathology or can be difficult to interpret. Delayed imaging after the direct MR examination is completed may yield images similar to those of the indirect MR technique. These are useful for the visualization of venous pathology, including occluded veins (Fig. 24-23).
Thrombus Staging
The ability to accurately age a thrombus (thrombus staging) has implications for patient management. Patients presenting within 3 days, 1 to 2 weeks, and 3 to 4 weeks after the first appearance of the symptoms have complete or partial resolution of the thrombotic occlusion after fibrinolytic therapy in approximately 95%, 82%, and 69% of the cases, respectively (68). Conversely, patients with clinical symptoms for 5 to 8 weeks prior to initiating this therapy have a
low incidence of recanalization (68). Furthermore, the onset of clinical symptoms can be insidious or misinterpreted as secondary to other diseases or conditions, causing a delay in diagnosis. Thus, the decision to proceed with fibrinolytic therapy can be controversial and would ideally be based on a capacity to identify and date a thrombus.
low incidence of recanalization (68). Furthermore, the onset of clinical symptoms can be insidious or misinterpreted as secondary to other diseases or conditions, causing a delay in diagnosis. Thus, the decision to proceed with fibrinolytic therapy can be controversial and would ideally be based on a capacity to identify and date a thrombus.
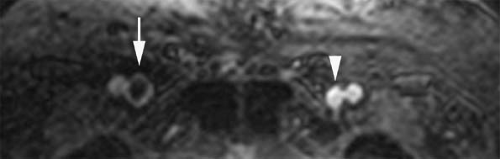 Figure 24-24 MRV of acute deep vein thrombosis. Axial reconstruction from a coronal 3D fat-saturated T1-weighted gradient echo acquisition during the delayed venous phase in a patient with right lower extremity swelling. There is expansion of the right common femoral vein (white arrow) compared with the left (white arrowhead). A centrally located intraluminal filling defect and wall enhancement are also present, indicating acute thrombosis. |
Acute venous thrombosis typically presents as a centrally located filling defect that causes expansion of the affected vein (69) (Fig. 24-24). The thrombus can be completely or partially occlusive. In vivo, acute venous thrombosis is associated with an inflammatory response within the vein wall and perivenous tissues apparently mediated by proinflammatory cytokines and adhesion molecules (69). A vein that is chronically occluded will decrease in caliber (45). Not uncommonly, chronically occluded veins are undetectable by imaging studies as they become a thin fibrotic remnant.
Collateral vessels are a secondary sign that is also indicative of subacute to chronic occlusion (Fig. 24-25). Over time, the thrombus will reorganize. Recanalization occurs from the center of the thrombus out to the periphery, and flow will initially be re-established through the center of the thrombus. With organization, the remaining thrombus is adherent to the periphery of the vessel wall. Chronically thrombosed veins will not change caliber with a physiologic maneuver such as a Valsalva maneuver.
US examinations can suggest the age of the thrombus based on its echogenicity and location within the lumen. An increase in echogenicity is expected as organization of the venous thrombus occurs, although this can vary among patients (70). US elastography has been proposed as a valuable tool to stage venous thrombi based on the fact that thrombus elasticity decreases with age due to the organization process (71).
With CT, venous thrombosis is diagnosed when a complete, partial, or juxtamural filling defect representing a clot is seen in an opacified vein. Indirect signs can include perivenous soft tissue infiltration suggestive of edema and dense mural enhancement (72). The accuracy of CT in distinguishing between acute and chronic thrombus is not known. Acute thrombus can be identified on a noncontrast CT as a hyperdense mass within the lumen of a vein. Chronic thrombus may be calcified; other features include clot recanalization, small unopacified retracted veins, and multiple venous collaterals (73).
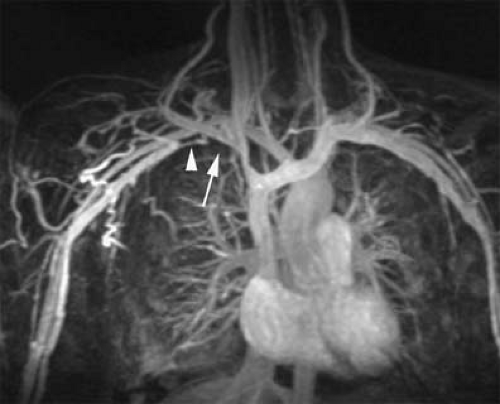 Figure 24-25 Chronic thrombosis. MIP reconstruction from a coronal subtracted (delay phase minus precontrast) 3D fat-saturated T1-weighted gradient echo acquisition in a patient with Hodgkin disease and right arm swelling. There is complete thrombosis of the right subclavian vein (white arrow) just before the anastomosis with the internal jugular vein. A thin sliver of central enhancement (white arrowhead) is identified in the more distal subclavian vein, indicating partial recanalization. Note the extensive collateral vessels in the right upper chest/back compared with the asymptomatic left side. |
MR imaging can provide valuable information regarding the age of the venous thrombus, but appearances can vary with the imaging strategy.
The MR appearance of arterial thrombus relative to its age has been described in a swine model (36). The signal characteristics of arterial thrombi as well as the changes detected over time are associated with different oxygenation states of the hemoglobin, changes in intracellular and matrix content of proteins, and the hydration of the cellular components (36).
Oxyhemoglobin, a diamagnetic compound present within acute thrombus (a few hours after induction), does not cause shortening of the T1 or T2 relaxation times. This may explain the intermediate signal intensity on T1 and increased signal intensity on T2 of acute thrombus (36).
One week after thrombus induction, an increase in signal intensity on T1- and T2-weighted images was noted within thrombi. The presence of methemoglobin with short T1 relaxation time is responsible for the increased signal intensity on T1-weighted images (36). Increased signal intensity on T2-weighted images is due to increased water content of lysed red blood cells (36).
The relative increase in signal intensity was significantly higher on T2-weighted images than that on the T1-weighted images, and the strongest statistical significance occurred during the first 3 weeks. The signal intensity decreased in chronic thrombus (6 weeks after induction), demonstrating intermediate signal intensity both on T1- and T2-weighted images (36).
In vitro relaxation time measurements of venous thrombus show marked reduction in T1- and T2-weighted images during the acute phase, which can help in differentiating clot from stagnant flow (74). As the clot ages, there is further shortening of its T1 and, to a lesser extent, of its T2 (74). However, the in vitro assessment may not apply to the behavior in the more complex and dynamic conditions found in vivo.
When clot organization occurs, usually 5 days after induction, it incorporates to the vessel wall and thus makes its visualization challenging (74). An organized clot may be visible only as an area of wall thickening with no difference in signal intensity than that of the vessel wall (74). The appearance of thrombus within a vein changes over time.
Partially occlusive thrombus is visible as a filling defect surrounded by flow at the periphery of the vein, which can be visualized on TOF imaging as well as on T1 postcontrast GRE sequences as a peripheral rim of high signal intensity (45). Occlusive thrombus fills the vein lumen entirely, and no flow is present.
On MRI, the perivenous inflammatory response seen with acute venous thrombosis is characterized by increased signal intensity on T2-weighted images within the vein wall and perivenous tissues, presumably due to edema (45). Signal intensity of the actual acute thrombus material on T1 GRE or SE sequences is usually isointense to the vein wall; partial or complete loss of the normal intraluminal flow void may also be appreciated.
Signal intensity of venous thrombi increases over time (75) (Fig. 24-26). In addition, acute thrombosis is associated with enhancement of the vessel wall on gadolinium-enhanced T1-weighted images (69). Wall enhancement occurs at the level of adhesion of the thrombus to the vein wall (69) (Fig. 24-27).
Increased signal intensity in the surrounding tissues can be explained by extravasation of gadolinium from the vessel wall in areas of capillary leak caused by the strong inflammatory response initiated by acute deep vein thrombosis (45,69). Increased signal intensity decreases over time as the thrombus is incorporated into the vein wall and inflammation resolves, usually over the course of 14 days (69). This decrease in signal intensity over time could be used to chronologically differentiate acute from subacute thrombosis.
Signal intensity of the subacute to chronic thrombus is variable, with the thrombus usually appearing heterogeneous on most sequences. Subacute thrombus can appear as high signal intensity on T1 GRE sequences, TOF sequences (50), and true FISP sequences (35) (Fig. 24-28). With SSFP imaging, the bright signal of clot can blend with the bright signal of the blood pool and may go undetected (35).
With CE T1 GRE sequences, reorganized thrombus can appear as zones of increased signal intensity in the periphery of the vein (69). Chronic thrombus usually demonstrates very low signal intensity on T1- and T2-weighted sequences.
Thrombus Characterization
An important consideration in clinical practice is differentiation of bland versus tumor thrombus. While bland thrombus is typically treated with anticoagulation or fibrinolytic therapy, tumor thrombus should be managed in the context of the primary neoplasm.
Bland Thrombus
The term bland thrombus is generally applied to any filling defect within a vessel that is not comprised of malignant cells. The key finding for bland thrombus on an imaging examination is the lack of enhancement after administration of contrast.
Given that CT is routinely performed after contrast administration, determination of thrombus enhancement
may require that the patient returns for imaging without contrast. In that scenario, it is important to use the same scanner and to keep all other parameters constant. Theoretically, delayed images obtained following contrast administration might show de-enhancement, as has been seen in renal masses (76) to facilitate characterization. However, to the best of the authors’ knowledge, this approach has not been validated for thrombus.
may require that the patient returns for imaging without contrast. In that scenario, it is important to use the same scanner and to keep all other parameters constant. Theoretically, delayed images obtained following contrast administration might show de-enhancement, as has been seen in renal masses (76) to facilitate characterization. However, to the best of the authors’ knowledge, this approach has not been validated for thrombus.
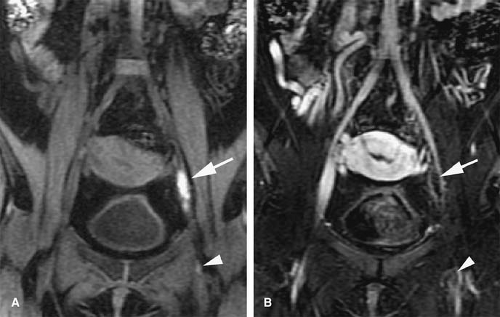 Figure 24-26 Bright thrombus on T1-weighted imaging. A: Unenhanced coronal 3D fat-saturated T1-weighted gradient echo in a patient with a previous history of left lower extremity DVT shows an ovoid area of high signal within the left external iliac vein (white arrow), indicating subacute thrombus. A smaller focus of high signal (white arrowhead) is identified more distally in the left common femoral vein. B: Coronal subtracted (contrast enhanced during the delayed venous phase minus the unenhanced phase) confirms the presence of venous thrombus in the external iliac (white arrow) and common femoral (white arrowhead) veins as nonenhancing filling defects corresponding to the areas of high signal intensity on (A). |
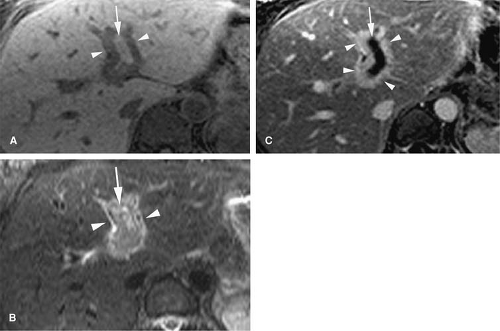 Figure 24-27 Venous wall edema and enhancement in acute deep vein thrombosis in a 48-year-old male with abdominal pain. A: Axial unenhanced 3D fat-saturated T1-weighted gradient echo image through the level of the left portal vein shows a tubular area of high signal intensity (white arrow) representing thrombus in the left portal vein, surrounded by low signal intensity (white arrowheads). B: Axial STIR gradient echo image through the same level as (A) shows heterogeneous hyperintense thrombus (white arrow) in the left portal vein surrounded by high signal intensity edema (white arrowheads), which corresponds to the area of low signal intensity on (A). C: Subtraction (portal venous phase minus precontrast) 3D fat-saturated T1-weighted gradient echo image shows avid enhancement of the left portal vein wall (white arrowheads). Nonenhancing thrombus within the left portal vein (white arrow) is now more apparent. |
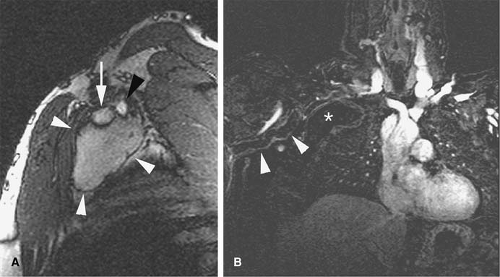 Figure 24-28 Bright thrombus on true FISP imaging in a 53-year-old man with right upper extremity edema. A: Sagittal FISP image through the right subclavian vessels shows the right subclavian vein (white arrow) and artery (black arrowhead). Just beneath these vessels is a mass (white arrowheads), which demonstrated signal intensity similar to that of fat on all sequences (not shown) and represented a lipoma. The signal in the subclavian vein is slightly less but very similar to that in the artery. Subacute thrombus can demonstrate intermediate to high signal intensity on FISP images and thus may be missed. B: Curved reconstruction along the right subclavian vein from a coronal subtracted (delay phase minus precontrast) 3D fat-saturated T1-weighted gradient echo acquisition in the same patient shows no enhancement of the mass (*). Extensive nonenhancing filling defect in the right subclavian vein (white arrowheads) is present, indicating complete thrombosis. |
On MR, the presence or absence of thrombus contrast enhancement can be readily assessed by using subtraction techniques (post–pre-contrast) in cooperative patients when anatomic co-registration is satisfactory. Bland thrombus typically appears as a black intraluminal filling defect on subtraction imaging during the delay venous phase (Fig. 24-29). In less cooperative patients, measurement of signal intensity in the thrombi with ROIs before and after gadolinium administration should be pursued.
Tumor Thrombus
Determination of tumor thrombus can impact both an indication for surgery and the surgical approach. Tumor thrombus, compared with bland thrombus, is composed of a cohesive mass of malignant cells that have invaded the blood vessel. Tumor thrombus must have a vascular supply to support the neoplastic tissue. Demonstration of thrombus enhancement after contrast administration is the most valuable finding to predict tumor thrombus. However, intense enhancement has been described in chronic organized bland thrombus within the heart 10 to 20 minutes after administration of gadolinium (77).
Occasionally, benign neoplastic thrombus can be seen, and, therefore, tumor thrombus is not always equivalent to malignant thrombus. Benign intravascular tumors including spindle cell tumors, lipomas, and intravascular papillary endothelial hyperplasia (Masson tumor) can be seen as enhancing intraluminal filling defects on MRI. Most frequently, however, enhancing intraluminal masses represent local venous invasion of malignant neoplasms (e.g., hepatocellular carcinoma, renal cell carcinoma [RCC]); less frequently, primary venous sarcomas are responsible for the presence of enhancing intravenous masses.
Differentiation of benign from malignant portal vein thrombosis in patients with cirrhosis has been described
using US (78) and CT (79). Doppler US can identify vascularity within the thrombus, although it can suffer from limited visualization of deep central veins within the chest and abdomen, particularly in patients with a large body habitus. Determination of subtle thrombus enhancement on CT can be difficult. Furthermore, pseudoenhancement related to beam hardening after contrast administration can mimic thrombus enhancement.
using US (78) and CT (79). Doppler US can identify vascularity within the thrombus, although it can suffer from limited visualization of deep central veins within the chest and abdomen, particularly in patients with a large body habitus. Determination of subtle thrombus enhancement on CT can be difficult. Furthermore, pseudoenhancement related to beam hardening after contrast administration can mimic thrombus enhancement.
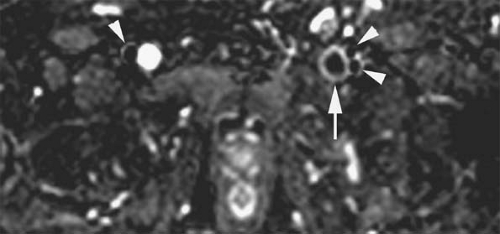 Figure 24-29 Bland thrombus in a 51-year-old male with a history of extragonadal germ cell tumor and renal cell carcinoma, now presenting with left lower extremity edema. Axial reformatted subtraction (delay phase minus arterial phase) 3D fat-saturated T1-weighted gradient echo image shows expansion of the left common femoral vein, which contains a central thrombus (white arrow). Note the difference in caliber of the left common femoral vein compared with the right. Also note signal void in the common femoral artery on the right (white arrowhead) as well as the superficial and deep femoral arteries on the left (white arrowheads) on this subtracted image (acquired by subtracting the arterial phase from the venous phase). |
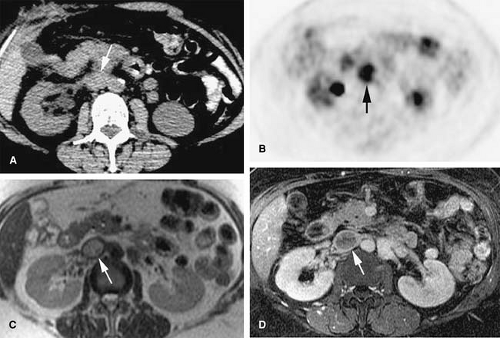 Figure 24-30 IVC tumor thrombus from metastatic colonic adenocarcinoma in a 57-year-old female. A: Axial noncontrast CT image from a CT/PET examination at the level of the lower pole of the left kidney shows expansion of the IVC (white arrow). B: Axial reconstructed PET image with CT attenuation correction from the same fluorodeoxyglucose (FDG)-PET scan as that in (A) at a similar level shows avid focal FDG uptake in the IVC (black arrow), which is well above that of blood pool in the adjacent aorta, indicating tumor in the IVC. C: Axial HASTE image through the same level as (A) also demonstrates expansion of the IVC (white arrow), with heterogeneous hyperintense thrombus in its lumen. Note the loss of the normal flow void in the IVC compared with the normal flow void in the adjacent aorta. D: Axial subtraction (venous phase minus precontrast) 3D fat-saturated T1-weighted gradient echo image through the same level as (C) confirms enhancement within the thrombus (white arrow), indicating tumor thrombus. The circumferential rim of high signal could indicate either enhancement of the IVC wall or blood flowing around the tumor thrombus. |
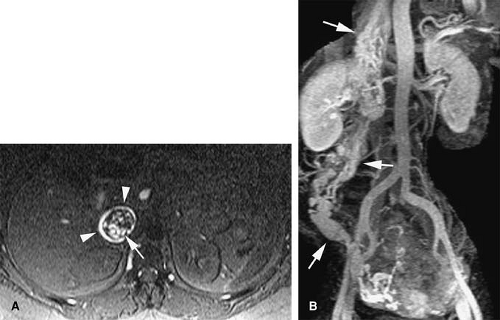 Figure 24-31 TOF imaging of invasive leiomyomatosis. A: Axial TOF image with a saturation band above the imaging slice in a patient with bilateral lower extremity edema shows expansion of the intrahepatic segment of the IVC, which contains a heterogeneous filling defect (white arrow). Flow-related signal surrounds the filling defect nearly circumferentially (white arrowheads). Note the presence of flow-related signal within the thrombus itself, indicating vascular flow within the tumor thrombus. B: Coronal MIP reconstruction from a subtracted (arterial minus precontrast phase) 3D fat-saturated T1-weighted gradient echo sequence shows extensive vascularization (arrows) extending from the pelvis to the right gonadal vein and IVC, which represents dilated blood vessels within invasive leiomyomatosis. |
The excellent inherent soft tissue contrast and sensitivity for detection of small amounts of gadolinium suits MR as a robust imaging technique for thrombus characterization (Fig. 24-30). It is important to realize, however, that the demonstration of enhancement may be elusive in rare cases with extremely hypovascular neoplasms.
Although variable, signal intensity of tumor thrombus is frequently increased on T2-weighted images and can be similar to the primary neoplasm. Caution must be exercised in diagnosing tumor thrombus on noncontrast MRV sequences. Slow venous flow can demonstrate increased signal intensity on T2-weighted SE and FSE images, which can mimic venous thrombi (80).
Similarly, turbulent flow and/or pulsatile flow can cause intraluminal filling defects, which can be misinterpreted as venous thrombi on flow-dependent MR strategies (e.g., TOF imaging). This is especially true at the confluence of veins with rapid flow (e.g., confluence of renal veins and IVC or jugular veins with subclavian veins) and at locations where veins change dramatically in orientation (e.g., common femoral to external iliac veins). Although noncontrast MRV cannot discriminate accurately between bland and tumor thrombus based on its signal characteristics, flow within thrombus can be detected occasionally with these techniques (Fig. 24-31). The location and context of the filling defect, such as in the portal vein or hepatic veins in the presence of a hepatic mass or within the renal vein in the presence of a renal mass, can suggest the diagnosis.
Bland and tumor thrombus can coexist in the same patient. Bland thrombus can develop secondary to slow flow caused by occlusive tumor thrombus and, therefore, is frequently located “upstream” to the tumor thrombus. On subtracted 3D T1 GRE postcontrast images, bland thrombus
is visualized as a homogeneous nonenhancing (black) filling defect immediately adjacent to the enhancing (variable intermediate-to-bright signal intensity) tumor thrombus (Fig. 24-32).
is visualized as a homogeneous nonenhancing (black) filling defect immediately adjacent to the enhancing (variable intermediate-to-bright signal intensity) tumor thrombus (Fig. 24-32).
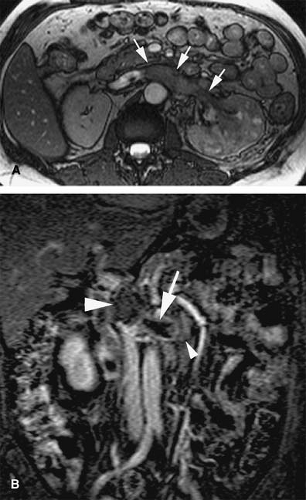 Figure 24-32 Renal mass with both bland and tumor thrombus as shown in MR images of a patient presenting for staging. A: Axial true FISP image through the left renal vein shows diffuse heterogeneous signal intensity in the left kidney, representing the patient’s known infiltrating mass. There is expansion of the left renal vein (white arrows), which contains intermediate signal intensity. Note normal high blood pool signal intensity in the IVC and aorta. B: Coronal subtracted (venous phase minus precontrast) 3D fat-saturated T1-weighted gradient echo image shows expansion of the left renal vein, which contains a heterogeneous enhancing filling defect (small white arrowhead) consistent with tumor thrombus. The distal left renal vein just proximal to its confluence with the IVC is filled by a nonenhancing thrombus (white arrow). A rhomboid area of low signal intensity in the IVC (large white arrowhead) represents an IVC filter. At surgery and pathology, tumor thrombus was found in the left renal vein extending from the left kidney to the level of the IVC filter. The presence of enhancement in the thrombus allows for accurate characterization as tumor thrombus, while lack of enhancement does not exclude tumor thrombus. |
Clinical Applications
Jugular Veins
Evaluation of the jugular veins is usually part of a comprehensive evaluation of the central veins in the neck and chest. This is frequently performed in the context of patients with a prior history of indwelling catheters before repeated central venous catheterization is attempted. Patients with malignancies are at risk for jugular vein thrombosis as well (81). Evaluation of jugular venous outflow is also essential in evaluating intracranial venous patency in diseases such as cerebral sinus thrombosis. The craniocaudad direction and relatively straight course of the jugular veins is favorable for TOF MRI. However, intraluminal filling defects related to turbulent flow are not uncommon. CE MRV is usually performed because it provides not only excellent evaluation of the jugular veins but also an outstanding assessment of the rest of the central veins in the chest, including collateral circulation (Figs. 24-25, 24-39, 24-41).
The appearance of jugular vein occlusion varies from a distended vessel with a centrally located filling defect (acute/subacute thrombosis) (Fig. 24-33) to nonvisualization of the vessel (chronic occlusion). Jugular vein wall edema as well as edema in the adjacent soft tissues of the neck is common in acute thrombosis. The presence of collateral veins suggests chronic thrombosis to some degree. Central venous catheters can be visualized as linear filling defect within the patent vein. Visualization of the catheter within the thrombosed segment of the vein or in chronically occluded nonvisualized vessels is virtually impossible.
Extrinsic compression of the jugular veins can be seen secondary to enlarged lymph nodes (e.g., lymphoma). Head and neck squamous cell neoplasms often cause vascular compromise. Tumors that arise in the parotid or submandibular glands can also cause jugular occlusion from direct spread. Jugular vein thrombosis can present as a soft tissue mass in patients with malignancies (82). Neck irradiation can cause narrowing and occlusion of the jugular veins.
Traumatic injury and subsequent thrombosis of the jugular vein can occur. While arterial injuries are the main concern in the presence of a seat belt sign in the neck after motor vehicle accidents (83), internal jugular vein thrombosis may also occur (Fig. 24-34). Bilateral traumatic internal jugular vein thrombosis may occur after trauma and can cause significant elevation of the intracranial pressure (84). Penetrating trauma to the neck may result in arteriovenous fistulas (AVFs) between the carotid and jugular venous system (Fig. 24-35).
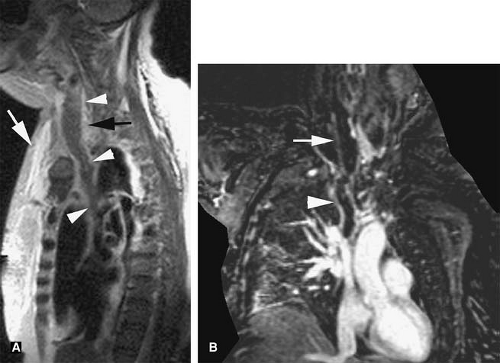 Figure 24-33 Acute internal jugular venous thrombosis. A: Sagittal HASTE image through the right neck and chest shows loss of the normal flow void within the right internal jugular and right brachiocephalic veins (white arrowheads), which are expanded and filled with intermediate signal intensity material, indicating thrombus. Note the increased signal intensity in the wall of the internal jugular vein (black arrow) and subcutaneous tissues (white arrow), indicating edema. B: Curved coronal reconstruction from a subtracted (delayed postcontrast minus precontrast) 3D fat-saturated T1-weighted gradient echo acquisition confirms the presence of thrombus as a nonenhancing filling defect expanding the right internal jugular vein (white arrow) and brachiocephalic vein (white arrowhead). |
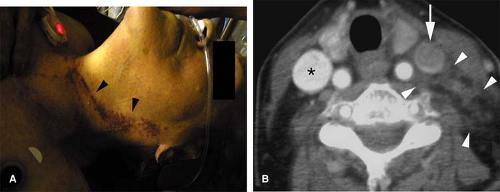 Figure 24-34 Traumatic internal jugular thrombosis due to seat belt injury. A: Photograph of a patient with traumatic thrombosis of the left internal jugular vein after a motor vehicle accident. A linear bandlike area of ecchymosis is present over the left lateral aspect of the neck (black arrowheads) in the expected distribution of the shoulder portion of a seat belt. B: Axial CE CT scan through the neck shows extensive fat stranding in the lateral left neck (white arrowheads). Normal enhancement is seen in the right internal jugular vein (*). A filling defect of intermediate density is present in the left internal jugular vein (white arrow), indicating an acute thrombus. A crescentic area of increased density surrounds the filling defect, indicating flow around the acute thrombus. Findings are consistent with acute internal jugular vein thrombosis secondary to seat belt injury. |
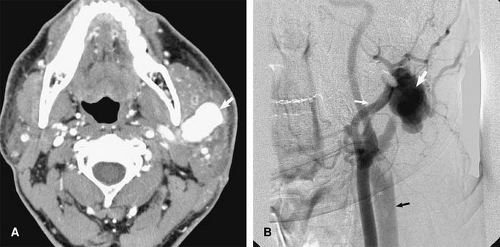 Figure 24-35 Traumatic arteriovenous fistula (AVF) from gunshot wound. A: CE CT in a patient with a gunshot wound to the left neck shows a large collection (white arrow) that enhances to the same degree as the arteries in the same image, which is consistent with a pseudoaneurysm. B: Selective catheter angiogram in the left common carotid artery confirms the presence of a lobulated pseudoaneurysm (large white arrow), which is fed by the internal maxillary (small white arrow). Early venous return in an enlarged internal jugular vein (black arrow) is diagnostic of an AVF. |
Retropharyngeal infection that spreads into the carotid space can also cause septic thrombophlebitis in the jugular veins (85). Lemierre syndrome or postanginal septicemia (necrobacillosis) is caused by an acute oropharyngeal infection with secondary septic thrombophlebitis of the internal jugular vein (86). Fusobacterium species, micro-organisms normally present in the oral cavity, are responsible for most cases of this condition.
The infected jugular vein can serve as a source for distant metastatic emboli. In the preantibiotic era, this condition often had a fulminant course with a mortality rate of 90% (87). While oropharyngeal infections are the primary site of infection in most cases, the interval between this infection and the presence of septicemia can be as long as 1 week (86). For this reason, the clinical symptoms related to the oropharyngeal infection are not infrequently cleared at the time the patient develops symptoms related to septicemia. Therefore, this condition can be confused with other conditions, including bacterial endocarditis with septic emboli or poststreptococcal glomerulonephritis (86). However, in Lemierre syndrome (Fig. 24-36), a sore throat is still the most common symptom during the primary infection (88).
The lungs are the most common location of metastatic infection and are involved in approximately 82% to 95% of cases (87,88). The classic radiologic appearance of the pulmonary involvement is similar to that of other septic emboli with multiple peripheral, round, and wedge-shaped opacities that progress rapidly to cavitation. However, cavitation may not be obvious at the time of the initial presentation and is not specific for septic emboli (87). MRI can demonstrate extensive edema in the soft tissues of the neck with associated jugular vein thrombosis. Intense vein enhancement is seen and occasionally, enhancing cavitated lesions secondary to pulmonary septic emboli can be demonstrated.
Upper Extremities
Evaluation of patients with suspected venous pathology in the upper extremities requires not only an accurate depiction of pathology within the veins of the affected extremity but also a comprehensive assessment of the central veins in the chest (subclavian and brachycephalic veins and SVC).
CTV is best performed with indirect technique by using a single bolus of contrast, a section thickness of not greater than 2.0 mm and a delay of approximately 60 seconds after arrival of contrast medium in the aortic arch. Chapter 22 provides further details.
Due to the complex 3D anatomy of the upper extremity and central veins in the chest, TOF and other flow-sensitive techniques are not ideal for the MR evaluation of these vessels. With TOF, multiple acquisitions in different planes are required for complete assessment of these vessels to avoid in-plane saturation effects. For example, the SVC is
best imaged on straight axial images, while the brachiocephalic and subclavian veins are best assessed in the sagittal plane. Distally toward the axillary and brachial veins, oblique axial or even straight axial images are needed to acquire the images perpendicular to these vessels. The overall acquisition time for a complete evaluation of the chest and upper extremity veins by using TOF imaging is impractical in clinical practice, and it should be reserved only for those patients in whom gadolinium or iodinated contrast administration is not possible.
best imaged on straight axial images, while the brachiocephalic and subclavian veins are best assessed in the sagittal plane. Distally toward the axillary and brachial veins, oblique axial or even straight axial images are needed to acquire the images perpendicular to these vessels. The overall acquisition time for a complete evaluation of the chest and upper extremity veins by using TOF imaging is impractical in clinical practice, and it should be reserved only for those patients in whom gadolinium or iodinated contrast administration is not possible.
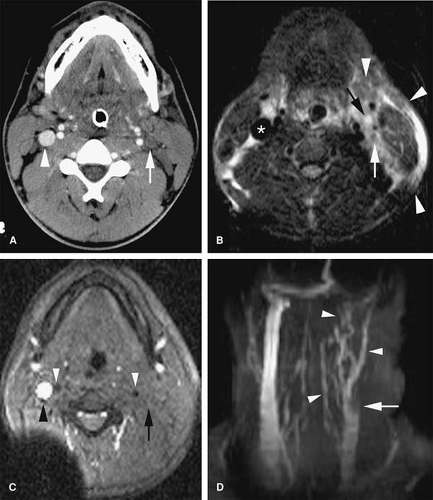 Figure 24-36 Lemierre syndrome in an 18-year-old male with sepsis, neck pain, and difficulty breathing 6 days after dental procedure. A: Axial CE CT scan shows no enhancement in the left internal jugular vein (white arrow) compared with the normal enhancing right internal jugular vein (white arrowhead). Multiple lymph nodes are identified in the left neck. B: Axial STIR image in the same patient reveals extensive edema surrounding the left sternocleidomastoid muscle (white arrowheads). A flow void is present in the patent right internal jugular vein (*). Intermediate signal intensity thrombus (white arrow) fills the left internal jugular vein. Central increased signal intensity within an adjacent lymph node (black arrow) is consistent with necrosis. C: Axial TOF with an inferior saturation band shows no flow-related signal within the left internal jugular vein (black arrow). Normal flow signal is present in the right internal jugular vein (black arrowhead). Note the signal void in the internal carotid arteries (white arrowheads) bilaterally due to the use of a superior saturation band. D: Coronal MIP reconstruction from the same TOF imaging acquisition as (C) better illustrates lack of flow-related signal in the distal left internal jugular vein. A meniscus-shaped filling defect (white arrow) in the mid left internal jugular is consistent with thrombus. Multiple collateral vessels (white arrowheads) are present. |
A rapid determination of patency in the major veins of the chest can be achieved with sparsely sampled TOF MRI. This is a useful initial evaluation pre-empting a premature termination of the study by the patient or when intravenous access is compromised. In the thorax, the authors acquire three to five TOF slices in a sagittal orientation, which allow for a rapid assessment of brachiocephalic and subclavian vein patency. A saturation band medial to the imaging slice can be used to selectively saturate the inflowing spins within the artery. Similarly, a limited number of slices in the axial plane provided a rapid assessment of the patency of the SVC. This approach does not exclude the presence of nonocclusive thrombus but allows for rapid determination of patency in the major veins of the chest.
A comprehensive evaluation of the entire chest and proximal upper extremities is best accomplished by using a 3D T1-weighted gradient echo sequence in a single breath hold. A properly timed 3D examination during the bolus of gadolinium provides images during the arterial and venous phases. Multiplanar and MIP reconstructions provide accurate delineation of the anatomy and permit interrogation of the veins of interest in different orthogonal planes, facilitating the detection of intraluminal filling defects.
Thrombosis in the upper extremity can be either primary or secondary. Primary thrombosis of the subclavian and/or axillary veins is called effort thrombosis or Paget–von Schrötter syndrome. However, secondary thrombosis is much more common with the current frequent use of central lines.
Effort thrombosis describes spontaneous thrombosis of the upper extremity after repetitive motion/exercise, usually in the dominant upper extremity (89,90). This entity is most common in young males and is associated with pulmonary embolism in up to 30% of cases (91). There is an anatomic predisposition in 75% of cases including cervical ribs, exostoses, fibrous bands, muscular hypertrophy (anterior scalene/subclavius muscles) (90). MRI allows for the diagnosis of venous thrombosis and identification of the associated anatomic predisposition (92) (Fig. 24-37).
Thoracic outlet syndrome is a controversial entity in which the symptoms depend on the particular anatomic structure that is compressed in the area of the thoracic outlet (93). The relevant structures include the subclavian artery and vein, brachial plexus, and sympathetic nerves. Occasionally, multiple symptoms may result from compression of a combination of these anatomic structures. Symptoms are most commonly caused by either neurologic or arterial impingement. Pain, numbness and tingling, or heaviness in the effected limb are common complaints. Subclavian artery occlusion, stenosis, and aneurysm formation may occur with or without peripheral emboli (93). Symptoms can develop due to venous compression and/or occlusion, including edema, cyanosis, fatigability, heaviness, and thrombosis (94). Further details, along with the imaging findings, are described in Chapter 22.
Secondary thrombosis of the subclavian vein occurs in 33% to 60% of patients with central catheters and pacemakers and approximately 60% to 70% of patients with upper extremity DVT have central catheters (81,95). Patients with longer catheter dwell time were more likely to develop central vein abnormalities (96). Other causes include trauma, tumors, intravenous drug abuse (IVDA), infection, and hypercoagulable states (97,98). Subclavian vein thrombosis is clinically evident in only 3% of cases. There is associated pulmonary embolism in 36% of cases (99).
Evaluation of the central veins in the chest may be warranted in patients with an edematous upper extremity with a normal Doppler evaluation. Doppler US is still the diagnostic modality of choice to evaluate the subclavian and more distal upper extremity veins, due to its availability and accuracy. However, the sonographic evaluation of the brachiocephalic veins and SVC is not possible with Doppler US. MRI offers excellent visualization of these vessels, and detection of thrombosis of the brachial veins and IVC with MR is comparable to conventional venography (100) (Fig. 24-38).
An evaluation of the upper extremity veins is often warranted in patients with malfunctioning hemodialysis grafts or fistulas and is described in detail in Chapter 22.
Central Vein Access
Patients with end-stage renal disease as well as oncologic/hematologic patients are good candidates for noninvasive vascular imaging of the central veins of the body, especially following multiple failed attempts of central venous catheterization. With increased 3D capabilities and thin-section imaging, effective venous mapping
can be performed prior to patients receiving chemotherapy, hyperalimentation, or hemodialysis (58


can be performed prior to patients receiving chemotherapy, hyperalimentation, or hemodialysis (58
Stay updated, free articles. Join our Telegram channel
Full access? Get Clinical Tree
