Upper Extremities Vasculature
Tim Leiner
Jeffrey C. Hellinger
Neil M. Rofsky
Spectrum and Prevalence of Diseases
Diagnostic evaluation of suspected upper extremity arterial occlusive disease occurs with less frequency compared to the lower extremity. It accounts for less than 5% of patients presenting with arterial ischemia of an extremity. The abundant collateral networks at the low cervical neck, shoulder, mid arm, elbow and wrist provide robust means to reconstitute distal flow. Furthermore, the upper extremity has less muscle mass and is used less vigorously, as compared to the lower extremity (1).
For these reasons, fewer individuals present with symptomatic disease of the upper versus lower extremity vasculature,
and as such, far fewer diagnostic procedures are performed. Another difference between upper and lower extremity vascular disease is highlighted by the fact that surgical and endovascular interventions occur with less frequency in patients presenting with upper extremity ischemia. Many have distal, small vessel disease that is not amenable to repair. In a common vascular practice, upper extremity arterial reconstructions represent only 4% of peripheral arterial reconstructions.
and as such, far fewer diagnostic procedures are performed. Another difference between upper and lower extremity vascular disease is highlighted by the fact that surgical and endovascular interventions occur with less frequency in patients presenting with upper extremity ischemia. Many have distal, small vessel disease that is not amenable to repair. In a common vascular practice, upper extremity arterial reconstructions represent only 4% of peripheral arterial reconstructions.
Despite the relative rarity of upper extremity arterial occlusive disease, diagnostic evaluation of the upper extremity vasculature is an important capability for a comprehensive cardiovascular imaging practice. Venous occlusive disease, trauma, hemodialysis access dysfunction, vascular masses, and vascular mapping are other indications for which computed tomographic angiography (CTA) and magnetic resonance imaging (MRI) and angiography (MRA) can play significant diagnostic roles.
With the diverse spectrum of upper extremity vascular disease, a thorough understanding of upper extremity vascular pathology, pathophysiology, and clinical presentation are paramount to implementing imaging strategies and yielding effective interpretations.
The most common cause of upper extremity large vessel arterial occlusive disease is atherosclerosis (2). Arterial occlusive disease of the upper extremity is often caused by nonatherosclerotic disorders such as autoimmune mediated inflammatory and connective tissue disease, trauma, radiation therapy, or thromboembolism.
Arm “claudication” is a typical presentation of most patients with upper extremity arterial disease. These patients typically have exertional pain and fatigue in the arm, forearm, and/or hand, which is relieved with rest. Patients may also present with symptoms from steal phenomena, with Raynaud’s phenomenon, with rest pain, or skin and tissue changes such as ulcerations or gangrene. Arterial disease is often associated with an underlying systemic disorder.
Patients with steal syndromes present with upper extremity weakness, dizziness, and sometimes angina. The most common upper extremity steal syndrome is “subclavian steal,” with retrograde flow in the vertebral artery to reconstitute the subclavian artery, secondary to ipsilateral proximal subclavian ostial or postostial high-grade stenosis or occlusion.
Another well-known steal phenomenon is coronary steal syndrome, which can be seen when coronary artery bypass grafting is performed with the internal thoracic artery (previously called the internal mammary artery). In the presence of an ipsilateral proximal subclavian artery stenosis or occlusion, flow may reverse in the internal thoracic artery to reconstitute the subclavian artery.
Raynaud’s phenomenon, a condition that involves the small- and medium-sized vessels, classically presents in the hand and forearm. It is defined by reversible arterial spasm, which causes a triphasic white-blue-red color response.
For all cases of suspected upper extremity arterial occlusive disease, a prompt and accurate diagnosis is imperative as there is the potential for substantial disability particularly when hand function is adversely affected (2). Gender, age, occupational history, presentation of symptoms, and physical exam are all important to this end (Table 22-1).
Atherosclerotic Arterial Occlusive Disease
The most common locations for upper extremity large vessel involvement include the brachiocephalic and subclavian arteries. However, atherosclerosis can also cause small vessel obstruction by atheromatous embolization or thromboembolism. Patients presenting with symptoms of upper extremity atherosclerotic disease tend to be older compared to those affected by nonatherosclerotic upper extremity arterial occlusive disease (3).
Other Causes of Arterial Disease
The list of nonatherosclerotic conditions affecting the upper extremity vasculature is broad and includes arteritis, compressive syndromes, traumatic injuries, nonatherosclerotic embolization, and a variety of conditions that result from complications of renal insufficiency and surgical interventions (e.g., dialysis access surgery).
The vasculitides can be readily conceptualized based on size of the vessel involved as will be described in the next section. Connective tissue diseases such as Marfan syndrome, Ehlers-Danlos syndrome, pseudoxanthoma elasticum, homocystinurea and neurofibromatosis are well known for their peripheral arterial involvement.
Vascular disease in azotemic patients may involve calciphylaxis, a poorly understood and highly morbid syndrome of vascular calcification and skin lesions (4,5,6,7), which can produce medial calcification (also known as Mönckeberg sclerosis) in small- and medium-sized arteries, visible on plain radiographs. These changes are typically found in patients with diabetes mellitus and end-stage renal disease (ESRD) or postrenal transplant. The presence of a distal peripheral pulse helps to distinguish acral calciphylaxis from occlusive disease.
Congenital and acquired clotting disorders may also manifest themselves with symptoms of peripheral arterial disease. Infrequent causes of peripheral arterial disease are fibromuscular dysplasia and primary vascular tumors.
Table 22-1 Conditions and Risks for Upper Extremity Arterial Disease | ||||||||||||||||||||||||||||||||||||||||||||||||||||||||||||||||||||||||||||
|---|---|---|---|---|---|---|---|---|---|---|---|---|---|---|---|---|---|---|---|---|---|---|---|---|---|---|---|---|---|---|---|---|---|---|---|---|---|---|---|---|---|---|---|---|---|---|---|---|---|---|---|---|---|---|---|---|---|---|---|---|---|---|---|---|---|---|---|---|---|---|---|---|---|---|---|---|
| ||||||||||||||||||||||||||||||||||||||||||||||||||||||||||||||||||||||||||||
Disease Classification Based on Vessel Size
Upper extremity vascular disease pathology can be divided based on large, medium, or small vessel involvement. Specific, often mutually exclusive entities can be found within these divisions, particularly when separating diseases that affect the large and small vessels.
Upper extremity large arterial occlusive disease is most often due to atherosclerosis. Claudication symptoms and steal syndromes commonly reflect large vessel involvement.
Nonatherosclerotic conditions that effect the large vessels include subclavian or axillary autoimmune arteritis (Takayasu or giant cell arteritis), thoracic outlet syndrome
with resultant intimal damage and subsequent aneurysm formation and distal embolization, radiation arteritis, and penetrating traumatic injury.
with resultant intimal damage and subsequent aneurysm formation and distal embolization, radiation arteritis, and penetrating traumatic injury.
Medium- and small-sized arteries and veins are typically involved in thromboangiitis obliterans (TAO), also known as Buerger’s or Winiwarter-Buerger disease. Patients with TAO are almost always young (<45 years old); use large amounts of tobacco products (usually, but not limited to, smoking); and characteristically show segmental occlusions in radial, ulnar, palmar, and digital arteries with typical bridging corkscrew collaterals (8).
There are numerous diseases primarily affecting the smaller arteries of the upper extremity (Table 22-1). With inflammatory arteritis, Raynaud’s phenomenon is common. Traumatic injury can also involve small and medium vessels. Occupational exposure can lead to vibration or impact-induced small vessel vasospasm in the hand, followed by intimal injury, aneurysm formation, thrombosis, occlusion, and/or distal embolization (Table 22-1). Blunt and penetrating hand trauma can lead to ischemia if the palmar arch is incomplete.
Global View of Unique Aspects and Considerations of Imaging This Organ System
The upper extremity vascular tree begins at the left ventricular outflow tract, includes the palmar arch and digital arteries, and ends at the entrance of the superior cava into the right atrium. A full upper extremity vascular study, therefore, demands imaging coverage in the order of 70 to 90 cm and also encompasses the inferior part of the cervical region to include the abdundant collateral pathways in patients with suspected arterial or venous occlusion. Both MRA and multidetector row CT (MDCT) are capable of imaging over a large field of view with high spatial resolution thereby enabling high-fidelity depiction of the upper extremity vasculature.
Occlusive arterial disease can be evaluated by clinical examination, segmental blood pressure measurements, pulse volume recordings, duplex ultrasonography, and intra-arterial digital subtraction angiography (IA DSA). There is also a firm role for cross-sectional imaging techniques such as MRI and MDCT to provide the necessary preinterventional information about location and severity of vascular disease as well as information about the surrounding tissues. Traditionally, IA DSA had always been reserved for this purpose. However, IA DSA is a procedure that utilizes ionizing radiation and carries a small but definable risk for local and systemic complications due to its invasive nature and the use of nephrotoxic contrast media (9).
Over the past years, MRA and MDCT have emerged as reliable tests for diagnosis and treatment planning. In providing an accurate “roadmap” of upper extremity vasculature to the referring clinician, these techniques aid in the triage of therapeutic options for patients and distinguish disease that is amenable to percutaneous transluminal angioplasty (PTA) from disease that is too diffuse, long-segmented, or complex and thus demands a more extensive interventional procedure or bypass grafting procedure.
At the other end of the clinical spectrum are patients with small vessel disease. Many of these patients suffer from systemic connective tissue disease. In patients with small vessel disease, the primary aim is to provide sufficient blood flow to relieve rest pain and heal skin lesions. This is primarily achieved by medical therapy and not with PTA or arterial reconstructive bypass surgery (2,10).
Noninvasive imaging of distal small vessel disease at the level of the digital arteries is still challenging due to the relatively limited spatial resolution of both MRA and MDCT compared with IA DSA. Continued progress in technology and technique predicts a progressive increased utilization of MRA and MDCT (Fig. 22-1).
The ability to locally administer pharmacological vasodilation by intra-arterial injection of vasodilating agents such as tolazoline represents an important difference between IA DSA and noninvasive imaging. For MRA and MDCT, some degree of vasodilation can be induced by wrapping the hand in warm towels or having the patient hold a warm pack during the examination.
As a practical consideration for any patient presenting with a nontraumatic acute arterial occlusion, a prompt search for atrial fibrillation, ulcerative endocarditis, and mural thrombi overlying the site of myocardial infarction is essential.
What Do Computed Tomography and Magnetic Resonance Bring over Other Imaging and Nonimaging Diagnostic Strategies?
The cornerstone of the diagnostic workup of patients with upper extremity arterial disease is a thorough physical examination and medical/surgical and occupational history, including any athletic activities in which the patient may be involved. Physical examination should encompass the entire vascular system and not only assessment of peripheral pulsations and local trophic changes. Consequently, one
should also search for evidence of systemic hypertension, cardiac murmurs, carotid and abdominal bruits, and signs of subclavian and peripheral arterial aneurysms.
should also search for evidence of systemic hypertension, cardiac murmurs, carotid and abdominal bruits, and signs of subclavian and peripheral arterial aneurysms.
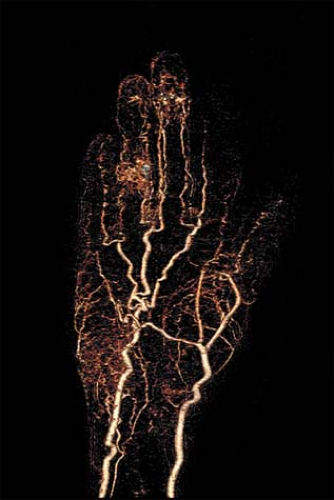 Figure 22-1 VR image from a temporally resolved frame of a dynamic CE MRA in a patient with vasospastic disease and degenerative joint changes. The vasculature is well depicted including many of the digital vessels, without the use of pharmacologic vasodilators. |
Table 22-2 Commonly Used Diagnostic Tests for Detection and Grading of Upper Extremity Peripheral Arterial Disease | ||||||||||||||||||
|---|---|---|---|---|---|---|---|---|---|---|---|---|---|---|---|---|---|---|
|
Additional tests can be divided into those aimed at a physiological assessment of the peripheral circulation and tests aimed to provide an anatomical road map of the peripheral vasculature, showing the exact location, extent, and severity of the disease process, in relation to commonly used anatomical landmarks during interventional radiological and surgical procedures. Table 22-2 shows an overview of these techniques.
One of the most commonly used noninvasive tests to gauge the extent and severity of peripheral arterial disease is color-aided duplex ultrasonography (DU). This test combines a local anatomical image, obtained in B-mode, with information about the direction, pattern, and magnitude of arterial and venous flow (obtained by Doppler frequency analysis) (11).
The severity of stenoses can be derived from peak systolic and end-diastolic velocity measurements, whereby higher peak systolic velocities indicate more severe stenoses (12). A major drawback of DU is the long duration of the examination and the operator dependency (13). It is generally accepted that characterization of location and degree of stenosis requires experienced vascular laboratories with rigorous quality controls.
Both MDCT and MRA provide highly detailed images of the peripheral vascular tree analogous to intra-arterial digital subtraction techniques. With truly three-dimensional (3D) data sets, reconstructions can be viewed from an infinite number of perspectives.
In contrast to conventional IA DSA, MDCT and MRA are not limited to depiction of the vascular lumen but also allow uncomplicated visualization of anatomic variants, the vessel wall, and the bony and soft tissues surrounding the vessels.
This capacity is especially important when considering that vascular workups are associated with inflammation, infection, and tumor. Particularly in the evaluation of vasculitides, mural and adjacent soft tissue features provide vital information regarding the status of the disease. Furthermore, the combined attributes of strong soft tissue contrast and the lack of ionizing radiation make MRI ideal for serial follow-up studies when monitoring response to treatment.
As with IA DSA, stress studies can be performed to assess the effect of a change in posture on the vasculature. Both MRA and MDCT are also well suited in the noninvasive follow-up of surgical intervention, including the assessment of the various arterial bypass grafts as well as hemodialysis access sites.
IA DSA has superior in-plane resolution, and based on this feature, it is considered by many as the imaging modality of choice for imaging small vessel disease of the digital arteries. However, the spatial resolution capability of MD CTA and MRA have shown steady improvements.
For example, with state-of-the-art 1.5T and 3.0T MRI imagers and dedicated upper extremity vascular coils, voxel sizes, on the order of 0.7 ÷ 0.7 mm in plane, on the order of 1.0 mm in the slice direction can be achieved during first arterial passage of contrast medium; with the use of the newest intra-vascular blood-pool contrast agents, this resolution can be improved to 0.4 to 0.5 mm in each direction, resulting in isotropic voxel sizes in the order of 64 to 125 microns.
With the newest MDCT scanners it is routinely possible to achieve isotropic spatial resolutions in the order of 0.4 to 0.5 mm. With such spatial resolution, an assessment of small vascular disease with MRA and CTA is becoming more feasible.
MRA offers physiologic information using phase contrast (PC) techniques. This information regarding flow and velocity offers useful adjuncts to the physiologic road map (14,15,16). MR spectroscopy can also provide information regarding muscle metabolism (17,18,19,20,21,22,23). Finally, MR and to a certain extent CT can also provide information about tissue perfusion. While the impact of the adjunctive tests awaits further research, such capacities will likely be important as targeted medical and angiogenic therapies emerge in clinical practice.
Imaging Strategies
Computed Tomographic Angiography
Upper Extremity Computed Tomographic Angiography Technique
Upper extremity computed tomographic angiography (UE CTA) can be performed on all currently available multidector-row CT scanners (4 to 64 channels) to evaluate a broad spectrum of clinical pathology. Based on the clinical indications, three core protocols are recommended: Aortic Arch with Upper Extremity Runoff, Upper Extremity Runoff, and Upper Extremity Indirect CT Venography (Table 22-3). For each protocol, there are several technical considerations. These include patient preparation, image acquisition, contrast medium administration, image display, and exam transfer and storage.
Patient Preparation
Patient preparation begins by removing all external metallic objects from the patient’s chest, neck, and the affected extremity. These objects can limit photon exposure and degrade image quality. The next step is to place an 18- to 22- gauge intravenous (IV) catheter in an upper extremity vein, contralateral to the side of interest. With an ipsilateral venous injection, high density contrast material and related streak artifact in the inflowing veins will render arterial and venous segments nondiagnostic.
As high flow rates are necessary, the antecubital location is the preferred access site. If this location is not possible, other options include the forearm or hand, with the likely need to decrease the contrast medium injection rate. When these secondary sites cannot be accessed, considerations include using a contralateral external jugular vein or a centrally placed venous catheter, which can accommodate power injection.
The final preparation is to position the patient on the CT gantry table. The goal is to isolate the upper extremity in the center of the table. In most cases, patients are positioned supine and head first. The affected extremity is extended above the patient’s head and placed isocenter in the gantry, with the palm positioned ventrally and the fingers spread apart (Fig. 22-2). The head is secured in a neutral position, and the contralateral arm is placed at the patient’s side.
Pillows, blankets, or both are utilized to support the patient’s body and also to raise the height of the upper
extremity so that it is at the same level as the mid axillary line. Tape can be used to secure positioning of the forearm and hand. To ensure that the extremity is as close to the gantry isocenter as possible, patients can either be rotated into a modified swimmer’s position or be placed prone (Fig. 22-3).
extremity so that it is at the same level as the mid axillary line. Tape can be used to secure positioning of the forearm and hand. To ensure that the extremity is as close to the gantry isocenter as possible, patients can either be rotated into a modified swimmer’s position or be placed prone (Fig. 22-3).
Table 22-3 Upper Extremity Computed Tomographic Angiography Protocols | ||||||||||||||||
|---|---|---|---|---|---|---|---|---|---|---|---|---|---|---|---|---|
|
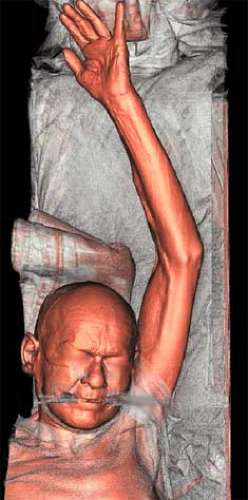 Figure 22-2 VR image demonstrates a patient positioned supine for a left upper extremity CTA. The left upper extremity is abducted and hyperextended above the patient’s head in the center of the CT gantry table. Bed sheets are folded to support the patient’s head and hand. Tape (not depicted) was also utilized to stabilize the forearm and hand. |
If the affected extremity cannot be raised above the patient’s head, the exam can be performed with the
extremity placed alongside the patient’s body, with the risk of increased noise and streak artifacts (Fig. 22-4). In this instance, the patient’s body should be shifted away from the affected extremity so that the upper extremity can be placed isocenter. To reduce noise in this position, the contralateral upper extremity should be raised out of the field of view. Bilateral exams are acquired by scanning both arms together (targeted runoff for forearm or hand coverage) or by scanning each arm individually (16 to 64 channel scanners).
extremity placed alongside the patient’s body, with the risk of increased noise and streak artifacts (Fig. 22-4). In this instance, the patient’s body should be shifted away from the affected extremity so that the upper extremity can be placed isocenter. To reduce noise in this position, the contralateral upper extremity should be raised out of the field of view. Bilateral exams are acquired by scanning both arms together (targeted runoff for forearm or hand coverage) or by scanning each arm individually (16 to 64 channel scanners).
 Figure 22-3 Bilateral upper extremity angiograms were simultaneously acquired through the patient’s forearms and hands. The patient was positioned prone with the forearms and hands as close as possible to the gantry isocenter. The patient’s head was supported with a “donut” cushion. Injection was via a right antecubital vein. |
 Figure 22-4 Right upper extremity 16-channel CTA was performed on a patient who sustained a gunshot injury to the right shoulder, shattering the humeral head. As the patient could not raise the arm, the right arm was placed at the patient’s side. Note how the axillary and proximal and mid brachial artery are of diagnostic quality, while the distal brachial artery and proximal radial and ulnar arteries show pseudo-lesions (arrow) from noise and spiral artifact (A). The study revealed a small traumatic right subclavian pseudoaneurysm (arrow in B) near retained bullet fragments. |
Functional UE CTA is performed for thoracic outlet syndrome with neutral and challenged CT angiographic acquisitions. In the neutral phase, the affected extremity is placed at the patient’s side. In the challenged phase, the arm is raised and the patient’s head is turned contralateral, duplicating a combination of Wright (upper extremity abduction with external rotation and the head and chin in neutral position) and Adson’s (upper extremity extension with lateral rotation and the head turned toward the affected extremity) provocative maneuvers.
Image Acquisition
Protocol Series
Upper extremity CT angiographic protocols can be programmed into the scanners with at least five acquisition series. The first series is a necessary low-dose scout topogram (Fig. 22-5). To prescribe precise coverage and field of view, both anterior-posterior and lateral views are recommended.
The second series is an optional nonenhanced acquisition with 1.25- to 5.0-mm thick images. Coverage may be identical to the planned contrast enhanced acquisition or may target a selected upper extremity region. The primary objective of the optional nonenhanced acquisition is to identify high-density material that may limit CT angiographic image quality and interpretation (i.e., streak artifact) or may be obscured by the contrast medium. These images are essential to confirming the presence and location of calcifications, endovascular stents and stent-grafts, surgical clips, surgical grafts, catheters, bone fragments (i.e., trauma), residual IV contrast, active bleeding, and hematomas.
The third series is a low-dose timing acquisition, which is essential for precise synchronization of the image acquisition with either arterial or venous enhancement or both (see Contrast Medium Administration section, below, for details). The arrival time is determined either real time with bolus tracking software or as a separate timing bolus acquisition.
The fourth series is the CT angiographic acquisition in which the contrast enhanced images are obtained. In adults, a tube voltage of 100 to 120 kV is used along with an
amperage of 275 to 350 mA, unless automated tube current modulation software is utilized. In pediatric applications, 80 to 100 kV is selected as the tube voltage. For patients with a low body mass index, the amperage and tube voltage can be reduced, while for patients of larger body habitus, both may need to be increased. Images are reconstructed with a soft or medium reconstruction kernel.
amperage of 275 to 350 mA, unless automated tube current modulation software is utilized. In pediatric applications, 80 to 100 kV is selected as the tube voltage. For patients with a low body mass index, the amperage and tube voltage can be reduced, while for patients of larger body habitus, both may need to be increased. Images are reconstructed with a soft or medium reconstruction kernel.
 Figure 22-5 Coronal topograms for upper extremity CT angiograms performed with the affected extremity isolated above the patient’s head (A) and with the extremity at the patient’s side (B). When the extremity is raised above the patient’s head, the scan direction is caudadcranial. When placed at the patient’s side, the direction is cranialcaudad. |
In the setting of suspected cardiogenic upper extremity thromboembolism, to simplify the diagnostic evaluation, an ancillary consideration is whether retrospective electrocardiogram (ECG) gating through the heart should be combined with the routine non-ECG-gated contrast-enhanced acquisition through the upper extremity vasculature. Breath-holding is required only for the portions of exams that extend through the chest.
The fifth series is an optional delayed post-contrast acquisition. The delayed acquisition is useful in the setting of suspected vasculitis, vascular masses, and hemorrhage. It can also be used to acquire a venous phase after the arterial phase, as in the case of preoperative vascular mapping for hemodialysis creation. A delayed phase can also benefit those instances in which the scan acquisition gets ahead of the contrast medium bolus, a circumstance that is best recognized when the exam is monitored.
Upper Extremity Computed Tomographic Angiogram
Coverage
In the Aortic Arch with Upper Extremity Runoff protocol, when the arm is raised, coverage begins at the mid chest to include the aortic arch, and extends in a caudadcranial direction through the fingers, so that the complete inflow and outflow upper extremity vascular tree is evaluated (Fig. 22-6). For an average adult patient, this scan distance may be 700 to 1,000 mm. If the arm is placed at the patient’s side, coverage begins at the thoracic inlet and extends through the fingers in a cranialcaudad direction.
In the Upper Extremity Runoff protocol, outflow segments are targeted. Coverage begins at the shoulder or elbow and extends through to the fingers, in a caudadcranial or cranialcaudad direction. The scan distance may range between 300 and 600 mm.
For the Upper Extremity Indirect CT Venogram protocol, central and peripheral veins are evaluated (Fig. 22-7). Scanning the central veins is recommended prior to the peripheral veins, as there is more rapid venous return from the head and neck. The arm may be raised or placed at the patient’s side, with the acquisition in either a caudadcranial or cranialcaudad direction, respectively. When the arm is raised, coverage begins at the mid chest to include the cavoatrial junction and progresses cranially. When the arm is at the patient’s side, coverage begins at the thoracic inlet and progresses caudally.
Depending on the clinical indications, coverage may extend to either the elbow (400 to 700 mm scan distance) or the hand (700 to 1,000 mm scan distance). For a delayed CT angiographic acquisition, the series may be programmed to cover the entire vascular tree or only the outflow. If the series is needed because contrast did not adequately opacify the forearm and hand arteries on the first acquisition, beginning the delayed scan at the elbow is sufficient.
Acquisition Parameters
Table 22-4 lists acquisition (detector configuration, pitch, gantry speed) and reconstruction (slice thickness, reconstruction interval) param-eters for complete upper extremity CT angiographic coverage, using 4-, 8-, 16-, and 64-channel multidetector-row CT scanners. Based on the type of multidetector-row CT scanner, selection of these parameters reflects a balance between the desired spatial resolution, the scan distance, and the scan duration. Parameters for 32- and 40-channel scanners can be adapted from 64-channel scanners.
With 4-channel systems, a 4 ÷ 2.5 mm detector configuration is required to scan the complete upper extremity vasculature in a reasonable duration. Then, 2.5-mm
images are reconstructed at 1.0- to 2.0-mm increments, resulting in an effective slice thickness of 3.0 mm. These “standard resolution” acquisitions with up to 1,000 images are adequate to depict the vascular tree to the hand. However, when visualization of the palmar and digital arteries is critical to diagnosis and clinical management, such as in arterial occlusive disease and vasculitis, high-resolution imaging with a 4 ÷ 1 mm or 4 ÷ 1.25 mm configuration may be necessary. As the scan duration would be twice as long, the coverage would need to be reduced (i.e., Upper Extremity Runoff protocol) to minimize venous contamination.
images are reconstructed at 1.0- to 2.0-mm increments, resulting in an effective slice thickness of 3.0 mm. These “standard resolution” acquisitions with up to 1,000 images are adequate to depict the vascular tree to the hand. However, when visualization of the palmar and digital arteries is critical to diagnosis and clinical management, such as in arterial occlusive disease and vasculitis, high-resolution imaging with a 4 ÷ 1 mm or 4 ÷ 1.25 mm configuration may be necessary. As the scan duration would be twice as long, the coverage would need to be reduced (i.e., Upper Extremity Runoff protocol) to minimize venous contamination.
 Figure 22-6 A left upper extremity CT angiogram was performed using an Aortic Arch with Upper Extremity Runoff protocol. Coverage includes the complete inflow and outflow vascular territories. VR images (A–D) are displayed as a four-station angiogram runoff. Note the robust enhancement throughout the vascular tree. |
With an 8-channel system, the complete vascular tree is imaged with a high-resolution technique (8 × 1.25 mm configuration) in duration comparable to 4 × 2.5 mm acquisitions. Vascular enhancement from the mid chest through the fingers is optimized, while the palmar arch and digital arteries are depicted with reliable detail. This technique also improves visualization of small vessels off the subclavian, axillary, brachial, and proximal radial and ulnar
arteries. Data sets are reconstructed every 0.8 mm into images with a nominal section thickness of 1.25 mm, yielding up to 1,250 images. Coverage of the thoracic and abdominal aorta can be combined with an upper extremity CT angiogram using the fastest gantry speed and maximizing the pitch. To minimize venous contamination, increasing the detector width to 2.5 mm (standard resolution) may be necessary.
arteries. Data sets are reconstructed every 0.8 mm into images with a nominal section thickness of 1.25 mm, yielding up to 1,250 images. Coverage of the thoracic and abdominal aorta can be combined with an upper extremity CT angiogram using the fastest gantry speed and maximizing the pitch. To minimize venous contamination, increasing the detector width to 2.5 mm (standard resolution) may be necessary.
 Figure 22-7 A right upper extremity venogram was performed with the patient’s arm raised. Imaging covered peripheral and central segments. Cephalic (arrowhead) and basilic (arrow) veins are well depicted (A). By using a prolonged injection, the axillary and brachial arteries also show robust enhancement (B). |
Table 22-4 Upper Extremity Computed Tomographic Angiography Acquisition and Reconstruction Parameters | ||||||||||||||||||||||||||||||||||||||||||||||||||||||||||||||||||||||||||||||||||||||||||||||||||||||||||||||||||||||||||||||||||||||||||||||||||||||||||||||||||||||||||||||||||||||||||||||||||||||||||||||||||||||||||||||||||||||||||||||||
|---|---|---|---|---|---|---|---|---|---|---|---|---|---|---|---|---|---|---|---|---|---|---|---|---|---|---|---|---|---|---|---|---|---|---|---|---|---|---|---|---|---|---|---|---|---|---|---|---|---|---|---|---|---|---|---|---|---|---|---|---|---|---|---|---|---|---|---|---|---|---|---|---|---|---|---|---|---|---|---|---|---|---|---|---|---|---|---|---|---|---|---|---|---|---|---|---|---|---|---|---|---|---|---|---|---|---|---|---|---|---|---|---|---|---|---|---|---|---|---|---|---|---|---|---|---|---|---|---|---|---|---|---|---|---|---|---|---|---|---|---|---|---|---|---|---|---|---|---|---|---|---|---|---|---|---|---|---|---|---|---|---|---|---|---|---|---|---|---|---|---|---|---|---|---|---|---|---|---|---|---|---|---|---|---|---|---|---|---|---|---|---|---|---|---|---|---|---|---|---|---|---|---|---|---|---|---|---|---|---|---|---|---|---|---|---|---|---|---|---|---|---|---|---|---|---|---|---|---|---|---|---|---|---|---|---|---|---|---|---|---|
| ||||||||||||||||||||||||||||||||||||||||||||||||||||||||||||||||||||||||||||||||||||||||||||||||||||||||||||||||||||||||||||||||||||||||||||||||||||||||||||||||||||||||||||||||||||||||||||||||||||||||||||||||||||||||||||||||||||||||||||||||
With 16-channel systems, isotropic resolution and high-resolution modes are utilized. Isotropic exams are acquired with submillimeter collimations (16 × 0.625 mm, 16 × 0.75 mm configurations). These acquisitions further improve visualization of small vessels in the upper extremity vascular tree and are particularly useful for defining anatomic detail in the shoulder, elbow, and hand and for evaluating pediatric upper extremity vasculature. Data sets are generated in a duration similar to 4 × 2.5 mm and 8 × 1.25 mm acquisitions. One of the challenges using this mode is the potential for increased noise and the subsequent need for increasing the amperage, if automated tube current modulation is not utilized. Another challenge is the number of images. Reconstructed at 0.4- to 0.8-mm increments, up to 2,500 images may be generated.
A solution to both the noise and the vast number of slices is to reconstruct images thicker into high-resolution data sets (1.5 mm). Alternatively, the exam can be acquired using a high-resolution mode (16 × 1.25 mm or 16 × 1.5 mm configurations). For most clinical applications with a 16-channel system, the high-resolution mode provides adequate detail to reliably depict the complete upper extremity vasculature.
The table speed with this configuration is often too fast for contrast medium transit in the upper extremity vascular tree. The result is that the acquisition can potentially out-run the bolus, a circumstance that can be largely avoided by slowing the acquisition speed with a lower pitch, by decreasing the gantry rotation speed, or both.
A second solution is to slow the scan by acquiring the study with submillimeter collimation. In this instance, the data set is reconstructed thicker into 1.0- to 1.5-mm thick images. A third solution is to lengthen the delay prior to initiating the scan. These solutions are further addressed in the discussion for contrast medium injection parameters. With a 16-channel system, the increased table speed can be utilized to scan the complete upper extremity vasculature and thoracic and abdominal aorta with a high-resolution technique.
With a 64-channel system, both isotropic (64 ÷ 0.6 mm, 64 ÷ 0.625 mm configurations) and high-resolution (64 ÷ 1.2 mm, 64 ÷ 1.25 mm configurations) modes can also be selected. When using either mode, the table speed is substantially faster than with 16-channel systems. To optimize vascular enhancement through to the digital vessels, it is essential to slow the acquisition speed. Submillimeter collimation, a low pitch, and a slower gantry speed are all options to achieve this goal.
With the submillimeter acquisitions, raw data can be reconstructed into high-resolution data sets (section thickness 1.0 to 1.5 mm, reconstruction interval 0.7 to 0.8 mm), into isotropic resolution data sets (section thickness 0.6 to 0.9 mm, reconstruction interval 0.4 to 0.7 mm) or into both. Automated tube current modulation should be utilized with all isotropic acquisitions to minimize noise and amperage and voltage requirements. Based upon the scan length and duration, an isotropic or a high-resolution technique can be prescribed to image not only through the aorta, but also the lower extremity vasculature.
Contrast Medium Administration
Depending on the degree of noise, arterial enhancement in an upper extremity CT arteriogram should reach at least a minimum of 250 to 300 Hounsfield Units (HU), while venous enhancement for indirect upper extremity venograms should be in the range of 120 to 200 HU. Optimizing this enhancement is dependent on synchronized delivery of contrast medium with an iodine dose of 400 to 600 mg iodine per kilogram (1.3 to 2.0 mL/kg for 300 mg iodine/mL concentration).
For patients who weigh between 60 and 90 kg, the iodine should be delivered at a rate (iodine flux) of 1.0 to 1.5 g iodine per second (3.3 to 5 mL/second for 300 mg iodine/mL concentration). Injection protocols for adult and pediatric upper extremity CT angiograms can achieve these requirements by adjusting the contrast medium concentration (300 to 370 mg iodine per millimeter), injection rate (2.5 to 6 mL/second), injection volume (75 to 150 mL), and/or injection duration based on a patient’s body weight, the scan distance, and the speed of the scanner (24).
Strategies for Contrast Medium Administration
Synchronization
To account for the variable time for contrast medium to travel from the site of IV injection to the upper extremity vascular tree, it is necessary to determine the transit time using either a test-bolus injection or automatic bolus triggering. For complete upper extremity arterial coverage, either technique can be performed, with the aortic arch serving as the reference level. For targeted upper extremity runoffs, the proximal or distal brachial artery is used as the reference level. In this instance, automated triggering is most practical given the small size (3 to 5 mm) of these arteries.
A test bolus is performed by injecting 15 to 20 cc of contrast at a rate equivalent to that planned for the CT angiogram. Low dose, thick transverse sections are
acquired every 2 seconds. A region of interest (ROI) is placed in the reference vessel, generating a time-attenuation curve. The transit time equals the time to the curve’s peak, which is then selected as the minimum delay. Automated triggering software is available on all multidetector-row scanners.
acquired every 2 seconds. A region of interest (ROI) is placed in the reference vessel, generating a time-attenuation curve. The transit time equals the time to the curve’s peak, which is then selected as the minimum delay. Automated triggering software is available on all multidetector-row scanners.
During contrast injection, low-dose, single-level sections are acquired. Reference vessel attenuation is monitored in near real time either with a ROI or by visual inspection. The transit time is defined as the time required to reach a predetermined opacification threshold (120 to 150 HU). The scan is then initiated after a short diagnostic delay. In comparison to a test-bolus injection, when utilizing automated triggering, the actual scan delay is longer. This is due to inherent interscan and image reconstruction delays in addition to the diagnostic delay. Depending on the scanner, the minimum scan delay may range between 2 and 8 seconds.
An indirect upper extremity CT venogram can be initiated after determining the arrival time of contrast to the aortic arch. In this instance, the venogram is acquired after an additional 50-second diagnostic delay. If the acquisition proceeds without determining the transit time, the venogram is acquired approximately 70 seconds following the infusion of contrast medium.
Injection Parameters
Extrapolating from lower extremity CTA contrast medium principles, upper extremity vascular enhancement is optimized when the table speed does not exceed 30 mm/second (25). For complete inflow and outflow coverage, this translates to scan durations of 25 to 35 seconds (700- to 1,000-mm distance), while for targeted runoff coverage, 10 to 20 seconds (300- to 600-mm distance). Accordingly, upper extremity injection protocols are designed based on slow (≤30 mm/second table speed) and fast (>30 mm/second) acquisitions.
Slow acquisitions occur with 4 ÷ 2.5 mm, 8 ÷ 1.25 mm, or 16 ÷ 0.625 mm configurations. In addition, a 64 ÷ 0.6 mm or 64 ÷ 0.625 mm configuration with a low pitch (≤0.8) and slower gantry speed (≥0.5) produces a table speed around 30 mm/second. When the scan duration is ≥25 seconds with these acquisitions, the injection duration is set to equal the scan duration and a biphasic injection protocol is utilized, rather than a uniphasic injection; the biphasic injection achieves more uniform enhancement for long injection durations (≥25 seconds).
The injection rates and volumes for both phases vary according to the body weight and the contrast medium concentration (Table 22-5). In the first phase, 20% of the total volume is administered at a higher rate (4 to 6 mL/ second for 60- to 90-kg patients) over a short duration (i.e., 5 seconds). In the second, the remaining volume is infused at a second, slower injection rate (3 to 5 mL/second for 60- to 90-kg patients) for the duration of the examination. If automated triggering is used, the injection duration is extended to account for the inherent delay with this software.
When the coverage is targeted to the runoff segments and the table speed is ≤30 mm/second, in most acquisitions, the injection duration is also set to equal the scan duration. A uniphasic injection is appropriate for the shorter injection duration (10 to 20 seconds). The injection rate is then derived by determining the patient’s appropriate contrast volume for the selected contrast medium concentration and dividing this amount by the injection duration. If the injection rate exceeds the tolerable limit for the accessed vein, the iodine concentration, the injection duration, or both should be increased. If the injection duration is increased, the diagnostic delay should be increased by the same amount.
Fast acquisitions occur with 8 ÷ 2.5 mm, 16 ÷ 1.25 mm, and 16 ÷ 1.5 mm configurations. With a 64-channel system, a collimation greater than 1.0 (32 × 1.25 mm, 24 × 1.2 mm configurations), a high pitch (>1.0), and a fast gantry speed (≤6.0) will routinely result in fast acquisitions. These scan parameters translate into table speeds of 45 to 65 mm/second. For an Aortic Arch with Upper Extremity Runoff protocol, if the injection duration is set to equal the scan duration, an insufficient iodine dose may be delivered and the scan acquisition may be too fast for the required transit time through the upper extremity vascular tree.
The key strategy to prevent the acquisition from “outrunning” the contrast bolus is to use a fixed biphasic injection of 30 to 35 seconds and increase the scan delay such that the scan and injection durations end simultaneously (Table 22-6). For an Upper Extremity Runoff protocol, a fixed 15- to 20-second uniphasic injection is selected, and the scan delay is similarly increased. To attain the required iodine dose, the injection rate and concentration are varied according to the body weight. One cautionary note with this approach is that if the delay is too long (>15 seconds), unwarranted venous opacification in the inflow and outflow regions may result. In this instance, the table speed should be slowed down.
Saline Flush
Saline flush is administered with a dual-chamber injector immediately following the contrast medium infusion. For UE CTA, the saline injection improves contrast utilization and reduces perivenous streaks artifacts. A volume of 30 to 40 mL injected at a rate equal to the contrast medium injection rate is sufficient. If a biphasic contrast medium protocol is utilized, the saline injection rate defaults to the second injection rate.
Table 22-5 Injection Protocols for Upper Extremity Computed Tomographic Angiography with Multidetector Computed Tomography Table Speed ≤30 mm/second | ||||||||||||||||||||||||||||||||||||||||||||||||||||||||||||||||||||||||||||||||||||||||||||||||||||||||||||||||||||||||||||||||||||||||||||||||||||||||||||||||||||||||||||||||||||||||||||||||||||||||||||||||||||||||||||||||||||||||||||||||||||||||||||||||||||||||||||||||||||||||||||||||||||||||||||
|---|---|---|---|---|---|---|---|---|---|---|---|---|---|---|---|---|---|---|---|---|---|---|---|---|---|---|---|---|---|---|---|---|---|---|---|---|---|---|---|---|---|---|---|---|---|---|---|---|---|---|---|---|---|---|---|---|---|---|---|---|---|---|---|---|---|---|---|---|---|---|---|---|---|---|---|---|---|---|---|---|---|---|---|---|---|---|---|---|---|---|---|---|---|---|---|---|---|---|---|---|---|---|---|---|---|---|---|---|---|---|---|---|---|---|---|---|---|---|---|---|---|---|---|---|---|---|---|---|---|---|---|---|---|---|---|---|---|---|---|---|---|---|---|---|---|---|---|---|---|---|---|---|---|---|---|---|---|---|---|---|---|---|---|---|---|---|---|---|---|---|---|---|---|---|---|---|---|---|---|---|---|---|---|---|---|---|---|---|---|---|---|---|---|---|---|---|---|---|---|---|---|---|---|---|---|---|---|---|---|---|---|---|---|---|---|---|---|---|---|---|---|---|---|---|---|---|---|---|---|---|---|---|---|---|---|---|---|---|---|---|---|---|---|---|---|---|---|---|---|---|---|---|---|---|---|---|---|---|---|---|---|---|---|---|---|---|---|---|---|---|---|---|---|---|---|---|---|---|---|---|---|---|---|---|---|---|---|---|---|---|---|---|---|---|---|---|---|---|---|---|
| ||||||||||||||||||||||||||||||||||||||||||||||||||||||||||||||||||||||||||||||||||||||||||||||||||||||||||||||||||||||||||||||||||||||||||||||||||||||||||||||||||||||||||||||||||||||||||||||||||||||||||||||||||||||||||||||||||||||||||||||||||||||||||||||||||||||||||||||||||||||||||||||||||||||||||||
Table 22-6 Injection Protocols for Upper Extremity CTA with MDCT Table Speed >30 mm/sec | ||||||||||||||||||||||||||||||||||||||||||||||||||||||||||||||||||||||||||||||||||||||||||||||||||||||||||||||||||||||||||||||||||||||||||||||||||||||||||||||||||||||||||||||||||||||||||||||||||||||||||||||||||||||||||||||||||||||||||||||||
|---|---|---|---|---|---|---|---|---|---|---|---|---|---|---|---|---|---|---|---|---|---|---|---|---|---|---|---|---|---|---|---|---|---|---|---|---|---|---|---|---|---|---|---|---|---|---|---|---|---|---|---|---|---|---|---|---|---|---|---|---|---|---|---|---|---|---|---|---|---|---|---|---|---|---|---|---|---|---|---|---|---|---|---|---|---|---|---|---|---|---|---|---|---|---|---|---|---|---|---|---|---|---|---|---|---|---|---|---|---|---|---|---|---|---|---|---|---|---|---|---|---|---|---|---|---|---|---|---|---|---|---|---|---|---|---|---|---|---|---|---|---|---|---|---|---|---|---|---|---|---|---|---|---|---|---|---|---|---|---|---|---|---|---|---|---|---|---|---|---|---|---|---|---|---|---|---|---|---|---|---|---|---|---|---|---|---|---|---|---|---|---|---|---|---|---|---|---|---|---|---|---|---|---|---|---|---|---|---|---|---|---|---|---|---|---|---|---|---|---|---|---|---|---|---|---|---|---|---|---|---|---|---|---|---|---|---|---|---|---|---|
| ||||||||||||||||||||||||||||||||||||||||||||||||||||||||||||||||||||||||||||||||||||||||||||||||||||||||||||||||||||||||||||||||||||||||||||||||||||||||||||||||||||||||||||||||||||||||||||||||||||||||||||||||||||||||||||||||||||||||||||||||
Table 22-7 Visualization Techniques | ||||||||||||||||||||||||||||||
|---|---|---|---|---|---|---|---|---|---|---|---|---|---|---|---|---|---|---|---|---|---|---|---|---|---|---|---|---|---|---|
| ||||||||||||||||||||||||||||||
Image Display
Interpretation and communication of upper extremity CT angiogram findings require efficient and effective image display. Two-dimensional (2D) and 3D visualization techniques are a fundamental alternative to transverse source image review and necessitate use of an advanced postprocessing workstation. Each technique has advantages and disadvantages (Table 22-7). These impact whether a technique is used for vessel overview or analysis. The quality of all postprocessed images is directly dependent on the resolution of the CT data set and the degree of contrast enhancement. A thorough treatment of the general topic can be found in Chapter 6.
Visualization Techniques
Four principle visualization techniques for displaying the upper extremity vasculature are standard on currently available workstations: maximum intensity projection (MIP), volume rendering (VR), multiplanar reformations (MPR), and curved planar reformations (CPR). Their interactive use is the basis for real time interpretation. Generation of protocol-driven static postprocessed images accommodates review of the transverse source images, coronal reformations, sagittal reformations, and oblique reformations on PACS or a workstation. With all techniques, it is important to use flexible angiographic window and level settings. This includes a wide window setting to account for vascular calcification, high-contrast attenuation, or both.
Vessel Tree Overview
MIP and VR provide robust angiographic displays of the upper extremity vasculature. Either can be used to rapidly formulate a structural overview and determine the location of vascular abnormalities. MIP collapses the brightest pixels of the volumetric acquisition into 2D displays, while VR applies user defined color, opacity, and light transfer functions to generate 3D displays.
For CTA, VR offers a comprehensive means to display the upper extremity vasculature and relationships with extravascular structures (Fig. 22-8). Both MIP and VR are dependent on prerendering editing to remove bone and other anatomical structures that may obscure visualization of upper extremity vasculature.
Alternatively, variable sliding thin slabs or cut planes can be utilized with interactive rotation, magnification, window and level settings, and VR transfer. Thin slabs are also employed when targeting upper extremity vascular segments for more focused angiographic evaluation.
MPRs with coronal, sagittal, and oblique projections provide limited overview of the upper extremity vascular
segments. MPR application requires stepping through each image. As vessels curve in and out of the planes, standard MPRs cannot display an entire upper extremity vascular segment in one image.
segments. MPR application requires stepping through each image. As vessels curve in and out of the planes, standard MPRs cannot display an entire upper extremity vascular segment in one image.
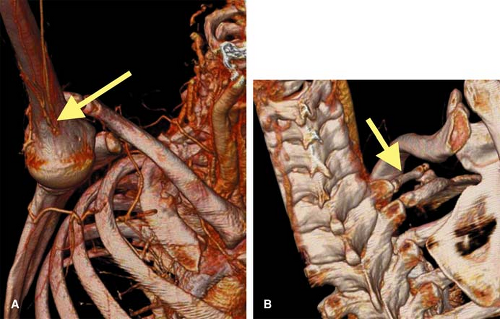 Figure 22-8 Cervical rib associated with arterial occlusion. A patient with right upper extremity claudication underwent 16-channel CTA. VR images demonstrated subclavian artery occlusion with reconstitution at the brachial profunda origin (arrow in A). Review of the source images localized the occlusion to be at level of the anterior scalene muscle. Further review of the skeletal system using VR demonstrated a cervical rib (arrow in B) |
The solution lies in the generation of longitudinal cross-sectional 2D CPR static or rotational displays by drawing a center line through the vessel lumen on the axial, coronal, or sagittal images. This is performed manually or with automated vessel tracking software. Still, only targeted segments will be displayed. An alternative means to improve the spatial perception of MPR is to apply a thick slab (thick MPR).
Vessel Analysis
MPR and CPR techniques are more suited for detailed interrogation of upper extremity vascular segments. Analysis of transverse MPR cross sections, orthogonal longitudinal CPR cross sections, or both is performed through each suspected region of abnormality. These techniques are fundamental for assessing calcified atheromatous plaque, noncalcified plaque, vessel wall thickening, lumen patency, and stent patency. MIP and VR techniques are limited in this evaluation, particularly with diffuse vessel wall calcification. Orthogonal (coronal and sagittal) CPR views are necessary, as eccentric lesions may not be accurately depicted on one view alone.
Source Images
Reviewing the axial source images serves two important needs. One is to assess the extravascular anatomy, which may include the chest, neck, head, upper arm, forearm, and hand, depending on the coverage. This review is required not only to detect incidental pathology, but also to evaluate relevant extravascular structures, such as the presence of a cervical rib and the course and size of the anterior scalene muscle in the case of suspected thoracic outlet syndrome.
The second objective of axial source image review is to verify image quality and confirm vascular disease when artifacts are suspected on the 2D and 3D images. Review of the axial source images is facilitated by generating 3- to 5-mm thick reconstructions. Alternatively, the coronal and sagittal reformations can be used.
Magnetic Resonance Angiography
Equipment Considerations
The typical maximum field of view (FOV) in current commercially available imagers is on the order of 40 to 45 cm. This means that the upper extremity vascular tree exceeds the maximum FOV of the MR imager by two times. With contrast-enhanced (CE) MRA, a stepping table strategy
with multiple injection can be used when both the proximal and distal upper extremity vessels need to be depicted, similar to the approach often used with IA DSA (26).
with multiple injection can be used when both the proximal and distal upper extremity vessels need to be depicted, similar to the approach often used with IA DSA (26).
When the user divides the typical total dose (0.2 to 0.3 mmol/kg) of extracellular contrast agents into two injections (i.e., one for each FOV), the arterial signal intensity sufficiently exceeds that of the venous signal, with each injection timed appropriately.
When designing an MR imaging protocol, the clinician always has to weigh the relative need for temporal resolution, spatial resolution, and signal-to-noise ratio (SNR).
In general, higher main magnetic field strengths, (≥1.5T), higher maximum gradient amplitudes, and faster gradient systems allow for better imaging protocols for the depiction of peripheral arterial disease. These system attributes are particularly important for CE MRA.
For upper extremity MRA, an absolute requirement is the use of surface coils in order to increase SNR. SNR is the currency enabling high temporal and spatial resolution. The extent of spatial resolution relates to arterial conspicuity, and when sufficient, disease characterization in small, distal, diseased arteries can be maximized.
Alternatively, an increase in SNR can be used to increase acquisition speed in order to avoid venous enhancement or provide temporal information regarding arrival times of contrast in vessels of interest. The use of phased-array surface body- or torso-coils are important for imaging the upper extremity and hand (Fig. 22-9). In addition, some MRI vendors now offer dedicated multi-station peripheral vascular coils with full body coverage.
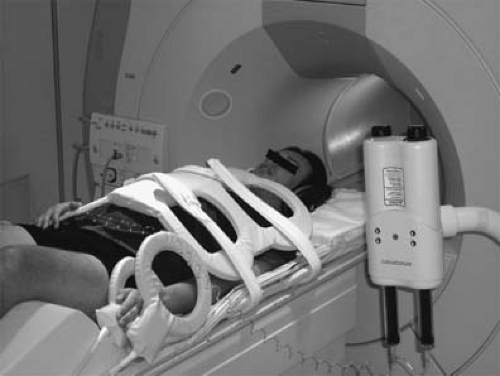 Figure 22-9 MR imaging setup demonstrated for parallel imaging accelerated MR angiography of the left upper extremity on a Philips Intera 1.5T MR system. The left hemithorax and upper extremity are covered by the four-element synergy body coil (upper and lower anterior and posterior elements). The forearm and hand are covered by the two-element Flex-M coil. |
An important technical advance that has shown to be beneficial for CE MRA in general is parallel imaging (26,27,28,29). Parallel imaging is used to speed up data acquisition. In theory, with parallel imaging the acquisition duration can be decreased by a factor R equal to the number of coil elements. However, the SNR is reduced by a factor equal to √R.
Magnetic Resonance Angiography Techniques for Imaging Peripheral Arterial Disease
Several different MRA techniques have been described to image the upper extremity vascular tree. These are: (a) TOF or inflow MRA; (b) PC MRA; and (c) CE MRA. A summary of the relative merits and shortcomings of these techniques can be found in Chapter 2. Newer techniques such as 3D half-Fourier fast spin echo MRA and balanced steady state free precession (bSSFP) MRA are potentially promising techniques but have not been applied to upper extremity imaging and will therefore not be discussed in this chapter.
Time-of-flight Magnetic Resonance Angiography
In TOF MRA, vessel-to-background contrast is generated by the inflow of fresh, unsaturated blood in a saturated tissue. Saturation bands are essential to achieve a selective display of arterial or venous structures (30,31,32).
Saturation bands are essential to achieve a selective display of arterial or venous structures, as the flow in these systems is, for the most part, in opposite directions. Such an approach can have an undesirable effect in suppressing retrograde flow in a vessel, distal to a high grade stenotic or obstructive lesion.
TOF MRA suffers from the long imaging times, an inconsistent orientation through the tortuous path of the upper extremity vasculature, and inherent artifacts that result in overestimation of the degree and length of stenoses (Fig. 22-10).
Most published TOF upper extremity studies have focused on the assessment of dialysis access fistulae, and tend to suffer from overestimation (30,31,32,33,34,35). Thus, in clinical practice, TOF is typically restricted to those patients who cannot receive contrast media or for cases benefiting from a quick and limited assessment of flow direction (e.g., subclavian steal syndrome).
Phase-contrast Magnetic Resonance Angiography
In addition to anatomical display of the peripheral vasculature, PC MRA allows for physiological studies because flow can be quantified in a noninvasive manner.
Although anatomic PC MRA is less sensitive to in-plane saturation than TOF MRA, PC MRA is not often
used for detection and grading of upper extremity arterial stenoses because of the reliance on CE techniques (see below).
used for detection and grading of upper extremity arterial stenoses because of the reliance on CE techniques (see below).
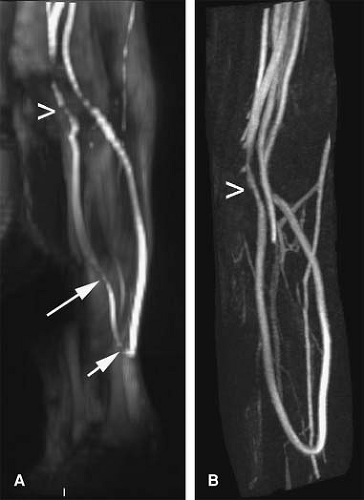 Figure 22-10 Coronal maximum intensity projections of TOF (A) and corresponding CE MR (B) angiograms in patient with a flow-declined hemodialysis access loop graft. The TOF study suggests high-grade stenoses in three parts of the loop graft (arrows and > in A). The corresponding CE MRA study confirms mild to moderate luminal narrowing in the draining vein just proximal to the anastomosis (> in B). Suggested luminal narrowing in (A) is due to in-plane saturation (short arrow) and suboptimal nonperpendicular orientation of the vessel in relation to the imaging slice plane. |
PC MRA is mainly used to assess the direction of flow in the cervical arteries in cases of suspected subclavian steal syndrome. The technique has also been used in a limited number of studies investigating the feasibility of MRA to assess hemodialysis access fistulae (36).
Contrast-enhanced Magnetic Resonance Angiography
Background
CE MRA of the upper extremity vasculature is the preferred MRA technique for evaluation of patients with different forms of upper extremity arterial disease.
Because of the general propensity of upper extremity arterial disease to affect either the more centrally located large- and medium-sized vessels or more distally located forearm and hand arteries, the most common approach is to acquire a single FOV, focusing on either region. The dose of contrast medium used is usually between 0.2 and 0.3 mmol/kg, or between 30 and 45 mL for a 75 kg patient (37,38,39,40).
As stated previously, when imaging both the central vasculature as well as that of the forearm and hand, contrast medium administration can be split into two separate injections, with the first injection used to image the distal, smaller vessels. It is paramount with this approach that examination parameters are optimized for spatial resolution and coil selection relevant to the individual acquisitions.
Practical Aspects of Upper Extremity Contrast-enhanced Magnetic Resonance Angiography
Localizer Scans
The CE MRA portion of the upper extremity MRA examination can usually be completed within several minutes. However, adequate planning of the high spatial resolution 3D CE MRA volumes is essential to ensure optimal image quality in the shortest possible imaging time. The exact spatial location of the 3D CE MRA imaging volumes that cover the upper extremity vascular tree is prescribed on ‘scout’ or ‘localizer’ images.
Scout scans are usually generated from transverse, thick slice, low-resolution TOF scans (Fig. 22-11), or more recently, steady state free precession (SSFP) acquisitions (Fig. 22-12). Scout views in sagittal or coronal orientation are also useful, and are easily obtained in less than a minute. The use of low-resolution TOF acquisitions to supply the scout images can show a cursory view of the vascular anatomy with MIPs, especially of the brachial and forearm arteries.
When the 3D CE MRA volume is planned, transverse source images should always be reviewed to ensure that all relevant vascular structures are included in the imaging volume. Failure to do so can result in the exclusion of relevant anatomy from the imaging volume (see below). Sample localizer protocols are listed in Tables 22-8 and 22-9.
In addition to using localizer images to prescribe the 3D CE MRA imaging volume, standard T1- and T2-weighted images and fat-saturated T2 images can be used to check that coverage is sufficient and includes all of the region of interest that needs to be visualized. These images are typically available in cases requiring both soft tissue analysis and vascular assessment (e.g., surgical planning for extremity tumors).
Considerations with Regards to Vascular Anatomy
In most patients, coverage needed in the anteroposterior direction is usually less than 10 cm. In the presence of an aortic root aneurysm or collaterals bridging subclavian artery obstructions or bypass grafts
(e.g., subclavian-to-subclavian, subclavian-to-carotid), the AP coverage needed to depict these vessels may be increased (up to 15 to 20 cm). The 3D CE MRA imaging volume should be positioned based on the localizer images to ensure that the relevant structures are not excluded. When there is any doubt as to the presence of collaterals, a test bolus injection with a small amount of contrast medium can be used to answer this question.
(e.g., subclavian-to-subclavian, subclavian-to-carotid), the AP coverage needed to depict these vessels may be increased (up to 15 to 20 cm). The 3D CE MRA imaging volume should be positioned based on the localizer images to ensure that the relevant structures are not excluded. When there is any doubt as to the presence of collaterals, a test bolus injection with a small amount of contrast medium can be used to answer this question.
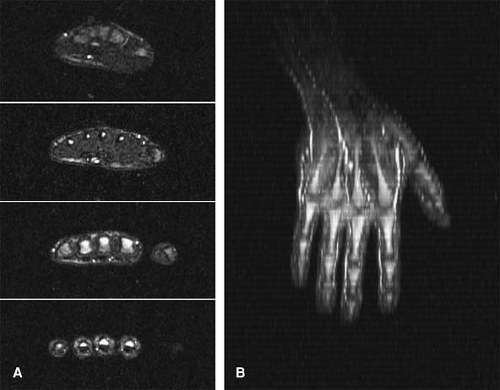 Figure 22-11 TOF localizer scans of the hand. In panel A, four transverse source images are shown. Vascular structures appear as bright “dots” in the soft tissues of the hand with bright to intermediate signal intensity. Panel B shows the resulting MIP of all slices. Total acquisition time for this localizer sequence was about 1 minute. |
Table 22-8 Sample Time of Flight Localizer Imaging Protocol | ||||||||||||||||||||||||
|---|---|---|---|---|---|---|---|---|---|---|---|---|---|---|---|---|---|---|---|---|---|---|---|---|
| ||||||||||||||||||||||||
It is also important to realize that bypass grafts coursing in a transverse direction are usually not seen on TOF MIPs generated from axial acquisitions, as these are vulnerable to in-plane saturation (41). Other patients who demand special attention are those with large thoracic aortic aneurysms where contrast media may pool, risking incomplete enhancement of the aneurysm and the distal vessels at the time of imaging. To avoid this problem, either a longer delay between injection
and start of acquisition, or a multiphasic acquisition should be used (40,42). A test bolus may be of value to establish when all the arteries in the area of interest are opacified (see below).
and start of acquisition, or a multiphasic acquisition should be used (40,42). A test bolus may be of value to establish when all the arteries in the area of interest are opacified (see below).
Table 22-9 Sample bSSFP Localizer Imaging Protocol | ||||||||||||||||||||||||
|---|---|---|---|---|---|---|---|---|---|---|---|---|---|---|---|---|---|---|---|---|---|---|---|---|
| ||||||||||||||||||||||||
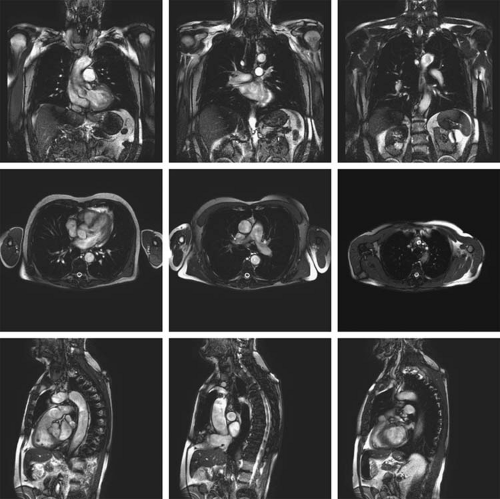 Figure 22-12 SSFP localizer sequence for imaging of the thorax and proximal upper extremity. SSFP sequences provide a rapid overview in multiple orientations of relevant anatomy such as the aortic arch and branch vessels in this patient. Coronal (upper row), transverse (middle row), and sagittal (lower row) images are acquired in less than 1 second per image, enabling large volume coverage in a single breath-hold. |
Synchronization of Three-dimensional Contrast- enhanced Magnetic Resonance Angiography Acquisition with Contrast Arrival
Careful synchronization of peak arterial enhancement with acquisition of the center of k-space is essential to obtain a study of diagnostic quality. The time of peak arterial enhancement is a function of many variables, the most important of which are injection rate and volume, amount and rate of saline flush (43), and cardiac output (44). Because the time of peak arterial enhancement can vary substantially between patients, the CE MRA examination needs to be tailored to the individual contrast arrival time.
This is important for two main reasons: (a) to prevent ringing artifacts and suboptimal opacification of arteries in the FOV due to starting the acquisition too early (45), and (b) to prevent disturbing venous overlay (41).
To determine the delay between the start of injection of contrast medium and the acquisition of central k-space profiles, a 2D time-resolved test bolus technique can be used. The optimal scan delay time can be determined by measuring the arrival time in the arterial bed of interest of a small bolus (1 to 3 mL) of contrast medium followed by 25 to 35 mL of saline, injected at the same rate as the full contrast bolus will be injected later on (46). A temporal resolution of about 1 to 2 seconds per image should be used.
The scan delay should be chosen to coincide with the frame in which maximum enhancement is observed. Acquisition orientation of the timing bolus scan should be in the coronal or sagittal plane, as this will not only provide the exact time at which enhancement commences, but also the rate at which enhancement progresses along the 40 to 45 cm of the arterial tree in the FOV.
For patients in whom two acquisitions are planned, such as forearm imaging followed by upper arm and central imaging, timing information from one station can be used to determine the optimal scan delay for the second acquisition. For example, enhancement of the distal brachial artery can be used to determine the timing of opacification of the forearm arteries as well as the upper arm arteries.
With real time bolus monitoring (see Chapter 5), the operator is able to inject the total volume of contrast material and proceed with the 3D CE MRA acquisition when the desired signal enhancement in the arterial bed of interest has been detected by the scanner, or by visual feedback (47,48,49). For an extensive discussion of the different strategies to appropriately synchronize contrast injection with image acquisition, please refer to Chapter 5.
Strategies to Optimize Vessel-to-background Contrast
Because the T1 of fat is close to that of CE arterial blood, another way to suppress background tissue is by spectral saturation of signal from protons in fat. Although a fat saturation prepulse can be integrated into the 3D CE MRA sequence, this may impact scan time, and decrease the achievable spatial resolution in a given acquisition duration.
Another vulnerability with fat suppression, particularly in the proximal vessels emanating from the aortic arch, is the inadvertent loss of vascular signal from a poorly shimmed field. In this case, water suppression may result in the unintended suppression of the gadolinium signal (Fig. 22-13) (50). Thus, the use of fat-saturation pulses for upper extremity MRA is not universally recommended (51,52).
Another useful technique to maximize vessel to background is the use of subtraction of a precontrast data set from a postcontrast data set, which will be described in detail in a later section of this chapter.
Optimization Strategies
Venous enhancement may contaminate high spatial resolution arterial imaging when acquisition speeds that are too long or too slow are prescribed. On the other hand, upper extremity imaging often entails venous imaging as well, especially in patients undergoing a preoperative imaging workup prior to creation of dialysis access. Below, several general acquisition strategies that can be used to optimize upper extremity CE MRA are discussed. These are:
Increasing acquisition speed
Use of a separate acquisition for the forearm and hand
Use of specialized k-space filling algorithms
Use of a time-resolved acquisition strategy
Use of infrasystolic venous compression
Use of suprasystolic arterial compression
The most straightforward way of ensuring a selective arterial phase is by shortening acquisition duration. This should be done, first of all, by lowering repetition time (TR) and echo time (TE) to the shortest possible value, without excessively increasing bandwidth. In addition, partial or fractional echo should be used. With the introduction of multielement (peripheral) surface coils and parallel imaging, acquisition speed can be increased further (28,56,57).
Venous free imaging is readily obtained by employing a 2D projectional acquisition, where through plane resolution is entirely sacrificed, analogous to IA DSA (58). Like IA DSA, this method demands separate injections of contrast medium for each projection, and therefore this approach is infrequently used in the upper extremity.
In cases where the entire upper extremity needs to be imaged, it is unusual to use a “moving table” approach, as is common for the lower extremity. To avoid the limitations of imaging two stations in rapid succession, we recommend use of a dual-injection protocol in which the forearm and hand are imaged first, and the thoracic and proximal upper extremity are imaged afterward in a separate acquisition.
The rationale for this “hybrid” approach is that it is easier to obtain high-resolution 3D images of the small distal
arteries free of disturbing venous enhancement. The initial acquisition of the forearm and hand is typically done using up to 15 to 20 mL 0.5 M Gd-DTPA with a monophasic injection. Because synchronization of central k-space lines is optimized with regard to contrast enhancement in the forearm arteries, venous enhancement is virtually eliminated. After imaging of the distal upper extremity is completed, a second acquisition is performed to image the aorta, arch vessels, and brachial artery using the remaining volume of contrast agent (Fig. 22-14).
arteries free of disturbing venous enhancement. The initial acquisition of the forearm and hand is typically done using up to 15 to 20 mL 0.5 M Gd-DTPA with a monophasic injection. Because synchronization of central k-space lines is optimized with regard to contrast enhancement in the forearm arteries, venous enhancement is virtually eliminated. After imaging of the distal upper extremity is completed, a second acquisition is performed to image the aorta, arch vessels, and brachial artery using the remaining volume of contrast agent (Fig. 22-14).
 Figure 22-13 Images obtained in a 47-year-old man with progressive left upper extremity pain and weakness. 3D MR angiography was performed to exclude a left subclavian artery stenosis or thrombosis. A: MIP image from a fat-saturated 3D MR angiographic examination (6.0/1.2, 20° flip angle) shows moderate loss of signal intensity within the proximal segment of the left subclavian artery (arrow). B: The patient returned 6 days later for repeat imaging. An identical 3D MR angiographic examination was performed, except that fat suppression was not used. Corresponding MIP image shows a normal left subclavian artery. C: Delayed fat-saturated 2D GRE MR image (150/2.1, 90° flip angle) shows a signal void (straight arrow) within the left subclavian artery. Adjacent mediastinal fat (curved arrow) is not saturated. D: Corresponding 2D GRE MR image obtained with otherwise identical imaging parameters, except that no fat-saturation pulse was used, shows normal intravascular signal intensity within the left subclavian artery. Partial signal intensity loss in the surrounding fat is secondary to opposed-phase effects. (Reprinted with permission from Siegelman ES, Charafeddine R, Stolpen AH, et al. Suppression of intravascular signal on fat-saturated contrast-enhanced thoracic MR arteriograms. Radiology. 2000;217(1):115–118.) |
A disadvantage of the multiple injection technique is that the total amount of contrast medium has to be divided into two or more separate injections of much less contrast medium. This may lead to longer examination times and a decrease in vessel-to-background contrast compared with a single, double to triple dose injection.
Over the past few years, all major MR vendors have implemented dedicated centric k-space filling algorithms (see Chapter 2). Centric k-space filling avoids venous contamination and accounts for the common situation in which the time between arterial and venous enhancement is shorter than the duration of the high spatial resolution 3D CE MRA acquisition.
Greater flexibility is available when centric k-space filling is combined with parallel imaging; the chances of
disturbing venous enhancement decrease even further (56,57,59).
disturbing venous enhancement decrease even further (56,57,59).
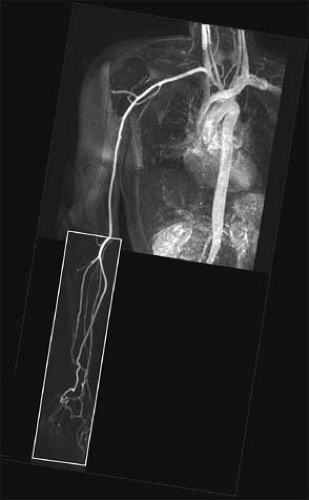 Figure 22-14 Composite MIP of hybrid dual-injection approach for imaging the upper extremity. First, the distal upper extremity arteries (enclosed by box) were imaged during injection of 17 mL of gadolinium-DTPA. Subsequently, the proximal upper extremity and aortic arch vessels were imaged during a second injection with the same amount of contrast material. Note lack of venous enhancement in the proximal station. |
Repetitive centric k-space filling techniques obtain high spatial resolution peripheral MR angiograms with high temporal frame rate (i.e., time-resolved imaging at several seconds per frame). Korosec et al. (60) first described this concept as time-resolved imaging of contrast kinetics (TRICKS). Refinements to the TRICKS technique allow for further increases in acquisition speed (61,62,63).
A technique similar to TRICKS is keyhole contrast-enhanced timing robust angiography (CENTRA). With keyhole CENTRA, temporal resolution is increased by repetitive acquisition of the central part of k-space only. This information is later combined with a data set containing the peripheral part of k-space, which is acquired as part of the last frame of the time-resolved series (64). Subsequently, these hybrid k-spaces can be reconstructed as a series of time-resolved 3D CE MR angiograms (Fig. 22-15). Temporal resolution can be further increased by combining keyhole imaging with parallel imaging (65). Other segmented k-space acquisition schemes have been described as well (66).
Time-resolved acquisitions obviate the need for test bolus injections (67). Although there are no published data on the benefits of TRICKS or keyhole CENTRA for imaging upper extremity vessels, Hany et al. (68) found that the use of TRICKS improved small, distal vessel conspicuity and reduced venous overlay in a head-to-head comparison with single injection, three-station lower extremity CE MRA.
A technique to optimize upper extremity venous imaging is the use of infrasystolic venous compression proximal to the cubital fossa with pressures of 50 to 60 mmHg (69). In contrast to the lower extremities, venous compression is more often used to induce venous dilatation and improve visualization of these structures. Knowledge about maximum venous diameter is important for vascular surgeons to determine the type of arteriovenous fistula (AVF) that will be created in patients with ESRD requiring dialysis access (see the section on Dialysis Access Fistulas).
The use of suprasystolic arterial compression, also known as timed arterial compression (TAC), employs a blood pressure cuff wrapped around the upper arm and inflated to 200 mmHg to arrest all blood flow at a predetermined scan delay. The exact delay time is determined with a serial 2D MR technique (BolusTrak; Philips), with a small test bolus of contrast medium, followed by saline flush.
Compared with their standard first-pass MRA technique with an acquisition time of 23 seconds and voxel size of 1.17 × 0.59 × 0.7 mm3 (483 microns), use of TAC MRA permitted a four-fold increase in spatial resolution, to a voxel size of 0.59 × 0.29 × 0.7 mm3 (120 microns) (70). The improved spatial resolution permitted full diagnostic assessment of the palmar metacarpal, common metacarpal, common palmar, and proper digital arteries, in addition to radial, ulnar, and palmar arch arteries, which could also be evaluated with the standard approach (Fig. 22-16).
Resolution Requirements
To accurately describe degree and length of peripheral arterial occlusive disease (PAOD), it is paramount that the resolution of the 3D data set needs to meet minimal standards. For instance, it is known from the work by Hoogeveen et al. (71) and Westenberg et al. (72) that at least three pixels are needed across the lumen of an artery to quantify the degree of stenosis with an error of less than 10%. When this constraint is kept in mind, the greater spatial resolution demands to accurately quantify stenoses in the distal forearm or hand arteries as opposed to the aortic arch vessels become obvious.
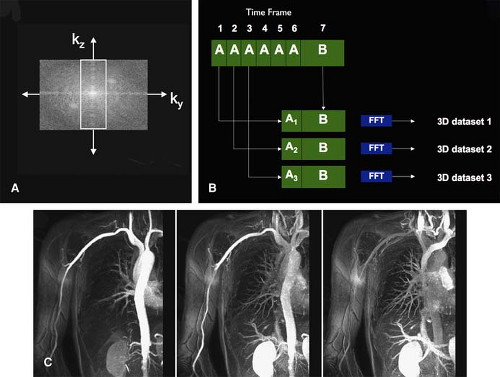 Figure 22-15 Keyhole CENTRA acquisition scheme. With this technique, temporal resolution is increased by acquiring the center of k-space (white box in A) multiple consecutive times (green boxes in B). The peripheral part of the k-space is acquired after the last center is acquired. After the acquisition has been completed, all k-space centers are combined with the peripheral part and reconstructed to a series of 3D volumes. In (C), an example is shown of a keyhole CENTRA acquisition of the aortic arch and proximal upper extremity vessels. In this acquisition, the central part was set to 25% of the entire k-space, yielding a temporal resolution of about 6 seconds. Total acquisition time for this sequence was 6 + 6 + 18 = 30 seconds. |
Voxel dimensions should be kept as close to isotropic as possible so that vessel blurring is minimized when viewing projections that differ from the plane of acquisition. Recommended voxel sizes are about 3 to 4 mm3 or less in the thoracic and proximal upper extremity arteries, 1 to 2 mm3 or less in the forearm, and 1 mm3 or better in the hand. Resolution of 500 microns or below are recommended.
Contrast Media and Injection Protocols
The IV cannula should always be placed in the upper extremity contralateral to the side of interest because the presence of undiluted contrast medium in a vein close to the artery of interest may cause artifactual signal loss (also see the section on Magnetic Resonance Angiography Postprocessing Issues).
Most of the reported studies on upper extremity CE MRA used conventional 0.5 M extracellular contrast agents. Typically, between 0.1 and 0.3 mmol/kg of contrast agent is injected (i.e., between 15 and 45 mL for a 75-kg patient), followed by a 15 to 30 mL saline injection to flush contrast from injection tubing and veins into the central venous and arterial circulations.
With conventional 0.5 M extracellular contrast agents, typically, a dose between 0.1 and 0.3 mmol/kg typically is injected (i.e., between 15 and 45 mL for a 75-kg patient), followed by a 15 to 30 mL saline injection to flush contrast from injection tubing and veins into the central venous and arterial circulations.
Currently, there is no single preferred injection protocol for upper extremity CE MRA, although an empirical strategy that works well in clinical practice is that the contrast injection duration should be about 40% to 60% of the acquisition duration. The rationale for this strategy is twofold.
First, due to contrast dilution at the leading and trailing edges of the bolus, as well as variable transit times
through different portions of the pulmonary circulation, contrast bolus length will increase in the body (usually with about 5 to 7 seconds) (73). Second, contrast that is injected after about half of the typical scan duration (in the order of 10 to 20 seconds) will not arrive in the arterial bed of interest before k-space lines contributing to contrast enhancement in the image are acquired (in cases where centric k-space filling is used).
through different portions of the pulmonary circulation, contrast bolus length will increase in the body (usually with about 5 to 7 seconds) (73). Second, contrast that is injected after about half of the typical scan duration (in the order of 10 to 20 seconds) will not arrive in the arterial bed of interest before k-space lines contributing to contrast enhancement in the image are acquired (in cases where centric k-space filling is used).
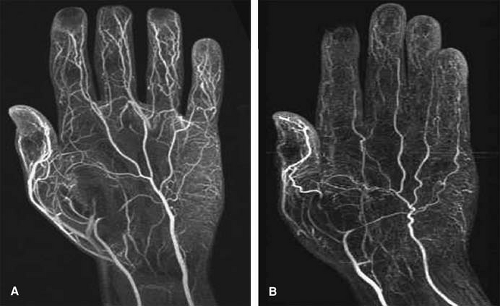 Figure 22-16 Example of the effect of TAC on CE MRA of the hand. Images acquired at ultra-high spatial resolution of 0.59 ÷ 0.29 ÷ 0.7 mm3 normally suffer from substantial venous enhancement in the first pass due to long acquisition times (panel A). Application of suprasystolic TAC enables acquisition of images largely free of venous enhancement at spatial resolutions close to intra-arterial DSA. (Images are courtesy of Professor Klaus Wentz, M.D., Ph.D., of RODIAC Diagnostic Centers, Kilchberg, Switzerland.) |
The amount of contrast to be injected as well as injection speed and amount of saline flush are dependent on other variables such as scan duration and technique used (i.e., single vs. multiple injection). Different authors have used various single- and multiple-phase injection rates and different saline flush volumes.
In general, a fixed rate of about 2.0 to 3.0 mL/second is used (55,74). On older and slower systems, the injection rate is usually set to between 1.0 and 3.0 mL/second (75,76).
In a recently published study focusing on abdominal aortic CE MRA, Boos et al. (43) found that increasing the amount of contrast injected as well as saline flush volume increases bolus length and improves small vessel conspicuity, but does not necessarily result in higher vessel-to-background contrast. A sample injection protocol for upper extremity CE MRA is listed in Table 22-10. More details regarding nuances of contrast administration can be found in Chapter 5.
Novel Contrast Media
Vessel to background signal can also be improved by using other contrast agents than the currently used 0.5 M gadolinium chelates. Recently, the first 1.0 M agent (gadobutrol [Gadovist]; Schering AG, Berlin, Germany) has been approved for clinical use and has a European-wide registration for CE MRA. Gadobutrol is formulated at higher concentration of 1.0 mol/L and about 20% higher relaxivity (T1 relaxivity in blood: 5.2 mM-1s-1 at 37ºC and 1.5 T). These properties generate lower blood T1 values compared with other commercially available contrast agents, thus offering an attractive method to increase intravascular signal (77).
In a direct head-to-head comparison between 1.0 M and 0.5 M agents for pelvic MRA, Goyen et al. found that the use of the 1.0 M agent led to significantly higher signal- and contrast-to-noise ratios and better delineation of especially small pelvic arteries (78). There have been no specific studies investigating the utility of higher relaxivity contrast agents for the upper extremity.
Higher relaxivity compared to extracellular agents is achievable with certain agents (79,80). Gadofosveset (Vasovist [formerly known as MS-325]; Schering AG, Berlin, Germany) is a higher relaxivity agent available for use in Europe. With these agents a lower dose can achieve the same vessel-to-background contrast as ECF agents, or, conversely, the imaging of smaller vessels benefits from the higher SNR (Fig. 22-17).
Table 22-10 Suggested Injection Protocol for Commercially Available 0.5 M Gadolinium Chelates | ||||||||||||||||
|---|---|---|---|---|---|---|---|---|---|---|---|---|---|---|---|---|
| ||||||||||||||||
Magnetic Resonance Angiography Postprocessing Issues
Although the same postprocessing techniques can be used for displaying CTA and MRA datasets, there are specific nuances to maximize the MRA results.
Subtraction Imaging
The T1 decrease in peripheral arterial blood due to injection of 0.1 to 0.3 mmol/kg 0.5 M gadolinium chelate contrast medium is generally insufficient to selectively enhance arteries and suppress background tissue on ray-casting algorithms such as whole-volume MIP, especially in cases of small distally located and diseased arteries. Therefore, the signal of background tissues, and fat specifically (because it has the shortest T1), need to be eliminated in order to present data to clinicians in an easily understandable format.
 Figure 22-17 Whole-volume MIPs of first-pass (panel A) and steady state (panel B) acquisitions using 0.03 mmol/kg gadofosveset. The first-pass image clearly shows the superficial and deep palmar arches. Because of the limited spatial resolution (1.0 ÷ 1.0 ÷ 1.0 mm3), it is difficult, however, to evaluate the digital arteries. The steady state acquisition was acquired at 0.4 ÷ 0.4 ÷ 0.4 mm3 resolution (64 microns). The improved spatial resolution is clearly reflected in the much higher level of detail, such as the depiction of the princeps pollicis artery and its branches into the thumb (arrowhead in B). Note that MIP is not the preferred evaluation of steady state images because of the concomitant venous enhancement. |
The most commonly used technique to suppress background signal is subtraction of nonenhanced “mask” images that are identical to the 3D CE MRA volumes. Although subtraction decreases the SNR by a factor of about 1.4 (√2 when the number of signals acquired is 1), vessel-to-background contrast improves to the extent that whole-volume MIPs become clinically useful, especially when using injection rates below 1.0 mL/second (Fig. 22-18) (75). A disadvantage of using mask scans is that patients may move in between acquisition of the mask and CE parts of the scan, which can lead to subtraction misregistration artifacts.
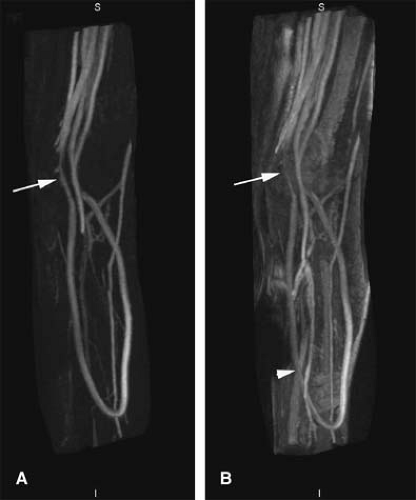 Figure 22-18 Effect of image subtraction on vessel conspicuity in a patient with flow-declined arteriovenous loop graft in the antecubital fossa. Whole-volume MIP of subtracted images (panel A) shows a moderately severe stenosis in the vein draining the loop graft (arrow). In contrast, the MIP of the nonsubtracted images (panel B) shows a severe stenosis bordering on occlusion (arrow). This overestimation is due to overprojection of subcutaneous fat with signal intensity similar to that in the vessel. Note a similar phenomenon in the ascending part of the graft where it crosses bone marrow in the ulna (arrowhead). |
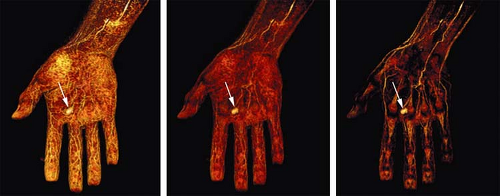 Figure 22-19 Color VRs at different thresholds in a patient with an aneurysm of the third common palmar digital artery at the level of the third metacarpal head. The images show the relation of the aneurysm to surrounding soft tissues and metacarpal bones. |
While subtraction improves small vessel conspicuity, it has the disadvantage that the tissues surrounding the arteries are often lost (81). Therefore, the use of VR nonsubtracted 3D CE MRA data sets can be very useful for cross-referencing vascular structures to important anatomical landmarks used for therapeutic purposes.
Osseous anatomy of the extremity as well as the exact position of veins on the skin surface in relation to underlying muscular and bony structures is particularly important for referring vascular surgeons (Fig. 22-19), especially if CE MRA is used as the sole preoperative imaging modality (81).
For the larger vessels in the thorax and proximal upper extremity, subtraction is not absolutely necessary, but may be useful to improve conspicuity of small branch vessels and collaterals.
Image Rendering Options
On almost all of today’s commercially available postprocessing workstations, MIP images can be generated and manipulated in (near) real time. This makes it possible to view 3D CE MRA data sets from any desired angle, and is particularly useful when assessing eccentric stenoses.
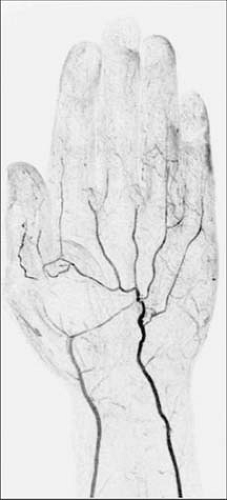 Figure 22-20 Example of MIP of MRA of the hand acquired at ultra-high spatial resolution of 0.59 ÷ 0.29 ÷ 0.7 mm3, displayed in inverse video mode. (Image courtesy of Professor Klaus Wentz, M.D., Ph.D., of RODIAC Diagnostic Centers, Kilchberg, Switzerland.) |
A review of cross-sectional images remains an integral part of the evaluation. Because MIP images have a look and feel analogous to IA DSA, particularly when displayed in inverse video mode (Fig. 22-20), they are easily understood by referring clinicians.
The MIP algorithm works best when using thin-slab or (curved) subvolume selections. In whole-volume MIPs, contrast-enhancing organs or other vascular structures may superimpose over smaller arteries when they have higher signal intensities along a particular viewing path.
Another very helpful technique for the precise evaluation of vessel morphology is curved multiplanar reformation (cMPR) along the axis of the arterial segment of interest (Fig. 22-21).
Other commonly used postprocessing techniques are shaded surface display (SSD) and volume rendering (VR). With SSD, all information in voxels with signal intensity below a predefined threshold is discarded. SSD is mainly useful for the depiction of complex anatomic relationships between large vessels. SSD is vulnerable to pseudostenoses and pseudo-occlusions, and its use should be reserved for circumstances where sufficient contrast between the vessel lumen and surrounding tissues exists.
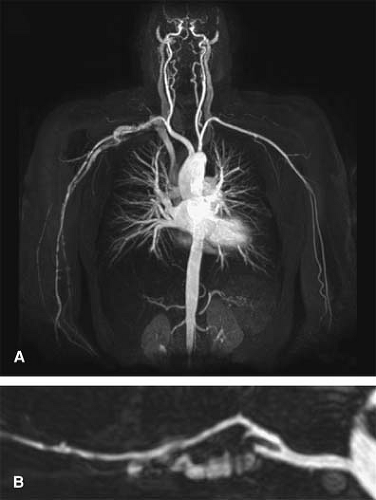 Figure 22-21 Principle of cMPR. Whereas arteries can be hard to differentiate from surrounding structures such as veins in simple MIPs (right subclavian artery in panel A), cMPR—in effect, a thin-slab MIP of a curved surface—allows for selective visualization of the artery (panel B). This tool is particularly useful where the artery is in close proximity to structures with similar signal intensity such as contrast-filled veins. |
With VR, the information about the signal intensity in all voxels is retained. Color scales are commonly used in VR to code ranges of signal intensities in order to better differentiate the vasculature from various surrounding tissues (Fig. 22-22).
It must be stressed, however, that the presence of a stenosis or occlusion in a MIP, SSD, or VR must always be confirmed by viewing of original, thin-slice partitions of the 3D data set in multiple, orthogonal directions (e.g., coronal, sagittal, and transverse), aided with MPRs of the arteries, preferably perpendicular to the vessel axis.
Artifactual stenosis in the subclavian artery can result from undiluted contrast medium in the ipsilateral subclavian vein during infusion. The high venous gadolinium concentration often yields susceptibility artifacts, in turn leading to signal loss in the adjacent subclavian artery, mimicking stenosis. Acquisition of a second phase, immediately after the first, will almost always reveal the true status of the subclavian artery as dilution and washout of the
contrast medium ameliorates the susceptibility artifacts (Fig. 22-23).
contrast medium ameliorates the susceptibility artifacts (Fig. 22-23).
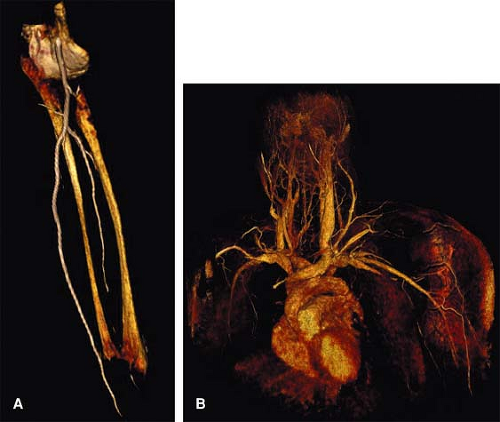 Figure 22-22 Examples of color VRs of the antecubital fossa and distal upper extremity arteries (A) and the central thoracic and cervical arteries and veins (B). VR is a particularly powerful technique to show the vessels in relation to each other and surrounding anatomical structures. Display of MR angiographic data sets with VR can greatly aid the vascular surgeon in planning the exact approach to a certain vessel in relation to overlying bony and soft tissue landmarks. |
Anatomy
Arterial System
The upper extremity vascular tree begins at the aortic arch and extends through to the digital arteries. It is composed of a main conduit that gradually tapers to the level of the elbow, at which point it branches into three main forearm arteries. These three arteries course to the hand and supply an intricate network in the palm and fingers.
Clinically, the main arteries can be separated into inflow and outflow segments. Inflow arteries include the aortic arch, brachiocephalic artery, and right and left subclavian arteries, while the outflow arteries include the axillary, brachial, radial, ulnar, and interosseous arteries. The proximal upper extremity vasculature is demonstrated schematically in Figure 22-24 with detailed text to follow.
Beginning at the subclavian artery, second order branches arise from the main arteries, often with considerable variability. In the setting of arterial occlusive disease, the second order branches form important collateral pathways at the shoulder, upper arm, or elbow to ensure arterial flow to the hand.
Within the hand, a parallel, interconnected system of volar and dorsal arteries also is designed to optimize hand perfusion. This duplicated anatomy forms the basis for examining hand perfusion with a capillary refill test and an Allen’s test (86).
Inflow
With conventional left aortic arch anatomy, the brachiocephalic artery arises as the first artery off the aortic arch and gives origin to the right subclavian artery at the level of the right sternoclavicular joint. The left subclavian artery arises directly from the aortic arch just distal to the left common carotid artery, at the level of the fourth thoracic vertebrae. The subclavian arteries are divided into three segments, each of which can exhibit pathology specific to the individual segment.
The first subclavian artery segment courses vertically and laterally from the ostium, toward the ipsilateral medial border of the scalenus anterior muscle. This segment gives origin to the vertebral artery, internal mammary artery, and thyrocervical trunk. These branches arise in close proximity to each other, near the medial border of the scalenus anterior. On the left, the costocervical trunk also arises from this segment.
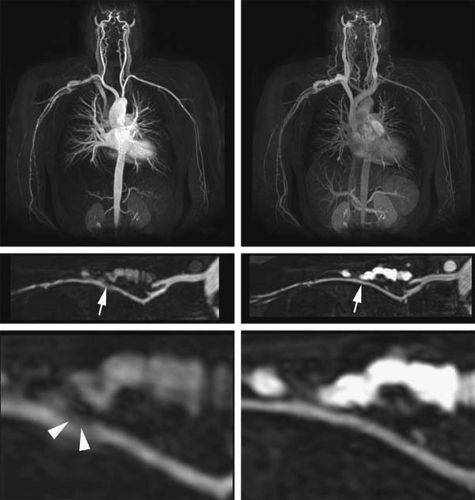 Figure 22-23 Whole-volume MRA MIP of the central thoracic and upper extremity vessels. The upper two panels show whole-volume MIPs of the first and second dynamic phases. The middle two panels are cMPRs showing mild luminal narrowing in the left, arterial phase image (left arrow). Zoomed views of the area with the arrows in the middle two panels more clearly show intra-arterial signal loss due to susceptibility artifacts emanating from the right subclavian vein (arrowheads in lower left panel). The second, mixed arterial and venous phase shows no abnormalities in the subclavian artery (right arrow). |
The thyrocervical trunk gives rise to three main branches, the inferior thyroid artery, the suprascapular artery, and the superficial cervical artery. The inferior thyroid artery supplies the infero-posterior thyroid gland and parathyroid glands. It anastomoses with the ipsilateral superior thyroid.
The suprascapular artery supplies the superior shoulder musculature, including the supraspinatous, infraspinatus, and the subscapular fossa. In addition, the suprascapular artery supplies flow to the acromioclavicular and glenohumeral joints. The suprascapular artery forms anastomoses with the dorsal scapular, thoracoacromial, subscapular, and circumflex scapular arteries.
The superficial cervical artery supplies the trapezius and surrounding muscles. It anastomoses with the descending branch of the occipital artery.
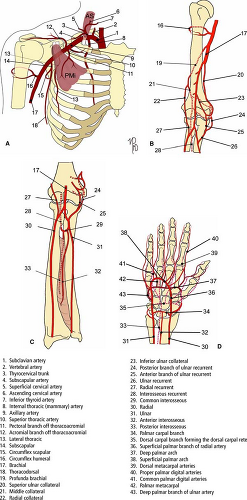 Figure 22-24 Schematic drawing of normal upper extremity arterial anatomy. Illustrated by Nancy Prendergast, M.D. (Adapted from Kadir S. Arterial anatomy of the upper extremities. In: Atlas of Normal and Variant Angiographic Anatomy. Philadelphia: WB Saunders; 1991:63–91.) |
In nearly 30% of cases, the thyrocervical branches may arise independently. In approximately 16%, the trunk may arise with one independent branch. In nearly 50%, the superficial cervical artery may arise together with the dorsal scapular artery (deep cervical artery). In this instance, the common arterial segment, which supplies the superficial cervical and dorsal scapular arteries, is termed the transverse cervical artery. The second segment of the subclavian artery is a short, horizontal portion that is posterior to the scalenus anterior muscle. On the right, the main branch is the costocervical trunk. On the left, more commonly, as mentioned, this branch arises from the first segment. Major subdivisions of the costocervical trunk include the superior intercostal artery and deep cervical artery, to supply the posterior intercostal spaces and posterior neck musculature, respectively. In approximately 10% of cases, the trunk is absent, and the divisions arise directly from the subclavian artery.
The third segment courses downward from the lateral border of the scalene anterior muscle to the outer margin of the first rib, at which point it becomes the axillary artery. The dorsal scapular artery commonly arises from this segment, supplying muscles at the medial border of the scapula. Alternatively, it may arise from the second segment or from the transverse cervical artery. The dorsal scapular anastomoses with the suprascapular and circumflex scapular arteries.
Outflow
In the axilla, the axillary artery extends from the lateral margin of the first rib to the inferior margin of the teres major, at which point it becomes the brachial artery. It is divided into three portions, based on its relation to the pectoralis minor. Each segment usually has at least one branch vessel; however, considerable variation exists. The first segment lies proximal to the pectoralis minor. The superior thoracic artery arises from this segment to supply the first three intercostal spaces by communicating with the intercostal arteries. Less commonly, the superior thoracic artery may be absent or may arise from the thoracodorsal artery.
The second segment lies posterior to the pectoralis minor. The thoracoacromial and lateral thoracic arteries arise from this segment. The thoracoacromial gives origin to pectoral, acromial, clavicular, and deltoid branches. The lateral thoracic artery supplies the lateral chest wall, providing branches to the pectoralis, serratus anterior, and subscapularis muscles. The lateral thoracic may share a common origin with the thoracoacromial or the subscapular.
The third axillary arterial segment is lateral to the pectoralis minor. Its major branches are the subscapular and humeral circumflex arteries. The subscapular artery divides after a short length into the circumflex scapular and the thoracodorsal arteries. The humeral circumflex artery divides into anterior and posterior humeral circumflex arteries. In approximately 10%, the humeral circumflex and subscapular arteries arise from a common origin.
In the upper arm, the brachial artery extends from the lateral border of the teres major to the antecubital fossa, where it divides into radial and ulnar arteries. Major branches of the brachial artery are the brachial profunda, superior ulnar collateral, inferior ulnar collateral, nutrient, and muscular arteries. Distally, the brachial profunda divides into the radial collateral and middle collateral arteries. These arteries anastomose with the radial recurrent
and interosseous recurrent arteries along the anterior and posterior aspects of the lateral epicondyle, respectively.
and interosseous recurrent arteries along the anterior and posterior aspects of the lateral epicondyle, respectively.
The superior ulnar collateral and the inferior ulnar collateral arteries also form anastomotic networks around the elbow. The superior ulnar collateral communicates with the posterior ulnar recurrent artery and the inferior ulnar collateral communicates with the anterior ulnar recurrent artery at the posterior and anterior aspects of the medial epicondyle, respectively.
The inferior ulnar collateral also gives off a branch posterior to the medial epicondyle, which communicates with the superior ulnar collateral and posterior ulnar recurrent arteries. Less commonly, a branch off the superior ulnar collateral may course anterior to the medial epicondyle to communicate with the anterior ulnar recurrent artery.
In the forearm, the radial, ulnar, and interosseous arteries are the major runoff vessels to the hand (Fig. 22-24). Just below the elbow, the brachial artery branches into radial and ulnar arteries. The radial artery courses superficial in the lateral forearm, medial to the brachioradialis, surrounded by skin and fasciae anteriorly. At the radial styloid, the radial artery bifurcates into superficial and deep branches.
The ulnar artery courses in the medial forearm, anterior to the flexor digitorum profundus muscle. Proximally, the ulnar has a deep course surrounded by the pronator teres, flexor digitorum superficialis, flexor carpi radialis, and palmaris longus. Distally, however, it is superficial, surrounded by integument and fasciae.
The ulnar artery crosses into the wrist superficial to the flexor retinaculum and lateral to the pisiform. Immediately distal to the pisiform, the ulnar artery divides into a larger superficial branch and a smaller deep branch.
Regarding the interosseous arteries, a common interosseous artery arises off the proximal ulnar artery and divides into volar and dorsal interosseous branches. These course in the respective interosseous membranes to the wrist. As discussed previously, the radial, interosseous, anterior ulnar and posterior ulnar recurrent arteries are vital for collateral flow around the elbow.
Aberrant anatomy for the radial and ulnar arteries includes anomalous high origin off the axillary or brachial arteries. This occurs more frequently with radial arteries (14% to 17%) as compared with ulnar arteries (2% to 3%). A variant of this is a persistent superficial brachial artery.
Arterial Anatomy of the Hand
In the hand, the arterial anatomy is distinguished by a four arch system. Two are in the carpus, while two are in the palm. The carpal arch system has volar and dorsal components. Single volar or dorsal carpal branches off the radial and ulna anastomose to form the respective carpal arches. The volar interosseous artery drains into both the volar and dorsal carpal arches, while the dorsal interosseous artery only anastomoses with the dorsal carpal arch.
The radial and ulnar arteries communicate to form superficial and deep palmar arches (Fig. 22-24). The deep arch is formed by the anastomosis of the radial and ulnar artery deep branches. The deep branch of the radial artery crosses dorsally in the anatomical snuff box over the scaphoid and trapezium, deep to the abductor pollicis longus and extensor pollicis longus and brevis. The deep branch then courses between the first dorsal interosseous muscles to enter the palm. The radial artery continues along the bases of the metacarpals, until the fifth metacarpal, at which point the radial artery anastomoses with the deep branch off the ulnar artery.
The superficial palmar arch is located approximately 1 cm distal to the deep arch. It is formed primarily from the superficial palmar branch off the ulnar artery, which crosses the palm anterior to the flexor retinaculum. A complete “true” superficial arch is formed when the radial artery superficial branch anastomoses with the ulnar superficial branch. However, this may occur in only one third of cases. More commonly, the superficial arch is completed by the ulnar artery through anastomoses at the digital level or by anastomosis with an artery off the deep arch (i.e., radialis indices).
Regarding the metacarpal and digital arteries, the superficial palmar arch supplies three common palmar digital arteries, and the deep arch supplies three metacarpal arteries. These branches join in the interosseous space and then divide into proper palmar digital arteries, which supply the adjacent digits—ulnar side of the second finger, both sides of the third and fourth fingers, and the radial side of the fifth finger. The ulnar side of the fifth finger is supplied directly by a proper digital artery from the superficial arch, while the thumb and radial side of the second finger are supplied directly from the deep palmar arch.
For the thumb, the princeps pollicis ascends from the deep arch to the base of the thumb and divides into two branches that supply the radial and ulnar sides of the thumb. For the radial side of the second finger, the radialis indices commonly arises from the deep arch. However, the radialis indices may arise from the princeps pollicis. In addition, the radialis indices often has an anastomosis with the superficial arch.
The dorsal carpal arch also plays a role in digital perfusion to all four fingers. The dorsal arch gives origin to three dorsal metacarpal arteries. These course in the second
through fourth dorsal interosseous spaces and divide into paired dorsal digital arteries that extend to the tufts of the fingers. At the distal phalyngeal tufts, the dorsal digital arteries anastomose with palmar digital arteries from the superficial arch.
through fourth dorsal interosseous spaces and divide into paired dorsal digital arteries that extend to the tufts of the fingers. At the distal phalyngeal tufts, the dorsal digital arteries anastomose with palmar digital arteries from the superficial arch.
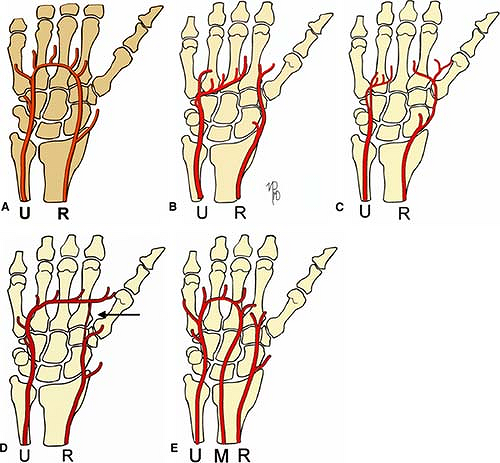 Figure 22-25 Common variants of the arterial anatomy in the hands. A: Classic radioulnar arch. B, C: Examples of incomplete deep palmar arch. D: Complete superficial palmar arch in which ulnar artery is the main contributor that anastomoses with small branch (arrow) of the deep arch in the first digital interspace. E: Mediano-ulnar arch. (U, ulnar artery; R, radial artery; M, median artery. Illustrated by Nancy Prendergast, M.D. Adapted with permission from Kadir S. Arterial anatomy of the upper extremities. In: Atlas of Normal and Variant Angiographic Anatomy. Philadelphia: WB Saunders; 1991:63-91.) |
Communication between the dorsal and palmar systems also occurs by way of proximal and distal perforating arteries between the dorsal metacarpal arteries and the deep and superficial palmar arches, respectively.
The complex and rich vascular network of the vascular anatomy found in the hand is highly variable. In the previous discussion the classic anatomy was emphasized. Some examples of common variants are found in the series of diagrams shown in Fig. 22-25.
Venous System
The upper extremity venous system consists of superficial and deep veins. The superficial veins lie within the superficial fascia, while the deep veins accompany the upper extremity arteries (venae comitans). Valves are present in both the superficial and deep veins, with a greater frequency in the deep system (Fig. 22-26).
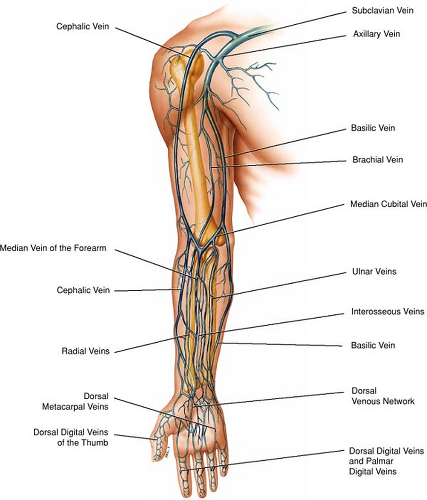 Figure 22-26 Venous anatomy of the right upper extremity. (Reprinted with permission from Uflacker R. Atlas of Vascular Anatomy: An Angiographic Approach. 2nd ed. Philadelphia: Lippincott Williams & Wilkins; 2007.) |
In the hand, forearm, and upper arm, the superficial system is the principal venous drainage, and as a result, overall caliber for these peripheral veins is larger than in the deep system. The smaller deep veins are further distinguished in that they accompany the arteries in pairs. The peripheral superficial and deep venous systems communicate at multiple levels via venous networks and perforating venous connections.
Within the axillae and thorax, major venous drainage occurs only into a deep system as single veins that accompany the adjacent artery. The inlet to these intrathoracic central veins is defined by the costoclavicular space.
Superficial Veins of the Upper Extremity
Beginning at the fingers and extending through the upper arm, the superficial system consists of the dorsal digital veins, dorsal metacarpal veins, dorsal venous plexus, palmar digital veins, palmar venous plexus, median cubital vein, median antecubital vein, cephalic vein, and the basilic vein.
In the hand, dorsal digital veins for the ulnar aspect of the index finger, radial aspect of the fifth finger, and both sides of the third and fourth fingers drain into three dorsal metacarpal veins. These in turn drain into the dorsal venous plexus.
On the radial side of the hand, this plexus is joined by dorsal veins from the thumb and the dorsal vein of the radial aspect of the index finger to form the cephalic vein. On the ulnar side of the hand, the dorsal vein from the ulnar aspect of the fifth finger joins the plexus. The ulnar portion of the plexus then drains into the basilic vein.
The proper palmar digital veins communicate with the dorsal digital veins through intercapitular veins at the metacarpal heads. One route of drainage for the proper palmar digital veins is into the palmar venous plexus over the thenar and hypothenar eminences. This plexus drains into the median antecubital vein.
In the forearm, the cephalic, basilic, median cubital, and median antecubital veins can have variable anatomy. In general, the cephalic and basilic veins course on the radial and ulnar aspects, respectively. Either or both may be dominant. The cephalic vein crosses the ventrolateral antecubital fossa between the brachioradialis and the biceps brachii muscles, while the basilic vein crosses the ventromedial antecubital fossa, between the biceps brachii and pronator teres.
The median cubital vein directly connects the cephalic and basilic veins in the antecubital fossa. These veins may also be connected by a dorsal oblique vein in the forearm. An accessory cephalic vein may be present, joining the cephalic vein below the elbow. This accessory cephalic vein may arise from a dorsal forearm venous plexus or may arise from the cephalic vein above the wrist.
The median antecubital vein courses along the ventromedial forearm. It ends either in the basilic or the median cubital veins. Alternatively, the median antecubital, as with the median cubital vein, may divide into one branch that drains into the basilic (median basilica vein) and the other into the cephalic (median cephalic) vein.
In the upper arm, the basilic and cephalic veins are medial and lateral to the biceps brachii, respectively. The basilic vein ascends initially within the superficial fascia, but then perforates the deep fascia at the mid arm level. The vein then courses on the medial aspect of the brachial artery until the inferior margin of the teres major muscle. At this level, the basilic vein joins the brachial vein to form the axillary vein.
The cephalic vein ascends within superficial fascia entering the infraclavicular fossa posterior to the pectoralis major. The vein then crosses into the clavipectoral fossa with ultimate drainage into the superior aspect of the axillary vein, below the clavicle.
Deep Veins of the Upper Extremity
Peripherally, upper extremity deep veins include the superficial palmar venous arches, deep palmar venous arches, radial veins, ulnar veins, interosseous veins, brachial veins, and the axillary vein. Centrally, the deep veins consist of the subclavian and brachiocephalic veins.
In the hand, in addition to proper palmar digital veins draining into the superficial palmar venous plexus, the proper palmar digital veins also drain into the common palmar digital and palmar metacarpal veins. The common palmar digital veins converge into the superficial palmar venous arches, while the palmar metacarpal veins form the deep palmar venous arches. Palmar metacarpal veins also communicate to the dorsal metacarpal veins via perforating veins. Both pairs of the venous arches parallel the respective arterial arches.
The superficial palmar arches drain into the ulnar veins, and the deep palmar arches drain into the radial veins. Branches from the deep palmar arches and the proximal ulnar and radial veins coalesce to form a carpal venous plexus, which drains into the volar and dorsal interosseous veins.
In the forearm, the radial, ulnar, and interosseous paired veins ascend on either side of their respective companion arteries. Proximal to the elbow, the interosseous veins drain into the ulnar veins, and the ulnar vein gives off a draining branch to the median cubital vein. At the elbow, the radial and ulnar veins coalesce to form the paired brachial veins.
In the upper arm, the paired brachial veins ascend on either side of the brachial artery, receiving small venous branch tributaries. At the level of the teres major, the brachial veins coalesce with the basilic vein to form the axillary vein. The medial brachial vein may join the basilic vein prior to this junction. The axillary vein courses as a single structure to the level of the first rib, medial and inferior to the axillary artery. In addition to the cephalic vein, the axillary vein receives venous tributaries corresponding to the axillary arterial branches.
In the thorax, the subclavian vein extends from the outer margin of the first rib to the level of the clavicular head, where it joins with the internal jugular vein to form the brachiocephalic vein. The subclavian vein lies superior and posterior to the subclavian artery and courses posterior to the scalenus anterior. Important tributaries include the external jugular, anterior jugular, and dorsal scapular veins. The thoracic duct drains into the left subclavian vein at the confluence with the left internal jugular vein, and the right
lymphatic duct drains into the right subclavian vein at the confluence with the right internal jugular vein.
lymphatic duct drains into the right subclavian vein at the confluence with the right internal jugular vein.
The right and left brachiocephalic veins join together to form the superior vena cava, which then drains into the right atrium. The right brachiocephalic vein has a short vertical course and lies anterior and to the right of the brachiocephalic artery. The left brachiocephalic vein has a longer, horizontal course, and lies anterior to the brachiocephalic, left common carotid, and left subclavian arteries. Common tributaries include the vertebral, internal mammary, inferior thyroid, and supreme intercostal veins (85,87,88).
Clinical Applications
Arterial Occlusive Disease
Arterial occlusive disease of proximal upper extremity vessels may be due to atherosclerosis, embolism, inflammatory arteritis, previous radiation therapy, or other iatrogenic causes and trauma. In addition, there are a host of uncommon causes that may manifest themselves with lesions in the upper extremity arterial bed. A prior review of a series with 136 patients requiring operative correction showed atherosclerosis to be the most common cause of occlusive disease in the brachiocephalic artery (89).
In that series, subclavian artery atherosclerosis was associated with distal ischemia; thrombosis of the subclavian artery was due to compression by cervical ribs, arteritis, and the use of this vessel for creation of a Blalock-Taussig operation (subclavian to pulmonary arterial anastomosis).
Axillary and brachial artery lesions were principally caused by trauma (mainly by gunshot wounds, laceration, or blunt trauma). Atherosclerosis, embolism, and radiation injury were also seen in some patients.
The causes of injury to the radial, ulnar, and more distal arteries were trauma, intra-arterial cannulas for measuring blood pressure, and various small vessel diseases (89).
Patients with chronic occlusive disease are generally excellent candidates for imaging with MDCT or MRA. Patients with acute ischemia, on the other hand, present an emergency situation; the decision to obtain an imaging test is based on clinical grounds and the presumed etiology of the occlusion.
In patients with a suspected embolus or thrombosis, immediate endoluminal evaluation/treatment or surgical exploration is indicated. Despite the excellent capabilities of MDCT and MRA, there is, however, a paucity of literature on upper extremity imaging with cross-sectional modalities other than duplex ultrasonography.
Because of the abundant collateral pathways, lesions of the brachiocephalic vessels often do not present with upper extremity claudication, in contrast to occlusive lesions in the proximal arteries supplying the lower extremities.
Although some patients may present with arm claudication, cerebral symptoms resulting from perfusion changes (i.e., subclavian steal syndrome) and embolization of thrombi generated at the site of ulcerated lesions are actually the most important reasons for referral.
The subclavian steal syndrome occurs when use of the upper extremity increases its demand for blood and the arm “steals” it from the cerebral circulation through the ipsilateral vertebral or brachiocephalic artery. It is important to realize that not all patients with an angiographic steal phenomenon are symptomatic. In fact, only about one third of all patients with angiographically proven steal syndromes suffer from characteristic complaints (90,91,92).
MRA offers a comprehensive assessment combining a depiction of the arterial stenosis and the ability to depict reversed flow in the vertebral artery (Fig. 22-27).
A recent review by Azakie et al. (3) of 94 cases of symptomatic atherosclerotic occlusive disease of the brachiocephalic artery found that 85 of 94 patients (88%) presented with symptoms of cerebral hypoperfusion (n = 52; 55%) combined with transient ischemic attack (n = 40; 43%) or stroke (n = 5; 5%). Right upper extremity claudication and digital embolization were the presenting symptoms in only 26 of 94 patients (28%).
Exact delineation of the site of occlusive disease is important from a therapeutic point of view, as many vascular surgeons prefer extrathoracic procedures to intrathoracic endarterectomy or bypass procedures, except in the management of complex occlusive disease of two or more major vessels.
The options for repairing brachiocephalic lesions are percutaneous transluminal angioplasty (PTA), and stenting, when needed, or surgical procedures such as endarterectomy, aortobrachiocephalic (or carotid or subclavian) bypass grafting through a median sternotomy, and axilloaxillary bypass.
Left subclavian lesions can be repaired by PTA, by carotid-subclavian bypass, or subclavian-carotid reimplantation. On the right side, PTA, subclavian endarterectomy and carotid-subclavian bypass are possible alternatives.
Common carotid occlusion can be repaired by endarterectomy on the right side, but subclavian to carotid bypass is usually a simpler procedure. Multiple lesions of the arch vessels can be repaired with PTA or bypass grafts from the aortic arch.
In general, PTA and surgery for aortic arch branch vessel disease have good long-term success rates, with better results being reported for surgery. Reported long-term primary patency rates for PTA in two recent, large series
were 72% (n = 38) (93), and 93% (n = 89) (94). In the 94 surgical cases studied by Azakie et al. (3), postoperative survival rate was 96% at 1 year, 85% at 5 years, and 67% at 10 years. Freedom from recurrence requiring operation was 100% at 1 year, 99% at 5 years, and 97% at 10 years (3).
were 72% (n = 38) (93), and 93% (n = 89) (94). In the 94 surgical cases studied by Azakie et al. (3), postoperative survival rate was 96% at 1 year, 85% at 5 years, and 67% at 10 years. Freedom from recurrence requiring operation was 100% at 1 year, 99% at 5 years, and 97% at 10 years (3).
 Figure 22-27 Subclavian steal. A: VR image from a gadolinium-MRA study shows a stenosis and short segment occlusion of the prevertebral left subclavian artery (large white arrow) and flow in the poststenotic segment of the left vertebral artery (short arrow). B: 2D TOF with a saturation band placed above the slice suppresses flow in a cranial-caudad direction, resulting in selective demonstration of the right and left common carotid arteries and only the right vertebral artery; note the absence of flow in the left vertebral artery. C: 2D TOF with a saturation band placed below the slice suppresses flow in the caudad-cranial direction, and shows flow in the veins and retrograde flow in the left vertebral artery (arrow), identifying subclavian steal physiology. |
The choice for either PTA or surgery should be made on an individual basis, weighing the additional risks of surgery versus the lower long-term patency of PTA. At present, PTA will often be attempted first. Both techniques carry similar small risks for stroke (3,93,94).
Stay updated, free articles. Join our Telegram channel

Full access? Get Clinical Tree


