Thoracic Vascular Anomalies
Marilyn J. Siegel
James P. Earls
Since their introduction, computed tomography (CT) and magnetic resonance imaging (MRI) have been widely used for evaluating both congenital and acquired abnormalities of the thoracic great vessels. Both imaging methods can clearly demonstrate the morphology of the aorta, systemic veins, and pulmonary vascular supply, and in many clinical scenarios, they have reduced the need for angiography. Each method has its strengths and limitations. Regardless of the imaging method used, however, the technique of performing the examination is crucial to its diagnostic performance.
This chapter highlights the use of CT and MRI for evaluating congenital anomalies of the thoracic great vessels. Various CT and MRI techniques are addressed, with an emphasis on angiography, and the rationale for choosing between CT and MRI as well as other imaging studies in different clinical situations is explained. The clinically relevant embryology and anatomy of the systemic and pulmonary vasculature and the CT and MRI appearances of important congenital anomalies involving these vessels are detailed.
Methods for Imaging the Thoracic Great Vessels
There are a number of imaging methods available for investigating a suspected mediastinal vascular anomaly, all of which have advantages and disadvantages. Recognition of the strengths and limitations of these studies is crucial in order to decide which examination is appropriate for a specific patient and clinical scenario.
For many years, chest radiography, echocardiography, and catheter angiography were the only proven diagnostic methods for evaluating disorders of the thoracic vessels. In the last two to three decades, however, CT and MRI also have been shown to be essential tools in the radiologic evaluation of the systemic and pulmonary vessels. Both cross-sectional techniques are particularly useful in establishing the diagnosis of a vascular abnormality, evaluating its full extent, and detecting the presence of associated abnormalities (1,2,3).
In many instances, plain chest radiography still remains the method of choice for the initial detection of a thoracic vascular anomaly, as it is simple, readily available, and inexpensive and can serve to confirm the presence and position of an arch abnormality, an anomalous vessel coursing through the pulmonary parenchyma, and abnormal pulmonary vasculature. Although such information may be helpful in planning other investigative procedures, the plain radiograph often is not diagnostic and cannot precisely characterize vascular anomalies or determine their extent.
With improvements in techniques, echocardiography is still useful for evaluating thoracic anomalies in neonates and infants, but its use in adults is largely limited because of its small field of view and lack of an adequate acoustic window. Transesophageal echocardiography has overcome some of these deficiencies. The close proximity of the esophageal probe to cardiac and aortic structures has resulted in improved image quality in the evaluation of the aortic arch and descending aorta. However, this technique is somewhat invasive, has potential morbidity, and still has limitations in examining the distal ascending aorta and its branch vessels and the pulmonary vessels. Therefore, it has not gained widespread use as a primary diagnostic imaging tool.
Catheter angiography still remains a first-line tool for providing accurate anatomic definition of many intra- and extracardiac abnormalities, but it is not without significant risk. The results of multi-institutional studies have shown the frequency of complications associated with cardiac catheterization to be as high as 10%, with vascular access complications being the most common. The usual major complication is arrhythmia, with death occurring at a rate of 0.1% to 0.5% (4). Virtually all patients undergoing catheter angiography require sedation, and some patients require active airway support. Conventional angiography also results in exposure to both relatively high radiation doses, which is particularly problematic in young children, and relatively high volumes of contrast material. With technical improvements in noninvasive diagnostic studies such as echocardiography, CT, and MRI, the performance of conventional catheter angiography is now largely restricted to those situations where the results of noninvasive studies are equivocal or when hemodynamic assessment is needed.
The cross-sectional depiction of vascular anatomy achieved with CT and MRI has transformed the diagnostic investigation of suspected vascular pathology. These techniques are superior to echocardiography for evaluating thoracic vessels because they can provide images unobscured by overlying structures such as gas-filled lung or bone. Compared with conventional angiography, abnormalities are shown to better advantage on both CT and MRI because of the ability of these techniques to separate structures that may be superimposed on angiography. The volumetric acquisition of CT and MRI allows clear delineation of the aorta, superior vena cava, and pulmonary arteries and veins and their branches. Other advantages over conventional angiography include shorter acquisition times, superior three-dimensional (3D) renderings, and greater range of coverage, which increases the conspicuity of vascular lesions. In addition, compared with the radiation dose for angiography, the radiation dose for CT angiography is at least two to three times less.
The introduction of multidetector-row CT has been largely responsible for the increasing utilization of this
technique in imaging the thoracic vessels in adults and children (1,2). The advantages of multidetector-row CT, compared with single detector CT, include improved temporal and spatial resolution, greater anatomic coverage, more consistent contrast enhancement, and higher quality reconstructions. These benefits have dramatically expanded the applications of CT in the evaluation of vascular diseases of the thorax.
technique in imaging the thoracic vessels in adults and children (1,2). The advantages of multidetector-row CT, compared with single detector CT, include improved temporal and spatial resolution, greater anatomic coverage, more consistent contrast enhancement, and higher quality reconstructions. These benefits have dramatically expanded the applications of CT in the evaluation of vascular diseases of the thorax.
CT is gaining increasing acceptance as an alternative method to MRI in the diagnosis of vascular anomalies. An important advantage of CT angiography over MR angiography relates to the shorter scan time, which means reduction in the need for sedation in the pediatric population and the ability to scan extremely ill patients who cannot tolerate the long imaging times for MR examinations. However, CT is not without certain drawbacks. One significant limitation, especially compared with MRI, is the exposure to ionizing radiation, but in the critically ill patient, the risk of a prolonged MR examination may be greater than that of radiation. Other limitations of CT are the use of intravenous contrast material, which needs to be avoided in patients with known allergies and in other patients with renal compromise, and the inability to provide functional data. In such settings, MRI is recommended.
MRI, like CT, can provide a wealth of morphologic and functional information in an accurate and noninvasive fashion without the use of ionizing radiation (3). The great vessels and pulmonary circulation can be easily evaluated, and detailed assessment of anatomy, size, and function are accurately obtained. Like elsewhere in the body, MR offers superior parenchymal imaging characteristics and is by and large able to portray more subtle differences in tissues than CT, ultrasound (US), or other noninvasive imaging techniques. Images can also be acquired in any axis, optimizing the in-plane resolution for structures that may have complex orientation and geometry.
Unlike CT, there are no known permanent adverse biological effects from MRI. Transient effects of tissue heating and peripheral nerve stimulation can be easily monitored and controlled by limiting the system’s radio frequency (RF) power deposition. The most commonly used MR contrast media, the gadolinium chelates, have very safe adverse event profiles and can be employed safely in patients with renal insufficiency (5).
There are many techniques available for imaging the thoracic vessels. Most studies use a combination of 2D “dark blood,” cine “bright blood,” and 3D contrast-enhanced MR angiography. Additional sequences are also performed as needed for functional analysis; most commonly a velocity-encoded cine PC technique is employed.
MR systems have evolved fairly rapidly in the last several years. Advances in hardware and software have increased the rate of data acquisition, reducing scan times considerably. Higher gradient strength and faster slew rates continue to push the envelope of MR techniques well beyond what was achievable just a few years ago. Many sequences have imaging times of less than 1 second per slice, and several new techniques for dynamic studies have acquisition times approaching 0.02 to 0.05 seconds (20 to 50 msec) per slice. Complete sequences covering the entire chest can now be acquired in the time allowed for a routine breath hold. Some high performance systems are now fast enough for time-resolved “4D MRA” techniques that acquire multiple dynamic 3D MR angiographic images of the thorax in a single breath hold (Fig. 15-1).
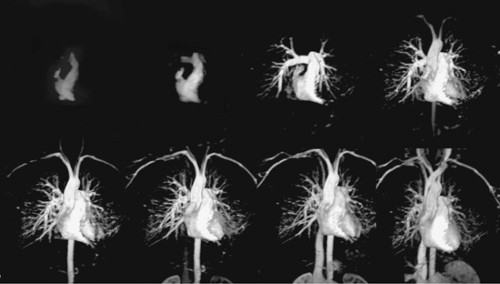 Figure 15-1 Time-resolved CEMRA of the thoracic aorta. High-speed gradients and parallel imaging techniques have reduced the acquisition time of each 3D volume set to 3 seconds. This allows for a dynamic study depicting various phases as the contrast circulates from the pulmonary arteries to the systemic arteries to the systemic veins. |
New eight-channel and higher systems continue to increase the spatial and temporal resolution of the studies. Many older techniques such as spin echo and cine fast gradient echo (cine GRE) have been replaced by faster and more robust techniques such as dual inversion recovery T2 (DIR) and steady state free precession (SSFP). These new sequences have fewer artifacts and better imaging characteristics, and they are acquired much more rapidly than the techniques they replaced.
While very rapid comprehensive assessments of the thoracic aorta, requiring less than 4 minutes, have been reported, most thoracic MR angiographic studies currently take 20 to 30 minutes (6). These examination times, however, are short enough to decrease patient motion, which improves study quality and reduces the rate of repeat examinations, and increase patient throughput.
Technical Aspects of Computed Tomographic Angiography
An understanding of the technical factors for performing CT angiography, including anatomic coverage, contrast administration, acquisition parameters, and reconstruction techniques, is essential in order to achieve consistently high-quality results. This section describes a practical approach for optimizing each of these factors.
Anatomic Coverage
One of the initial steps in performing thoracic CT angiography is to select the anatomic coverage needed to address the clinical question. At a minimum, the anatomic coverage should extend from just above the thoracic inlet so that the proximal portions of the vascular structures in the neck are included in the CT scan. Caudally, the scan should extend at least 1 to 2 cm below the diaphragm. A greater degree of coverage may be needed in some clinical settings. For instance, in the evaluation of sequestration, imaging through the upper abdomen is often necessary because the anomalous artery may rise from the upper abdominal aorta. Similarly, a greater degree of abdominal coverage is needed when assessing hemiazygous continuation of the inferior vena cava.
To ensure that all important anatomic structures are included in the CT angiogram, the study begins with a frontal topogram of the chest and upper abdomen. Nonenhanced axial scans are not routinely acquired. However, in some clinical scenarios, nonenhanced scans should be acquired. Specifically, when a bicuspid aortic valve is a diagnostic consideration, nonenhanced views can be valuable for identifying valvular calcification. Nonenhanced scans are also useful in the evaluation of surgical shunts to assess for contrast leakage and calcification.
Contrast Medium
The goal in optimizing contrast delivery is to achieve the highest contrast enhancement with the least amount of contrast material. However, no single approach to contrast administration is effective in all patients, as there are several factors that influence the degree of contrast enhancement. These factors can be divided into three major groups: the patient, the contrast injection, and the scan factors.
Patient factors that influence contrast enhancement are the patient’s body size, cardiac output, renal function, and route of vascular access. Factors related to the contrast injection include the volume and concentration of the contrast material, the type of injection technique (power injector or manual injection), and the flow rate. Factors related to scanning are the delay between the start of the contrast injection and the initiation of scanning, the method of triggering the examination (empiric, bolus tracking, or a test injection), and whether scanning should be performed during multiple phases of contrast enhancement.
Optimal vascular enhancement for thoracic CT angiography requires a fast injection of contrast medium via a power injector at a high flow rate of 3 to 4 mL per second. A contrast volume of 100 to 150 mL with concentrations of 280 to 320 mg I/mL usually results in an excellent degree of vascular opacification.
The contrast material is given through a 20- or 22-gauge antecubital vein. Because CT angiography requires high flow rates and large volumes of contrast, the iodinated contrast medium should be nonionic. The use of nonionic agents minimizes gastrointestinal side effects (nausea and vomiting), discomfort at the site of injection, patient motion during intravenous contrast administration, and complications arising from contrast extravasation (7,8).
The delay time between the start of the contrast injection and the initiation of data acquisition is one of the most important factors in optimizing contrast delivery in CT. To time image acquisition, we use real time bolus tracking (Fig. 15-2). This method monitors the attenuation value of a target vessel during the contrast injection and displays the attenuation graphically in a real time fashion. Once the desired attenuation value, usually 120 HU, is reached, the scan sequence is automatically triggered. An alternative method of initiating the CT angiogram is the use of an empiric delay of 25 to 30 seconds after the start of the injection. Empiric timing is used mainly as a default method if the bolus tracking fails to trigger. A third method to time image acquisition is the use of a 15- to 20-mL test bolus of contrast material administered at a rate of 3 to 4 mL
per second. After an 8- to 10-second delay, images are acquired every 2 seconds for a total of 30 seconds. A time-attenuation curve is generated, and the image with the greatest contrast density is used to select the time delay. Although a test bolus is effective, it is more time consuming than the alternative methods and has the added disadvantage of an increased radiation exposure and a slight increase in background attenuation value because of the test-bolus injection. In our experience, bolus tracking has proved most reliable for timing scan initiation.
per second. After an 8- to 10-second delay, images are acquired every 2 seconds for a total of 30 seconds. A time-attenuation curve is generated, and the image with the greatest contrast density is used to select the time delay. Although a test bolus is effective, it is more time consuming than the alternative methods and has the added disadvantage of an increased radiation exposure and a slight increase in background attenuation value because of the test-bolus injection. In our experience, bolus tracking has proved most reliable for timing scan initiation.
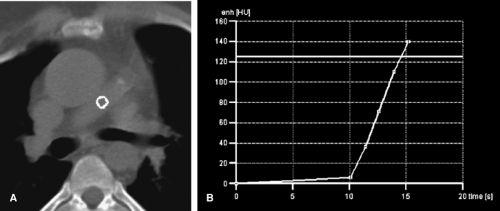 Figure 15-2 Automated computer technique for contrast administration. A: After an initial scout topogram is obtained, a cursor is placed within the region of interest, in this case, on the pulmonary artery. B: Graphic display of time (x-axis) and enhancement in HU (y-axis) after the initiation of the low-dose sampling scans. Scan initiation begins when the threshold level of 120 HU is reached. |
Computed Tomographic Angiographic Acquisition Parameters
Thoracic CT angiography should be performed with a 0.5 to 1.5 collimation thickness and a fast table speed (24 to 36 mm) per rotation. The gantry rotation time should be the lowest possible to minimize the duration of the CT acquisition. CT angiography should be performed with a single breath hold.
Image Reconstruction
Reconstruction thicknesses for axial viewing are 1 to 5 mm, depending on the clinical scenario. For example, if arch positioning is of clinical interest, then images at 5-mm thickness usually suffice for diagnosis. If thrombus within a surgical systemic-to-arterial shunt or the presence of a small anomalous vessel is of clinical concern, then 1-mm reconstructions may be more appropriate.
The reconstruction field of view should be minimized to include only the relevant anatomic structures. A standard reconstruction algorithm is used to reconstruct the enhanced data set. This algorithm minimizes noise in the data set and therefore can optimize the creation of 3D images. Images should also be viewed with a high-resolution
algorithm if associated abnormalities of the airways are suspected.
algorithm if associated abnormalities of the airways are suspected.
Two- and Three-dimensional Rendering Techniques
Axial images are usually sufficient for diagnosis, but multiplanar or 3D reconstructions, particularly when viewed in a cine mode, provide better anatomic detail about anatomic relationships between the great vessels and adjacent soft tissue structures and the tracheobronchial tree. There are a number of 3D reconstruction techniques available to reconstruct the volume data (9,10,11,12,13). A detailed description of the various rendering techniques is beyond the scope of this chapter and has been described elsewhere in this book. However, a brief review of the various reconstruction techniques is presented below.
Multiplanar Reformatting
Multiplanar reformatting—the simplest reformation technique—is used to assess the extent of disease processes in the craniocaudal direction. Its advantages are that it is fast; it can be easily performed at the CT scanner; and it uses all of the attenuations in the data set, presenting them in off-axis views. The major disadvantage of this technique is that it provides only a 2D display of data; thus, it lacks depth cues. However, it does provide a quick road map of an abnormality and can be used to provide information about the nature of a disorder almost immediately after examination.
Shaded-surface Display
The shaded-surface representation displays data in a 3D format based on an assigned threshold. All structures within the threshold range are displayed, while other tissues are deleted. The principle application of the shaded-surface display is the evaluation of osseous structures of the thorax.
Variable Thickness Maximum and Minimum Intensity Projections
Small peripheral vessels and airways are often better seen as an assimilation of sections in a volume slab rather than in individual sections of equivalent thickness (12). The variable thickness technique uses thin collimation (1 mm) and low milliamperage and then combines the volumetric data in multiples or “slabs” to create a thicker image. The volume slab technique can be used with either maximum-intensity projections (MIP), which display data based on the maximum attenuation value, or minimum-intensity projections (MINIP), which display data based on the minimum attenuation value. The former has been applied to the examination of pulmonary vessels, while the latter technique can be used to enhance evaluation of the airways. The variable thickness technique does not replace volume rendering, but it can be useful in demonstrating vascular anatomy at the subsegmental level. In particular, it can be useful to demonstrate small arteriovenous malformations in the lung.
Volume Rendering
Volume rendering (VR) has largely replaced other 3D reformatting techniques in evaluating vascular pathology. Whereas the shaded-surface display and the MIP and MINIP reconstructions use only a portion of the attenuation values and their spatial relationships, VR uses the entire attenuation composition and spatial relationships in the data set. The user can interactively alter the window width and level in order to customize the display and rapidly achieve a variety of attenuation ranges. Opacity and brightness also can be altered. Both can be varied from 0% to 100%. Opacity refers to the degree in which structures close to the user obscure structures that are farther away. Higher opacity values produce an appearance similar to surface rendering. Lower opacity values allow a transparency view that is useful to evaluate the lumen of the airway. Brightness settings affect the appearance of the image and are largely based on the preference of the individual user. A setting of 100% usually is adequate for all applications.
Special Considerations for Pediatric Patients
Pediatric patients have several inherent problems that are not present in adults, in particular, patient motion, small body size, lack of perivisceral fat, and increased sensitivity to radiation exposure. These problems can be minimized or eliminated by the appropriate use of sedation and intravenous contrast medium, and by the selection of optimal technical factors for performing the CT examination (14,15,16,17).
Sedation
As the speed of CT increases, the need for sedation in the pediatric age group decreases (18). Although the frequency has diminished, sedation has not been eliminated. Sedation will likely still be required for some infants and children 5 years of age and younger to prevent motion artifacts during scanning. Children older than 5 years of age generally will cooperate after verbal reassurance and explanation of the procedure and will not need immobilization or sedation.
Standards of care for sedation are based on recommendations from the Committee on Drugs, the American Academy of Pediatrics (AAP), and the American Society of Anesthesiologists (ASA) Task Force (19,20). Sedation for imaging examinations is nearly always conscious sedation. Conscious
sedation is defined as a minimally depressed level of consciousness that retains the patient’s abilities to maintain a patent airway, independently and continuously, and respond appropriately to physical stimulation and/or verbal command.
sedation is defined as a minimally depressed level of consciousness that retains the patient’s abilities to maintain a patent airway, independently and continuously, and respond appropriately to physical stimulation and/or verbal command.
The sedatives used most widely for CT are oral chloral hydrate and intravenous pentobarbital sodium. Oral chloral hydrate (Pharmaceutical Associates, Inc., Greenville, S.C.) is the drug of choice for children younger than 18 months. It is given in a dose of 50 to 100 mg/kg, with a maximum dosage of 2,000 mg. Onset of action is usually within 20 to 30 minutes. Intravenous pentobarbital (Nembutal, Abbot Laboratories, North Chicago, IL) is preferred in children 18 months of age and older. Intravenous pentobarbital, up to 6 mg/kg, with a maximum dose of 200 mg, is injected slowly in aliquots, starting at 2 to 3 mg/kg, and is titrated against the patient’s response. Onset of action is usually within 5 to 10 minutes.
Patients who are to receive parenteral sedation should have no liquids by mouth for 3 hours and no solid foods for 6 hours prior to their examination. Patients who are not sedated but are to receive intravenous contrast medium should be NPO (nothing per mouth) for 3 hours to minimize the likelihood of nausea or vomiting with possible aspiration during a bolus injection of intravenous contrast medium.
Regardless of the choice of drug, the use of parenteral sedation requires personnel experienced in maintaining adequate cardiorespiratory support during and after the examination. Intravenous access must be continuously maintained, and continuous monitoring of vital signs must be performed and recorded.
Intravenous Contrast Medium
The performance of CT angiography administration in children requires that an intravenous line be placed. The largest-gauge cannula that can be placed is recommended. An antecubital catheter is preferred, but this is usually not possible in neonates and small infants. Ideally, intravenous access should be in place before the child arrives in the CT suite. This reduces patient agitation that otherwise would be associated with a venipuncture performed immediately prior to administration of contrast material and thus increases patient cooperation.
The contrast volume is 2 mL/kg (not to exceed 4 mL/kg) with concentrations of 280 to 300 mg I/mL (21). The use of nonionic contrast medium is now standard accepted practice. The advantages of nonionic agents over ionic agents in children are similar to those in adults and include less discomfort at the injection site, fewer side effects such as nausea and vomiting, and decreased patient motion during contrast administration.
Intravenous contrast medium can be administered with a power injector or manual (hand) injection. The benefits of power injection over manual injection are the uniformity of enhancement and the ability to determine precisely the timing of contrast delivery. A power injector is used when a 22-gauge or larger cannula can be placed in an antecubital vein. The contrast injection rate is determined by the caliber of the intravenous catheter. Suggested flow rates are 1.5 to 2.0 mL per second for a 22-gauge catheter and 3.0 mL per second for a 20-gauge catheter. The site of injection is closely monitored during the initial injection of contrast in order to minimize the risk of contrast extravasation. A power injection also can be used to administer contrast media via a central venous catheter if the rate of injection is slow (1 mL per second).
Although a power injector is preferred for the intravenous delivery of contrast material, a manual injection is used when intravenous access is via a catheter placed in the dorsum of the hand or wrist. The contrast is injected as quickly as possible. The ability to inject quickly is affected by the viscosity of the contrast material, which increases directly with high iodine concentrations. This is probably the main reason for the use of contrast with lower iodine concentrations in children. The complication rates from manual and power injections are similar (<0.4%), provided that the catheter is properly positioned and functions well (22).
Scan Delay Time
As in adults, the determination of the scan initiation time can be made by an empiric method, bolus-tracking method, or test bolus of contrast material (14,15,16,17,21). In pediatric patients weighing less than 10 kg, we use an empiric scan delay of 12 to 15 seconds after the start of the intravenous contrast injection. A bolus-tracking method can be used in very small patients, but it may not always trigger scan initiation because of the intrinsically small volumes of contrast material that can be administered.
Precontrast scans and multiphasic imaging are not routine for CT angiography in children in order to minimize the radiation dose. The exceptions are the evaluation of endoluminal stents for repair of coarctation and systemic-to-pulmonary surgical shunts. In these scenarios, calcification around the graft, which can mimic an endoleak on the contrast-enhanced scans, will be seen best on nonenhanced scans. High-attenuation thrombus also can be seen on the nonenhanced CT scans.
Breath-hold Techniques
CT examinations are performed with breath holding at suspended inspiration in cooperative patients, usually children
over 5 to 6 years of age. Scans are obtained during quiet respiration in children who are unable to cooperate with breath-holding instructions and in patients who are sedated.
over 5 to 6 years of age. Scans are obtained during quiet respiration in children who are unable to cooperate with breath-holding instructions and in patients who are sedated.
Table 15.1 Milliamperage and Kilovoltage Settings versus Patient Weight | |||||||||||||||||||||
|---|---|---|---|---|---|---|---|---|---|---|---|---|---|---|---|---|---|---|---|---|---|
|
Radiation Dose
For CT of the thorax in children, it is critical to tailor the selection of CT parameters, including milliamperage and kilovoltage, to patient size (23,24,25,26,27). Additionally, multiphasic studies should be performed only when necessary, rather than being used as a routine protocol.
The tube currents recommended for thoracic CT examinations in children are shown in Table 15-1. In neonates and infants weighing less than 15 kg, the maximal suggested dose is 25 mA. This limit gradually increases until the patient reaches approximately 50 kg, when it becomes possible to use adult radiographic standards. Another factor to consider is kVp. In patients weighing less than 50 kg, 80 kVp can be successfully used. In patients who weigh 50 kg or more, the kVp should be increased to 100 or 120. The use of 80 kVp in smaller patients (compared with the standard 120 kVp protocols) decreases the radiation dose by approximately 30% with better contrast visualization (27).
Technical Aspects of Magnetic Resonance Angiography
MR is a flexible and accurate method for depicting cardiovascular morphology and for quantitating vascular function. Numerous techniques have been developed to depict the structure and blood flow within the heart, pulmonary arteries, and the great vessels. Both unenhanced and gadolinium-enhanced methods are available, and many examinations use a combination of approaches to obtain a comprehensive evaluation of the vasculature. Three-dimensional contrast-enhanced MR angiography (CEMRA) is a fast sequence that generates a 3D data set with high signal to images of the intravascular space following a rapid bolus of gadolinium chelate. Noncontrast-enhanced methods are generally referred to as “black blood” and “bright blood” techniques, depending on the signal intensity of the blood within the vessels.
Special Considerations for Pediatric Patients
There are several considerations that need to be addressed for pediatric patients prior to start of an MR scan. Choice of imaging coils can have significant impact on image quality. Because small children and infants require very small field-of-view to obtain adequate spatial resolution, local or phased array coils are required for the study. Infants can often be scanned within the head coil. This provides sufficient space for the child while guaranteeing satisfactory signal-to-noise ratios (SNR) for the examination. Larger children are usually imaged within the torso or cardiac coils. Use of the body coil, especially in children, should be avoided because of lower SNRs.
Sedation is still required for the majority of MR studies of infants and children 5 years of age and younger to prevent motion artifacts during scanning. Older children can usually be scanned successfully as long as there is continued verbal reassurance and explanation of the procedure. Some developmentally delayed older children may still require sedation for MR studies, and they need to be evaluated on an individual basis. Children undergoing conscious sedation should have no liquids by mouth for 3 to 6 hours and no solid foods for 6 hours prior to their study. Conscious sedation requires the presence of health care providers trained in maintaining adequate cardiorespiratory support during and after the examination. Patients’ vital signs are continuously monitored and recorded throughout the procedure and through the recovery period.
Contrast-enhanced Magnetic Resonance Angiography
CEMRA is a fast, accurate, and flexible method for noninvasive imaging of the arterial and venous system. In the 10 years since its development, the method has been continually refined (28,29). Because of its great clinical utility, it migrated from academic centers into the community within a short period of time and is now the workhorse of non-neurological vascular MR imaging. In patients with complex anomalies involving the thoracic vessels, CEMRA can be useful for simultaneous evaluation of both arterial and venous anomalies as well as complications of surgical intervention (Fig. 15-3).
CEMRA is performed by acquiring a 3D gradient echo sequence following a rapid bolus of gadolinium. It is both reliable and relatively easy to perform given the automation and speed of current MR systems. Unlike iodinated contrast agents, gadolinium chelates can be used safely, even at high doses, in patients with renal failure (5). CEMRA
depicts the relevant arteries and, when desired, venous structures in a 10- to 30-second acquisition, depending on the strength and other technical factors of the MR system used for the study. This can be performed during a breath hold if the patient is nonsedated and able to comply with breath-holding instructions.
depicts the relevant arteries and, when desired, venous structures in a 10- to 30-second acquisition, depending on the strength and other technical factors of the MR system used for the study. This can be performed during a breath hold if the patient is nonsedated and able to comply with breath-holding instructions.
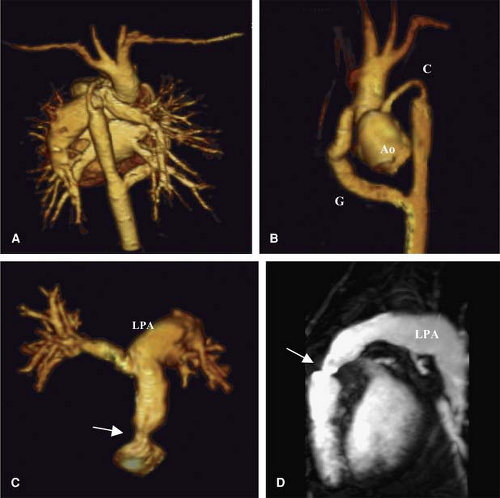 Figure 15-3 Complex thoracic vascular disease depicted with CEMRA in a patient with a truncus arteriosus, interrupted aortic arch, and multiple prior surgeries. A: Volume rendering of entire 3D data set depicts numerous overlapping structures. B: Postprocessed volume rendering of the arterial system depicts enlargement of the ascending aorta (Ao), a small transverse arch conduit (C), and a large ascending aorta to descending aorta bypass graft (G). C: Volume rendering of the pulmonary arteries depicts stenosis at the level of the pulmonary valve (arrow) and enlargement of the left PA (LPA). D: Sagittal MIP of the pulmonary artery confirms the proximal stenosis (arrow) and the dilatation of the left PA (LPA). |
For most thoracic cardiovascular applications, a 3D spoiled gradient echo (SPGR) volume that includes the heart, pulmonary arteries, thoracic aorta, and proximal great vessels is used. The parameters for the 3D SPGR sequence are optimized to attain the highest-quality images. In general, faster is better for data acquisition with 3D CEMRA, and low temporal resolution (TR) and echo time (TE) values are usually selected. Too much spin dephasing can cause signal loss at stenoses, although this can be reduced or eliminated by selection of a TE less than 3 msec. Faster data acquisitions allow the gadolinium contrast material to be injected with a higher injection rate, producing a higher arterial gadolinium concentration and optimized enhancement of the relevant anatomy. The high arterial signal to noise (S/N) may then compensate for reduced T1 relaxation and signal averaging.
Fast data acquisition minimizes motion artifacts and makes it easier for patients to successfully suspend breathing for the entire data acquisition window. In addition to
minimizing TR and TE, one needs to select the smallest number of sections sufficient to cover the arterial anatomy and to keep the acquisition time to a minimum. Widening the bandwidth also makes the acquisition faster, but it may also reduce S/N, especially if a very small field-of-view is used, as required for small children and infants. The signal of background tissue is also reduced or eliminated by obtaining a 3D data set “mask” before gadolinium administration to use for digital subtraction (30).
minimizing TR and TE, one needs to select the smallest number of sections sufficient to cover the arterial anatomy and to keep the acquisition time to a minimum. Widening the bandwidth also makes the acquisition faster, but it may also reduce S/N, especially if a very small field-of-view is used, as required for small children and infants. The signal of background tissue is also reduced or eliminated by obtaining a 3D data set “mask” before gadolinium administration to use for digital subtraction (30).
Contrast-enhanced Magnetic Resonance Angiography in Pediatric Patients
In young children who are either sedated or are unable to perform a successful breath hold, we have altered our CEMRA technique to help minimize artifacts associated with respiration. Rather than reduce acquisition time by using a partial Fourier technique, as done with older children and adults, we have effectively lengthened the acquisition time by sampling all of the k-space. This allows for effective signal averaging, reduces motion related artifacts, and increases the SNR. Because children have rapid circulation times, it is difficult or impossible to obtain a pure arterial phase acquisition with this approach. The veins are often enhanced to the same degree as the arteries. To generate only arterial-phase images, the veins can be removed by postprocessing techniques. Often, especially in cases of complex congenital heart disease, it is very useful to have the veins and arteries enhanced simultaneously because it helps depict the anatomical relationship between the structures.
The flip angle of the 3D sequence is optimized for T1 contrast on the basis of the repetition time and expected blood gadolinium concentration. In practice, a flip angle of 30 to 45 degrees works well in nearly all cases. The flip angle may need to be larger for higher doses of contrast material and longer repetition time or smaller for lower doses of contrast material and shorter repetition time. Zero filling in the section direction is useful because it doubles the number of sections, which is useful for image reconstruction, without increasing imaging time.
The imaging volume is prescribed to depict all of the relevant anatomy while minimizing the actual acquisition time. In almost all cases, a coronal imaging volume is used, the exception being larger children or adults in whom the thoracic aorta is the only region of interest. In the latter scenario, a sagittal imaging volume is used.
Timing of Contrast Infusion
In larger patients, correct timing coordination of the bolus injection with peak vascular enhancement during acquisition of central k-space data is essential for good quality studies. There are several ways to time contrast delivery. Each has its own advantages—the best guess method is simplest, the automated detection method is the most operator independent (31), and the timing run method is the most reliable (32). Fluoroscopic triggering, although not yet widely available, is reliable and fast for achieving optimal enhancement in every case (33,34,35). As MR systems become faster, 4D MRA will likely become the dominant method. This will acquire multiple complete 3D acquisitions, and the optimally enhanced acquisition will be chosen retrospectively. Although some current scanners have this capability, the resolution is limited compared with other methods.
In infants and small children, it is difficult to achieve a well-timed examination that results in a pure arterial- or venous-phase acquisition. Because the circulation time is so rapid, both the arteries and veins enhance within a short period of time following contrast infusion. Reducing the acquisition time to a point where a timed acquisition can be effective may sacrifice image resolution and reduce SNR. We have found that simultaneous initiation of contrast infusion and data acquisition result in diagnostic CEMRA studies that have adequate resolution and SNRs, although both venous and arterial structures are enhanced.
Contrast Dosage and Administration
The dose of gadolinium is an important determinant of image quality, and widely ranging doses have been advocated. Three-dimensional CEMRA studies have used doses of gadolinium ranging from 0.5 mmol/kg (“half dose”) to 0.3 mmol/kg (“triple dose”). For adult patients, we routinely use 30 mL of gadolinium per patient. For most adults in the United States, this dose is equivalent to approximately 0.15 to 0.25 mmol/kg. High-dose bolus injection of gadolinium for MR angiography is still not approved by the U.S. Food and Drug Administration. However, given the preponderance of studies supporting the safety and efficacy of these doses in the literature, we feel that this dose is medically justifiable. We do not exceed a total weight-based dose of 0.3 mmol/kg for any study.
In children and infants, careful attention must be given to the volume of infused gadolinium chelate in order to not exceed the clinically accepted upper limit of 0.3 mmol/kg. In these patients, unlike adults, we use a weight-based dosing of 0.2 mmol/kg for CEMRA studies. In some small infants, only 1 or 2 mL of gadolinium may be needed. This volume is so small that it can often be preloaded into the intravenous line tubing prior to infusion, simplifying the injection process. After the gadolinium has been injected, a saline flush of approximately twice the gadolinium volume is infused to clear the line and to ensure that the patient receives the entire gadolinium dose.
Contrast may be administered either by hand or by a MR compatible power injector. For larger children or adults, a 20- or 22-gauge angiocatheter is routinely inserted in an antecubital vein prior to the start of the study. In smaller children or infants, a smaller angiocatheter can be used if needed, and this can be positioned elsewhere as long as it can handle a rapid bolus of 1 to 2 mL per second. A long extension tube is used to connect to hand-held syringes or a power injector located outside of the MR scanning room. Since CEMRA is a first-pass technique, the contrast must be infused while the patient is in the magnet, thus the need for the long extension tubing. The power injector ensures a reliable rate of contrast delivery and eliminates the need for a second technologist during the study. Contrast is usually infused as a bolus at a rate of 1 to 2 mL per second and is followed immediately by a saline flush.
Image Processing
As discussed in the CT section above, accurate interpretation of CEMRA requires interactive manipulation of the 3D data sets. It is not possible to rely solely on the source images because they are subject to partial volume effects. The reconstructed images greatly enhance diagnostic confidence. In the past, the most widely used postprocessing technique for CEMRA was maximum-intensity projection. The diagnostic accuracy of contrast-enhanced MR angiography using the MIP technique is well described and accepted clinically (36,37,38,39,40). In the thorax, subvolume MIPs, made from only a selected portion of the original data set, are useful to exclude nonrelevant anatomy.
Multiplanar reconstructions are useful in the evaluation of thoracic vascular anomalies. Because both MIPs and volume-rendered images are projectional images, adjacent structures may overlap and may obscure the relevant anatomy. MPRs are generated using any angle through the original data set. Orientations that depict the blood vessel(s) of interest in an optimal manner are selected interactively. This is a very practical method to accurately determine the size of a vessel or its angulation and relationship to other structures.
Volume rendering is another useful method for depicting thoracic vessels. Recent studies have shown that the VR technique has significant advantages for CEMRA (39,40). Mallouhi et al. (39) found that VR performed slightly better than MIP for quantification of renal stenoses greater than 50% and significantly better for severe stenoses. VR also had a substantial improvement in positive predictive value, and renal vascular delineation on VR images was significantly better. In another series, MIPs were statistically less reliable for determining renal artery stenoses compared with digital subtraction angiography (40).
The MIP algorithm selects only the voxel with the highest attenuation along a ray projected through the data set; volume-averaged voxels may be erroneously excluded from the final image, resulting in overestimation of stenosis. VR is based on the percentage classification technique, which is used to estimate the probability of a material being homogeneously present in a voxel (39). This provides an accurate determination of the amounts of materials when the voxel consists of two or more materials, which are volume averaged. With VR, the volume-averaged voxels are included in the final image because VR calculates a weighted sum of data from all voxels along a ray projected through the data set.
Black Blood Techniques
Spin echo (SE) was the first sequence used for evaluating cardiac and thoracic vascular morphology. The development of ECG-gating made SE technique especially useful by substantially reducing motion artifacts (41,42,43). Spin echo sequences generally provide good contrast between the vessel wall and blood. These are called black blood images because of the signal void created by flowing blood. Blood signal may appear brighter in slowly flowing areas, such as areas immediately adjacent to the vessel wall. Presaturation with radio frequency and reduction of the echo time minimizes blood signal and increases contrast on gated SE images (43). Although widely available, SE imaging has limited temporal resolution and is degraded by respiratory and other motion-related artifacts.
Shorter acquisition times are achieved with fast (or turbo) spin echo (FSE) pulse sequences, also known as rapid-acquisition relaxation enhancement (RARE) (42). Although faster, soft tissue contrast can be less than that with SE techniques because of the wide range of acquired TEs inherent in FSE technique (43). Numerous modifications to the basic FSE sequence have been made, including the use of one or more inversion pulses, increased echo train length, half-Fourier reconstruction, and echo planar techniques.
Single-shot FSE (SSFSE) sequences use a very long echo train in tandem with half-Fourier reconstruction (44). The center of k-space is acquired in a short time, minimizing motion blurring. The rapid acquisition of multiple phase lines for a single TR allows for coverage of the entire heart and thorax in the time frame of one or two breath holds. SSFSE technique has the advantage of being faster than the FSE technique in the evaluation of thoracic aortic disease (45,46). The SSFSE sequence can be modified for better cardiac results by reducing the echo train length, lowering the effective TE, and using a blood-suppressed preparation method (47,48).
T2-weighted inversion recovery imaging is now used as the front-line sequence for depiction of cardiac and thoracic vascular morphology. This technique uses a selective and a nonselective 180-degree inversion pulse followed by a long inversion time to null blood magnetization (49,50). A second selective 180-degree inversion pulse can also be applied to null fat. This is referred to as double (or triple) inversion recovery (DIR and TIR, respectively). The sequence is acquired either with breath hold or a nonbreath-hold technique and provides for excellent delineation of vessel wall or myocardial blood interfaces. It effectively nulls blood and depicts blood vessel interfaces so well that the sequence has even been useful for performing coronary angiography (50).
Bright Blood Techniques
Bright blood imaging yields both morphologic and functional data. In this sequence, blood has a bright signal intensity. Multiple consecutive images are acquired and can be viewed dynamically to depict cardiac motion. Sequences include gradient echo (GRE), fast GRE, segmented k-space fast GRE, and steady state free precession (SSFP) (true FISP, FIESTA) techniques.
Gradient echo imaging is well suited for cardiac and vascular imaging because of its short echo and repetition times. Blood appears bright compared with adjacent myocardium due to time-of-flight effects as well as the relatively long T2. Markedly turbulent blood loses signal due to intravoxal dephasing, a helpful artifact for assessing areas of stenosis or valvular regurgitation (51).
A segmented k-space approach provides high-resolution dynamic images and can be performed much more rapidly than other techniques (52,53,54). Using short echo times (2 msec) and short TRs (<10 msec), multiple lines (segments) of k-space are acquired during each cardiac cycle. In contradistinction, in the GRE techniques, only a single line of k-space is acquired per cycle. Segmented k-space fast GRE imaging remains a mainstay for dynamic cardiac and vascular imaging and has been improved and adapted for even faster acquisition times (55,56,57). However, the technique is limited by the need to maintain adequate enhancement of inflowing blood. At lower TRs, now available with high-performance gradient systems, inflow enhancement of the cardiac blood pool diminishes and saturation occurs, reducing vessel wall–blood contrast. The inability to further reduce TR effectively limits achievable spatial and temporal resolution.
Steady state free precession is a state-of-the-art approach to the improvement of cine imaging (Fig. 15-4). Image contrast in SSFP depends on the T1/T2 ratio of tissue and, unlike GRE techniques, is less dependent on flow. SSFP uses the available blood signal very efficiently and accurately depicts blood, myocardium, and epicardial fat (58). First described in 1986, it was not used for cardiac or vascular applications for some years (59,60). SSFP is susceptible to magnetic field inhomogeneities and requires very short TRs, limiting its use until recently. With technical improvements in magnetic field homogeneity and the development of higher performance gradient systems, diagnostic SSFP images can now be obtained with limited artifacts (61,62,63,64). This technique is also known as BFFE (balanced fast field echo), FIESTA (fast imaging employing steady state acquisition), FISP (fast imaging with steady precession), and trueFISP.
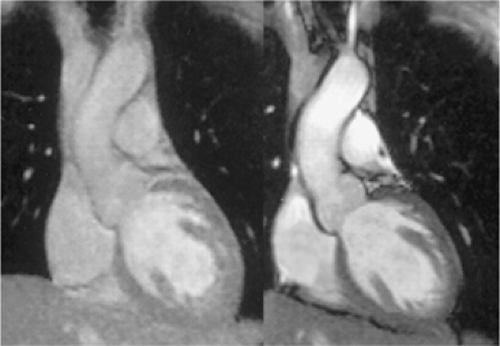 Figure 15-4 Steady state free precession imaging compared with fast cine GRE. The SSFP sequences result in improved contrast between the blood pool and vascular wall and myocardium (right). The signal-to-noise and contrast-to-noise ratios of SSFP are substantially higher than that of the conventional techniques (left). |
In the heart, SSFP sequences result in improved contrast between myocardium and ventricular cavities with clearer delineation of trabeculation and papillary muscles as compared with segmented k-space fast GRE techniques. The signal-to-noise and contrast-to-noise (C/N) ratios of SSFP are substantially higher than conventional techniques (65,66,67). Barkhausen et al. found that the mean C/N ratio improved by an average of 46% and 100% in short- and long-axis images, respectively, compared with the standard cine gradient echo sequences (67). The reported C/N ratios are also higher than those obtained with contrast-enhanced gradient echo techniques (68). Pereles et al. found that SSFP depicts morphologic and functional abnormalities with greater precision and provides greater diagnostic confidence than conventional techniques (66). The other advantage of SSFP is improved temporal resolution (67,69). Reduction in acquisition time by a factor of two to three at similar spatial resolutions is possible. Shorter acquisition times also can be exploited to improve spatial resolution.
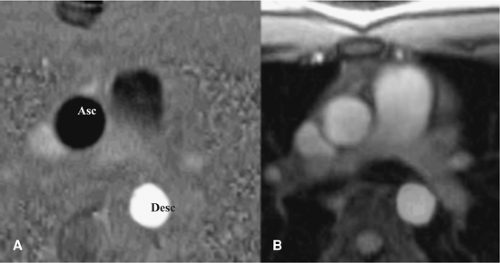 Figure 15-5 Phase contrast depiction of aortic flow. A: Phase image depicts blood flow in the ascending aorta away from the viewer as black (Asc) and blood flow toward the viewer in the descending aorta (Desc) as white. B: Magnitude image depicts aortic and pulmonary arterial morphology. |
Phase Contrast
Phase contrast (PC) techniques allow for depiction of blood flow and quantitative analysis of the velocity and volume of flow through a vessel (Fig. 15-5). Image data regarding the phase and magnitude of spin vectors are routinely acquired in MR imaging, but the phase data are usually discarded. PC MRI allows phase information to be saved and displayed. Pixels corresponding to spins moving across a magnetic gradient, as occurs with active blood flow, are assigned bright or dark signal intensity, while stationary spins are assigned an intermediate (grey) value.
This can be used to determine patency of vessels and can be quantitatively evaluated to determine a profile of spin velocities across a vessel lumen. Spins moving across a magnetic gradient accumulate a phase shift proportional to their velocity. Most recent MR systems can now accurately calculate the velocity profile by analyzing the phase shift in a pixel using an equation that uses the gyromagnetic ration, time interval between gradient lobes, and the area of the bipolar gradient pulse (70).
Velocity-encoded (VEC) PC techniques are used to determine flow, peak flow rates, and the volume of flow per unit time. Once the velocity profile is acquired, the area of the vessel lumen of interest is measured, and the volume of blood moving through a vessel is quantitatively determined. ECG-gated velocity-encoded PC is used to calculate cardiac output. A region of interest placed on the ascending aorta can be used to accurately calculate the volume of blood flow per minute. A similar region of interest placed on the pulmonary artery can be used to calculate pulmonary blood flow, which generally is equal to that determined in the aorta. If there is an intra- or extracardiac shunt present, the ratio of pulmonary to systemic flow can be calculated. Peak flow rates across an area of stenosis can also be used to determine the pressure gradient. Using a modified Bernoulli equation, the pressure gradient, in millimeters of mercury (mmHg) across a stenosis is calculated as the product of the cube of the peak velocity as measured in meters per second.
VEC PC imaging is a valuable technique for quantitative assessment of flow dynamics in congenital heart disease. Clinical applications include the measurement of collateral flow and pressure gradients in coarctation of the aorta (Fig. 15-6), differentiation of blood flow in the left and right pulmonary arteries, quantification of shunts, and evaluation of valvular regurgitation and stenosis. After surgical conduit placement, VEC PC is used to monitor blood flow, restenosis, and flow dynamics. With VEC PC imaging, there are some potential pitfalls such as potential underestimation of velocity and flow, aliasing, inadequate depiction of very small vessels, and possible errors in pressure gradient measurements (71). Nevertheless, VEC MR imaging is a valuable tool for preoperative planning and postoperative monitoring in patients with coronary heart disease (CHD).
Parallel Imaging Techniques
A new method of spatial encoding referred to as parallel imaging is helpful for MR of the thoracic vessels (72,73). This type of imaging uses arrays of radio frequency detector coils to acquire multiple data points simultaneously rather than sequentially, as has been traditionally performed. This results in faster imaging speeds that can be used to increase either temporal or spatial resolution.
An R factor (parallel factor) is used to describe the order of factor used. For a given R factor, data acquisition time is reduced to approximately 1/R if the imaging matrix is unchanged. A factor of two is currently the most widely available factor, although higher factors are now being utilized by some centers. At a factor of two, a typical acquisition time
will be reduced by 50%. Alternatively, image resolution could be doubled, by acquiring more phase lines or thinner partitions, without changing the study acquisition time.
will be reduced by 50%. Alternatively, image resolution could be doubled, by acquiring more phase lines or thinner partitions, without changing the study acquisition time.
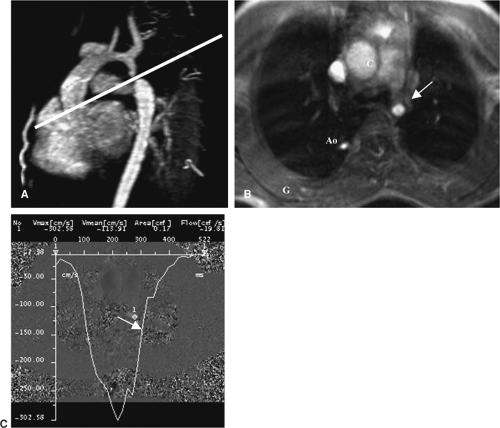 Figure 15-6 Velocity-encoded phase contrast determination of pressure gradient in a child with coarctation. A: Oblique 2D PC image is positioned orthogonal to the region of maximal narrowing as depicted on the CEMRA study. B: Magnitude image from the PC data depicts a small descending aorta (arrow). C: Graphic depiction of aortic velocities superimposed on the phase image captures peak systolic velocity of 306 cm per second, equal to a gradient of 36 mmHg. |
In the thorax, the scan times of many sequences can be reduced by a factor of two or four given the current technology, and larger reductions in scan time will likely be possible in the future. The increased speed associated with parallel imaging does not come without a price. The SNR of parallel imaging is always reduced compared with the SNR ratio of other sequences obtained using the same coil array. The SNR of accelerated studies is lower by approximately 20% at a parallel factor of two and is further reduced by the square root of the parallel factor at greater levels.
Embryologic Development of the Thoracic Great Vessels
Knowledge of the embryology of the thoracic great vessels is helpful in understanding the variations in the number, size, and position of the thoracic great vessels. Therefore, the embryology of the mediastinal great vessels is reviewed briefly. For more detail, the reader is referred to general texts of embryology (74,75).
Arterial System
The normal left aortic arch and its branches develop from paired pharyngeal arches, which are bilateral bars of mesoderm, separated by ectodermal clefts. The pharyngeal arches form during the fourth and fifth weeks of development and undergo a process of orderly regression. Each arch has its own cranial nerve as well as its own artery. These arteries are known as aortic arches and arise from the aortic sac, which is the most distal part of the truncus arteriosus. There are five aortic arches in the human embryo, numbered craniocaudally as I, II, III, IV, and VI. Arch V either never forms or forms incompletely and then regresses. The aortic arches course dorsally from the aortic sac to terminate in the right and left dorsal aortas. The ventral portion of the
aortic sac develops into the truncus arteriosus, which is divided by the aorticopulmonary septum into the proximal aortic root and the main pulmonary artery.
aortic sac develops into the truncus arteriosus, which is divided by the aorticopulmonary septum into the proximal aortic root and the main pulmonary artery.
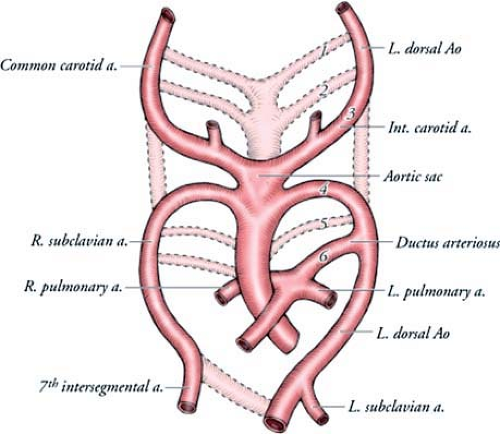 Figure 15-7 Diagram of primitive arch. At 6 weeks of intrauterine life, the first and second pairs of arches have virtually disappeared (dotted lines). The third arch forms the common carotid arteries. The fourth pair of arches forms different structures. The right fourth arch becomes the proximal part of the right subclavian artery, and the left arch becomes part of the normal aortic arch. The distal part of the right subclavian develops from the seventh intersegmental artery. The left subclavian forms from the left seventh intersegmental artery. The fifth arch never forms or involutes early. The sixth pair of arches forms the pulmonary arteries bilaterally. The left sixth arch also gives rise to the ductus arteriosus. |
By the sixth week of intrauterine life, most of the first and second aortic arches have atrophied, except for small portions that persist to form the maxillary artery and stapedial arteries, respectively. The third, fourth, and sixth arches remain and develop into the great arteries (Figs. 15-7, 15-8).
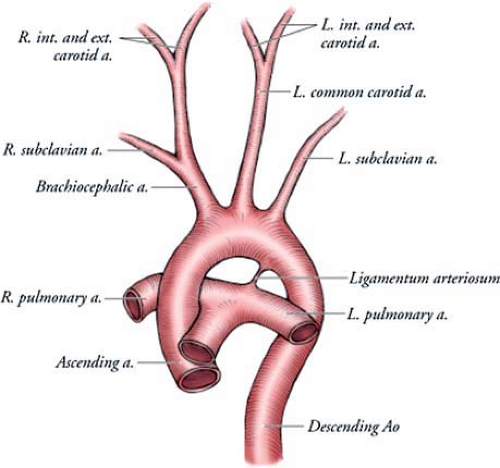 Figure 15-8 Normal adult aortic arch. The right subclavian and carotid arteries join to form the right brachiocephalic artery. The left subclavian and carotid arteries arise separately from the aorta. |
The third aortic arch forms the common carotid arteries and the first part of the internal carotid arteries. The fourth aortic arches form asymmetric structures. The right fourth arch forms the most proximal segment of the right subclavian artery. The distal part of the subclavian artery forms from a portion of the right dorsal aorta and the seventh intersegmental artery. The left fourth arch forms the portion of the aortic arch between the left common carotid and the left subclavian arteries. The sixth aortic arches also develop asymmetrically. The right arch forms the right pulmonary artery, and the left arch forms the left pulmonary artery and the ductus arteriosus.
In the fifth week of intrauterine life, the right dorsal aorta disappears between the origin of the seventh intersegmental artery and the junction with the left dorsal aorta. The two aortas fuse caudally below T4 to form a single aorta in the distal thorax and abdomen.
Regression of a segment of arch that should have persisted or persistence of a segment of arch that should have regressed explains the development of most arch anomalies (74,75,76). These anomalies include left aortic arch with aberrant left subclavian artery, double aortic arch, right aortic arch with mirror image branching, right aortic arch with aberrant left subclavian artery, and cervical aortic arch. Aortic arch anomalies are of clinical importance when they produce symptoms.
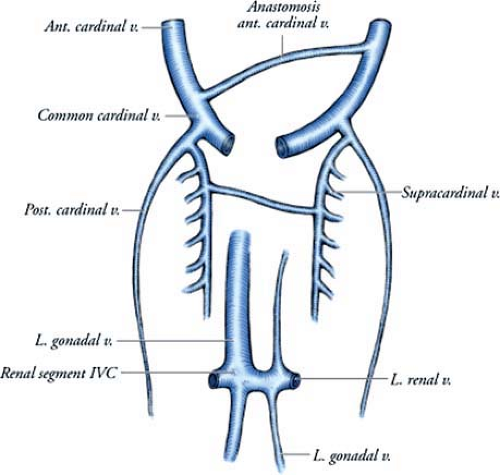 Figure 15-9 Development of the venous system. The cardinal and supracardinal veins form the main venous drainage system for the thorax. |
Venous System
The three major venous systems of the thorax—cardinal, subcardinal, and supracardinal veins—develop during the early embryonic period (Figs. 15-9, 15-10). The cardinal veins form the main venous drainage system of the embryo. This system consists of the anterior cardinal veins, which drain the cephalic part of the embryo, and the posterior cardinal veins, which drain the remaining part of the fetal body. The intersegmental veins drain into the anterior and posterior cardinal veins. Through anastomoses, the cardinal venous system becomes the superior vena cava and brachiocephalic, subclavian, internal jugular, and superior intercostal veins.
The subcardinal system is a paired longitudinal venous plexus located in the developing fetal abdomen. This network mainly drains the kidneys and gonads in the urogenital ridge. Numerous ventrodorsal anastomoses unite the subcardinal with the supracardinal venous system.
The supracardinal veins lie lateral to the dorsal aorta and drain the body wall via the intercostal veins. By the sixth intrauterine week, they take over the functions of the posterior cardinal veins. The supracardinal veins are the origin of the adult azygos venous system. The fourth to 11th right intercostal veins empty into the right supracardinal vein, which, together with a portion of the posterior cardinal vein, forms the azygos vein. On the left side, the fourth to seventh intercostal veins enter into the left supracardinal vein, and
the left supracardinal vein empties into the azygos vein and is then known as the hemiazygous vein.
the left supracardinal vein empties into the azygos vein and is then known as the hemiazygous vein.
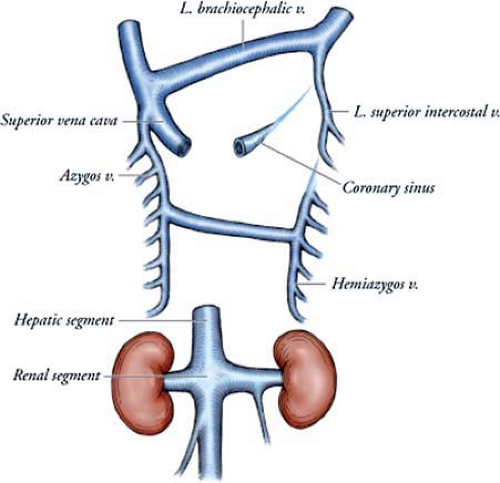 Figure 15-10 Normal adult venous drainage. The cardinal system has become the superior vena cava, its main tributaries, and the superior intercostal veins. The supracardinal veins form the azygous and hemiazygous systems. |
Variations in venous anatomy are the result of regression of a channel that should have persisted or persistence of a channel that should have regressed. The common deviations from the normal developmental pattern are the left superior vena cava, which is caused by persistence of the left anterior cardinal vein and obliteration of the common cardinal and proximal part of the right anterior cardinal vein, and the absence of the inferior vena cava, which occurs when the right subcardinal vein fails to establish a connection with the liver and shunts its blood directly into the right supracardinal vein (75).
Fetal and Postnatal Circulation
In utero, blood from the placenta, which is 80% to 85% saturated with oxygen, returns to the fetus via the umbilical vein. Most of this blood flows into the ductus venosus and then into the inferior vena cava. In the inferior vena cava, the saturated placental blood mixes with deoxygenated blood (30% saturated) returning from the lower limbs. The mixed blood (70% saturated) from the inferior vena cava enters the right atrium, where it passes through the oval foramen into the left atrium. In the left atrium, it mixes with the pulmonary venous flow.
From the left atrium, the blood enters the left ventricle. Blood from the left ventricle (65% saturated) enters the aortic arch and supplies the head and neck. The desaturated venous blood from the head is drained by the superior vena cava. From the superior vena cava, it flows by way of the right ventricle into the pulmonary trunk. Since pulmonary vascular resistance is high during fetal life, the main portion of this blood passes directly through the ductus arteriosus into the descending aorta, where it mixes with blood from the proximal aorta, before being distributed to the trunk, lower extremities, and placenta.
At birth, there is the cessation of placental blood flow and the beginning of respiration, which results in closure of the ductus arteriosus by contraction of its muscular wall. As a result, blood in the ductus arteriosus no longer flows into the aortic arch. However, a small left-to-right shunt is not unusual during the first few days after birth. Complete anatomical closure by intimal proliferation occurs after 1 to 3 months, resulting in the ligamentum arteriosum (74,75). The return of oxygenated blood from the lungs also increases pressure in the left atrium, which, combined with a decrease in pressure in the right atrium, closes the foramen ovale. Fibrous union occurs in several months, although in approximately 30% of individuals anatomical closure may never be obtained, resulting in a patent foramen ovale.
Normal Mediastinal Vascular Anatomy
Stay updated, free articles. Join our Telegram channel

Full access? Get Clinical Tree


