Tricuspid and Pulmonary Valves


Tricuspid and Pulmonary Valves


Clinical Overview

Disease of the tricuspid valve can be divided into primary and secondary anatomic abnormalities. Primary pathology of the tricuspid and pulmonary valve is relatively infrequent in adult populations. Clinical entities resulting in pulmonary and tricuspid valvular disease are listed in Table 13.1. The appropriate use of echocardiography for known or suspected tricuspid and pulmonary valve disease is outlined in Table 13.2. Congenital pulmonary and tricuspid valve lesions are discussed in Chapter 20. Primary abnormalities include congenital diseases such as Ebstein anomaly as well as acquired abnormalities such as endocarditis and carcinoid valve disease. The most common form of tricuspid valvular pathology encountered in adults is secondary tricuspid regurgitation due to either annular or right ventricular dilation, with subsequent malcoaptation of the leaflets. This is a common secondary finding in pulmonary hypertension or any other disease resulting in right ventricular dilation. In general, detection of tricuspid regurgitation with a dilated annulus should lead to a search for underlying causes such as pulmonary hypertension, primary left heart disease, or disease of the right ventricular myocardium such as infarction or cardiomyopathy.


Pulmonary Valve

The normal pulmonary valve is a three-cusp structure, anatomically similar to the aortic valve. It is inserted into the pulmonary artery annulus distal to the right ventricular outflow tract. Developmentally, the aorta and pulmonary arteries arise in a parallel fashion. The two arteries then rotate such that the right ventricular outflow tract, pulmonary valve, and proximal pulmonary artery effectively wrap around the aortic valve and the ascending aorta.


Table 13.1 Diseases of the Tricuspid and Pulmonary Valves


Disease


Stenosis


Regurgitation


Rheumatic heart disease


[check mark]


[check mark]


Carcinoid heart disease


[check mark]


[check mark]


Obstructive tumors


[check mark]


Congenital pulmonary stenosis


[check mark]


±


Endocarditis


±


[check mark]


Ebstein anomaly


[check mark]


Endocardial fibroelastosis


±


[check mark]


Tricuspid valve prolapse


[check mark]


Traumatic rupture


[check mark]


Right ventricular infarction


[check mark]


Ischemic papillary muscle dysfunction


[check mark]


Pulmonary hypertensiona


[check mark]


Left-to-right shunt with dilationa


[check mark]


Right ventricular cardiomyopathya


[check mark]


Pacemaker leads, right heart catheter


[check mark]


a Tricuspid disease is secondary to right ventricular dilation. The leaflets are anatomically normal.


When viewed with two-dimensional echocardiography, typically only one or two cusps are simultaneously visualized. Specialized imaging planes may allow visualization of the pulmonary valve in its short axis; however, the relatively thin, highly pliable leaflets are often not visualized in their entirety. Anatomically, the pulmonary valve should be described in conjunction with the right ventricular outflow tract, including an assessment of the degree of hypertrophy in the outflow tract. Visualization of the pulmonary valve in adults typically is optimal from a parasternal short-axis transducer position at the base of the heart, at which time the aortic valve and/or proximal aorta are simultaneously visualized (Fig. 13.1). The bifurcation of the pulmonary artery is also visualized from this view (Fig. 13.2). In addition to the parasternal short-axis view, a long-axis projection of the right ventricular outflow tract and pulmonary valve can be obtained by rotation of the transducer approximately 90° while angulating the transducer toward the right shoulder (Fig. 13.3). This visualization plane is often problematic in large-stature adults but is often available in smaller stature individuals. A final transthoracic imaging plane for visualization of the pulmonary valve is the subcostal view in which, with anterior angulation, the entire sweep of the right ventricular outflow tract can often be visualized including the pulmonary valve leaflets (Fig. 13.4).

The pulmonary valve can also be visualized with transesophageal echocardiography. The views that maximize visualization of the pulmonary valve include imaging at the level of the aorta in a 40° to 60° plane and in the horizontal (0°) plane at relatively shallow depths (typically 25-30 cm from the incisors) with counterclockwise rotation of the probe. In this view, the bifurcation of the pulmonary artery is typically seen and the pulmonary valve can be likewise visualized (Fig. 13.5). An additional transesophageal echocardiographic window providing visualization of the pulmonary valve is often obtained from a deep gastric imaging plane. With clockwise rotation of the transducer, the entire sweep of the right ventricular inflow and outflow tracts can often be obtained and simultaneous visualization of the right atrium, tricuspid valve, right ventricular outflow tract, pulmonary valve, and proximal pulmonary artery often accomplished (Fig 13.6).

Using M-mode echocardiography from a parasternal approach, motion of the pulmonary valve can be recorded. Only one leaflet will be intersected by the M-mode interrogation beam. Characterization of pulmonary valve motion provided one of the earlier clues to the presence of pulmonary hypertension and indirect evidence of other right heart pathology. There are several components to normal pulmonary valve motion (Fig. 13.7). The first is presystolic A-wave motion away from the transducer, which is due to relatively low-amplitude excursion (<6 mm) of the pulmonary valve with atrial systole.
This phenomenon is dependent on mechanical atrial systole and is not present in atrial fibrillation. It is also dependent on relatively low pulmonary artery diastolic pressures so that atrial contraction creates the driving force for partial opening of the pulmonary valve. The pulmonary valve leaflet then moves posteriorly (in a patient in supine position), that is, away from the transducer during systole. It is not uncommon for visualization to be incomplete throughout the entire cardiac cycle and for only the A wave and opening slope of the pulmonary valve to be detectable. With excellent acoustic windows, the full opening of the pulmonary valve and the degree to which it remains in a fully open position during systole can occasionally be appreciated (Fig. 13.8) and its subsequent closure in diastole also noted.


Table 13.2 Appropriateness Criteria for Use of Echocardiography in Pulmonic Tricuspid Valve Disease


Indication


Appropriateness


Score (1-9)


3.


Assessment of known or suspected adult congenital heart disease including anomalies of great vessels and cardiac chambers and valves or suspected intracardiac shunt (ASD, VSD, PDA) either in unoperated patients or following repair/operation.


A (9)


10.


Evaluation of known or suspected pulmonary hypertension including evaluation of right ventricular function and estimated pulmonary artery pressure.


A (8)


14.


Evaluation of respiratory failure with suspected cardiac etiology.


A (8)


24.


Initial evaluation of known or suspected native valvular regurgitation.


A (9)


26.


Routine (yearly) reevaluation of an asymptomatic patient with severe native valvular regurgitation with no change in clinical status.


A (8)


27.


Reevaluation of native valvular regurgitation in patients with a change in clinical status.


A (9)


31.


Initial evaluation of suspected infective endocarditis (native and/or prosthetic valve) with positive blood cultures or a new murmur.


A (9)


54.


To determine mechanism of regurgitation and determine suitability of valve repair.


A (9)


15.


Initial evaluation of patient with suspected pulmonary embolism in order to establish diagnosis.


I (3)


25.


Routine (yearly) reevaluation of native valvular regurgitation in an asymptomatic patient with mild regurgitation, no change in clinical status, and normal LV size.


I (2)


ASD, atrial septal defect; PDA, patent ductus arteriosus; VSD, ventricular septal defect.


Reprinted with permission of the ACCF from Douglas PS, Khandheria B, Stainback RF, et al. ACCF/ASE/ACEP/ASNC/SCAI/SCCT/SCMR 2007 appropriateness criteria for transthoracic and transesophageal echocardiography. J Am Coll Cardiol 2007;50(2):187-204.


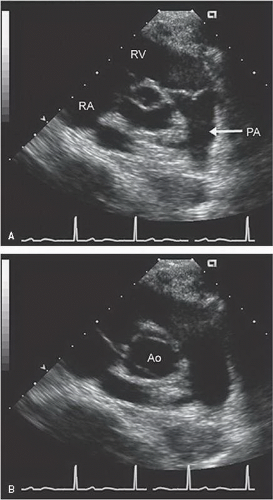
FIGURE 13.1. Transthoracic parasternal short-axis view at the base of the heart visualizing the pulmonary valve. Notice the central closure point in diastole (A) and the inability to visualize the normal leaflets that are fully open in systole (B).

Pulsed and continuous wave Doppler imaging can also be recorded at the level of the pulmonary valve. Typically, the pulmonary valve flow profile is recorded from a parasternal shortaxis view along an interrogation line identical to that used for
M-mode echocardiography. Figure 13.9 schematizes the appropriate sample volume position and provides an example of a normal pulsed Doppler imaging of pulmonary flow. It should be emphasized that many of the indirect parameters of right heart hemodynamics that can be derived from the pulmonary outflow tract spectral profile are dependent on optimal imaging planes, including the central position of the sample volume within the pulmonary artery (as opposed to recording it along the periphery) and recording at a level just distal to the tips of the pulmonary valve. The normal pulmonary outflow tract velocity ranges from 1 to 1.5 m/sec. As with other valves, the time velocity integral of this valve can be determined and in combination with the outflow tract dimension can be used to calculate volumetric flow (Fig. 13.9). Other parameters of the pulmonary outflow tract velocity include acceleration time. Acceleration time is defined as the time in milliseconds from the onset of ejection to peak systolic velocity. In normal individuals, acceleration time exceeds 140 milliseconds and progressively shortens with increasing degrees of pulmonary hypertension (Fig. 13.10).


FIGURE 13.2. Parasternal short-axis view at the base of the heart with a slightly different angulation than presented in Figure 13.1. In this view, the bifurcation of the pulmonary artery into right and left pulmonary arteries can be visualized (forked arrow). The plane of the pulmonic valve is noted by the horizontal arrow.


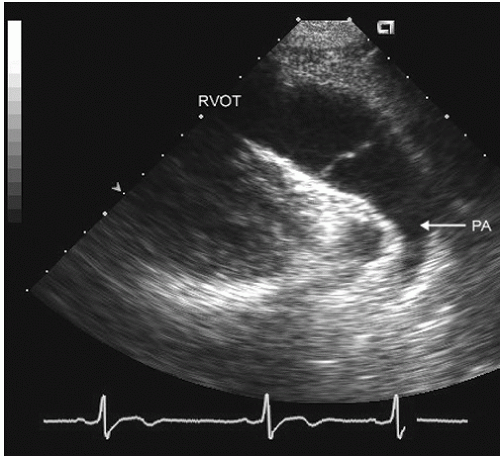
FIGURE 13.3. Parasternal long-axis view of the right ventricular outflow tract, pulmonary artery, and pulmonary valve recorded in diastole. In the real-time image, note the full motion of the valve to the margins of the arterial wall. PA, pulmonary artery.


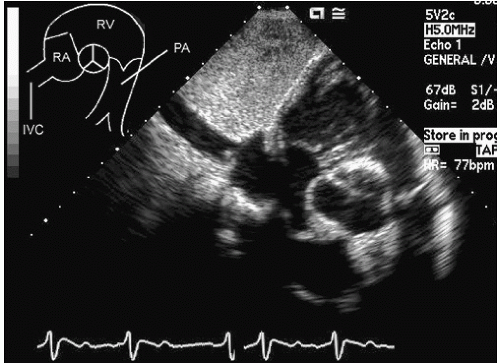
FIGURE 13.4. Subcostal short-axis view of the base of the heart shows a portion of the right atrium, tricuspid valve, right ventricle and outflow tract, pulmonary valve, and pulmonary artery. Structures are as noted on the schematic in the upper left of the figure.


FIGURE 13.5. Transesophageal echocardiogram recorded in 55° and 0° views at the base of the heart. A: The right ventricular outflow tract and pulmonary artery are clearly visualized as is the pulmonary valve (PV). B: The pulmonary valve and a larger portion of the main pulmonary artery and right pulmonary artery (RPA) are shown. In this view, it is often difficult to visualize simultaneously the RPA and the left pulmonary artery (LPA). PA, pulmonary artery.

The inverse relationship between pulmonary acceleration time and pulmonary artery systolic, diastolic, and mean pressures has been demonstrated in numerous studies. Most have suggested that at an acceleration time of less than 70 to 90 milliseconds, pulmonary artery systolic pressures will exceed 70 mm Hg. This assessment has been largely replaced by the more direct Doppler assessment of right ventricular systolic pressure from the tricuspid regurgitation signal. On occasion, in a patient without a measurable tricuspid regurgitation velocity, a short acceleration time may be the only evidence of pulmonary hypertension and may lead to further evaluation of pulmonary artery pressure.

Color flow imaging can be accomplished in the vast majority of patients and often, when using high-resolution, high-sensitivity imaging platforms, results in detection of inconsequential degrees of pulmonary regurgitation (Fig. 13.11). As minor degrees of pulmonary regurgitation are detected in the majority of adults when using modern imaging platforms, they

should be considered a normal variant. These inconsequential jets of pulmonary valve insufficiency may arise centrally or more peripherally at the junction of the valve cusps with the pulmonary artery (Fig. 13.12). When they arise immediately adjacent to the aortic wall, they have been confused for a pathologic communication between the aorta and the pulmonary artery. Recognition of the exclusively diastolic flow should allow avoidance of any confusion.


FIGURE 13.6. Transesophageal echocardiogram recorded at 76° from a low esophageal position showing the body and outflow tract of the right ventricle, the pulmonary valve in a closed position (arrow) and in the color flow image mild pulmonic insufficiency (arrow). PA, pulmonary artery.


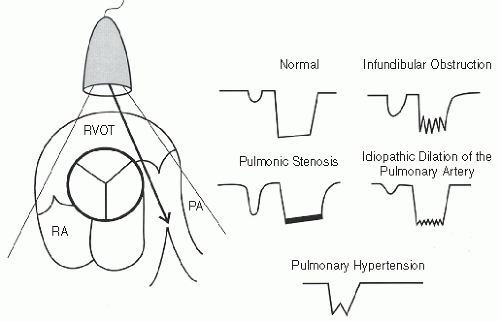
FIGURE 13.7. Schematic representation of M-mode echocardiograms of normal and abnormal pulmonary valves. In the normal schematic, note the normal A wave and boxlike opening of the valve. Various disease states are also schematized. PA, pulmonary artery.


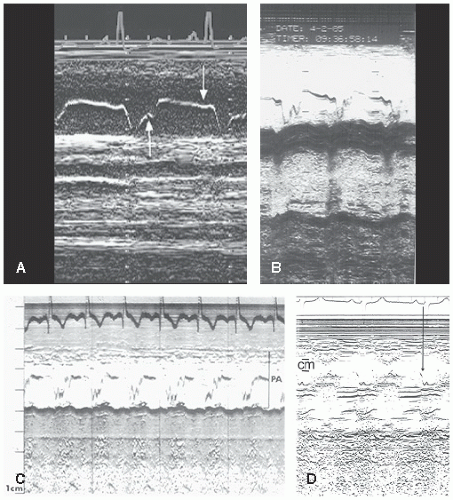
FIGURE 13.8. M-mode echocardiograms recorded in patients with different abnormalities. A: Image recorded in a patient with pulmonary hypertension. Note the loss of the pulmonic valve A wave (downward-pointing arrow) and midsystolic notching (upward-pointing arrow) of the valve. B: Note the low-amplitude biphasic A wave. C: Image recorded in a patient with infundibular obstruction shows coarse fluttering of the valve in systole. D: Image recorded in a patient with pulmonary valve stenosis. Note the accentuated A wave (1 cm). PA, pulmonary artery.


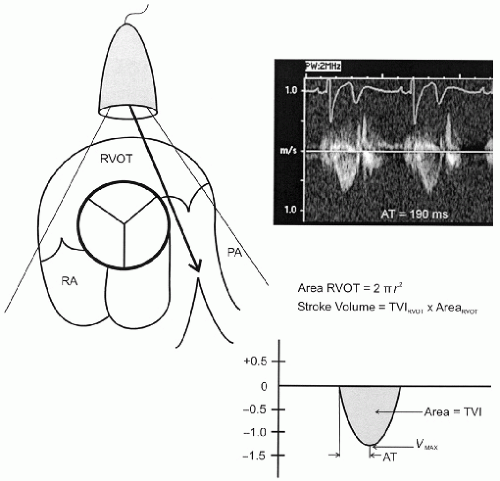
FIGURE 13.9. Schematic representation of the methods for recording pulmonary/right ventricular outflow tract velocities. The parasternal short-axis view is used with the interrogating beam aimed posteriorly along the long axis of the right ventricular outflow tract and proximal pulmonary artery. The spectral display is schematized at the lower right, including its various components such as time velocity ventricle (TVI) and acceleration time (AT). In the upper right is an example of a normal flow profile. The method for calculating stroke volume from these parameters is also displayed.


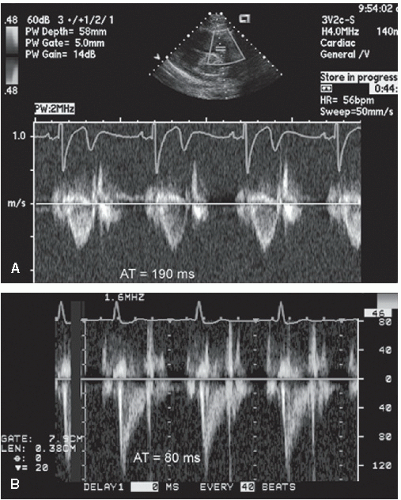
FIGURE 13.10. Spectral flow profiles recorded in a normal individual (A) with an acceleration time (AT) of 190 milliseconds and a patient with significant pulmonary hypertension in whom the acceleration time is 80 milliseconds (B). AT, acceleration time.


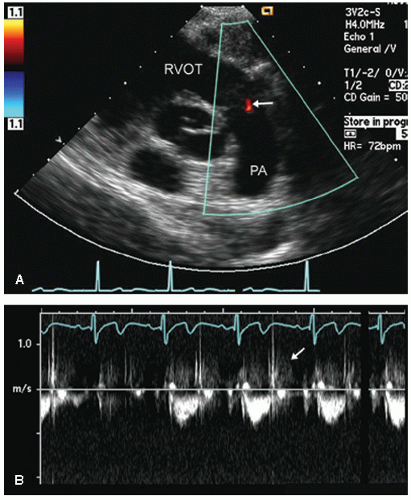
FIGURE 13.11. Parasternal short-axis view at the base of the heart in a normal individual reveals trivial central pulmonary valve insufficiency. A: Note the very small central regurgitant jet (arrow). B: Note the faint early diastolic retrograde Doppler spectral signal consistent with minimal pulmonary insufficiency.


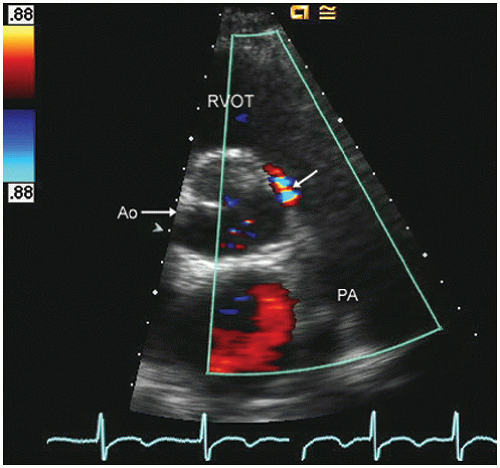
FIGURE 13.12. Parasternal short-axis view recorded at the base of the heart in a patient with minimal pulmonary valve insufficiency originating at the lateral aspect of the cusp commissure. Because this jet originates immediately adjacent to the aorta, it could be confused for an aorta-pulmonary fistula. Note, however, the exclusively diastolic flow, which would not be expected in the presence of the true shunt.


Pulmonary Valve Stenosis

Pulmonary valve stenosis is a congenital cardiac lesion and is discussed in detail in Chapter 20. The classic anatomic abnormality is fusion of the commissures such that the pulmonary valve is effectively converted to a unicuspid or bicuspid funnelshaped valve. This results in restriction of the orifice at the distal portion of the valve, and the resultant stenosis ranges in severity from mild and inconsequential to severe and life-threatening in infancy.

Pulmonary valve stenosis is easily detected and quantified using two-dimensional echocardiographic and Doppler techniques. On two-dimensional echocardiography, thickening and doming of the pulmonary valve are often appreciated (Figs. 13.13 and 13.14), and continuous wave Doppler imaging can be used to accurately determine the peak instantaneous and mean gradients (Fig. 13.15). Because the orientation of the right ventricular outflow tract and pulmonary artery flow is directed posteriorly, there is a natural alignment of the interrogating beam with the direction of flow, and off-angle interrogation is less of a problem than with aortic stenosis. The same techniques for determining mean and peak instantaneous gradients were discussed previously for the aortic valve, and there is an excellent correlation between catheterization and Doppler hemodynamics for pulmonary valve stenosis as well.

M-mode echocardiography can provide clues to the presence of pulmonary valve stenosis, although it is rarely necessary in contemporary practice in which Doppler techniques predominate for detection and quantification of pulmonary valve stenosis. On M-mode echocardiography (Fig. 13.8), the findings of pulmonary valve stenosis are an accentuated A-wave
amplitude (>6 mm) with thickening of the leaflets. The accentuated A wave occurs only in patients in sinus rhythm and is probably dependent on the presence of concurrent right ventricular hypertrophy. It does not allow quantitation of severity, but the presence of an accentuated A wave is indirect evidence of pulmonary valve stenosis. The origin of the accentuated A wave is the relatively elevated right ventricular diastolic pressure in comparison with the pulmonary artery diastolic pressure. With atrial contraction, pressure is transmitted by the hypertrophied noncompliant right ventricle to the pulmonary valve and pulmonary artery. With atrial contraction, right ventricular outflow tract pressure exceeds pulmonary artery diastolic pressure, and there is accentuated presystolic opening of the pulmonary valve. As noted previously, this is a qualitative descriptor implying the presence of pulmonary valve stenosis but provides no quantitative information.


FIGURE 13.13. Transthoracic echocardiogram recorded in a parasternal short-axis view in a patient with pulmonic stenosis. Note the thickening of the pulmonary valve cusps (arrows) and the continuous wave Doppler velocity of 4.5 m/sec corresponding to a peak pressure gradient across the pulmonary valve of 81 mm Hg. The color Doppler image depicts eccentric acceleration toward the stenotic orifice as well as an eccentric jet in the pulmonary artery. PA, pulmonary artery.


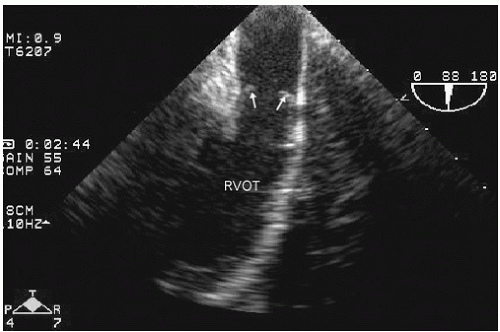
FIGURE 13.14. Transesophageal echocardiogram recorded in an adolescent with congenital pulmonary valve stenosis. This image was recorded in midsystole. Note the thickening of the pulmonary valve leaflets and the doming motion (arrows) characteristic of valvar pulmonary stenosis. (Courtesy of Gregory Ensing, MD.)


Pulmonary Valve Regurgitation

Minor degrees of pulmonary valve regurgitation are commonly encountered in the normal disease-free population and do not necessarily imply anatomic disease of the pulmonary valve, pulmonary artery, or elevated pulmonary artery pressures (Figs. 13.11 and 13.12). There are several pathologic causes of pulmonary valve regurgitation, including its association with pulmonary valve stenosis. Dilation of the pulmonary annulus, which can be idiopathic or due to pulmonary artery dilation,
which in turn is a consequence of pulmonary hypertension, also results in pulmonary valve regurgitation. Occasionally, one encounters congenital absence of one or more pulmonary valve cusps, which results in severe pulmonary valve regurgitation.


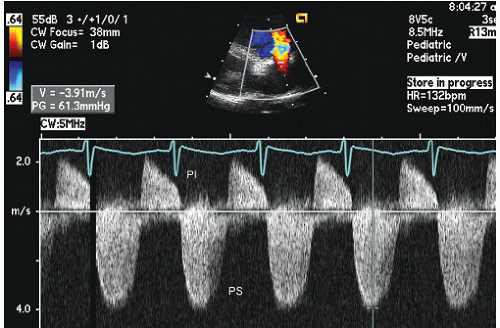
FIGURE 13.15. Continuous wave Doppler imaging through the right ventricular outflow tract and pulmonary valve in a patient with pulmonary valve stenosis. Note the peak pressure gradient of 61 mm Hg and the presence of concurrent pulmonary valve insufficiency. PI, pulmonary valve insufficiency; PS, pulmonary valve stenosis.

Detection of pulmonary valve regurgitation relies almost exclusively on color flow imaging. Using color Doppler imaging, typically from a parasternal short-axis view at the base of the heart, one detects a diastolic retrograde jet. Using pulsed Doppler imaging, one can detect a retrograde spectral profile directed toward the transducer similar to that seen in aortic regurgitation. Because mild degrees of pulmonary valve regurgitation can be highly eccentric, blind scanning with spectral Doppler can often miss the pulmonary valve regurgitation jet, whereas it is easily detected by color flow Doppler imaging.

Determination of the severity of pulmonary valve regurgitation is less well validated than determination of aortic regurgitation, in large part due to the lack of reliable standards for comparison. In general, similar guidelines are clinically used for determining the severity of pulmonary valve regurgitation, including determination of overall jet size, depth of penetration into the right ventricle, vena contracta width, and its overall width in relation to the right ventricular outflow tract (Fig. 13.16). One should also rely on indirect evidence of a hemodynamic effect from the pulmonary valve regurgitation such as right ventricular dilation and a right ventricular volume overload. The latter, in the absence of other causes of right ventricular overload, is evidence of at least moderate pulmonary valve regurgitation. Occasionally, color flow Doppler imaging can be misleading in the presence of wide-open or “free” pulmonic regurgitation. This phenomenon is seen in patients with congenital absence of one or more pulmonary valve cusps or who have had resection of one or more cusps for repair of severe congenital stenosis in infancy. Because the pulmonary artery is a low-pressure system and there is no constraining regurgitant orifice, a classic convergent zone, vena contracta and downstream jet may not be easily visualized, but rather one simply appreciates a continuous color flow signal in the right ventricular outflow tract and proximal pulmonary artery without the classic findings of a true regurgitant “jet.” The spectral Doppler profile will help confirm the nearly continuous to and fro flow through the outflow tract and allow the echocardiographer to appropriately identify the presence of “free” pulmonic insufficiency (Fig. 13.17).

As with other valvular lesions, inspection of the retrograde spectral signal also provides indirect clues to the severity of pulmonary valve regurgitation, with relatively dense signals suggesting a higher volume of regurgitant blood flow than faint signals and short deceleration times having the same implication as for aortic regurgitation (Fig. 13.18).

The diastolic flow velocities of pulmonary valve regurgitation can be used to calculate pulmonary artery diastolic pressure using the modified Bernoulli equation. In this setting, one calculates the end-diastolic gradient between the pulmonary artery and the right ventricular outflow tract from the velocity of the pulmonary regurgitation jet (Fig. 13.19). If one then adds an assumed right ventricular diastolic pressure (in turn assumed to equal right atrial pressure), the equation PADP = RVEDP + ΔPpv can be applied, where ΔPpv equals the pressure gradient between the pulmonary artery and the right ventricular outflow tract from the spectral profile. This calculation of pulmonary artery diastolic pressure has had substantial use in congenital heart disease. When combined with the determination of right ventricular systolic pressure from the tricuspid regurgitation jet, it allows calculation of both systolic and diastolic pulmonary artery pressures. Using the combination of pulmonary artery diastolic and systolic pressures, one can then calculate mean pulmonary artery pressure as PAmean = (PAsystolic + 2PAdiastolic)/3.


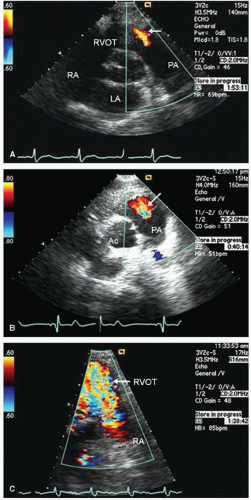
FIGURE 13.16. Parasternal short-axis view color Doppler flow images recorded in patients with mild (A), moderate (B), and severe (C) pulmonary valve insufficiency. PA, pulmonary artery.


Miscellaneous Abnormalities of the Pulmonary Valve

There are rare tumors and masses that can be seen on the pulmonary valve. As with any of the four cardiac valves, infectious endocarditis can involve the pulmonary valve, although it is substantially less frequent than involvement of any of the other three cardiac valves. When present, vegetations take on a similar oscillating appearance to that noted in other valve involvement. Occasionally, a fibroma or papilloma can be seen on the pulmonary valve, in which case, it takes on the typical appearance of a small spherical mass, usually attached to the leaflet by a thin stalk.

Only gold members can continue reading. Log In or Register to continue

Stay updated, free articles. Join our Telegram channel

Jun 22, 2016 | Posted by in CARDIOLOGY | Comments Off on Tricuspid and Pulmonary Valves

Full access? Get Clinical Tree

Get Clinical Tree app for offline access