Mitral Valve Disease


Mitral Valve Disease


The mitral valve was the first of the four cardiac valves to be evaluated with echocardiography. This was due to the relatively high prevalence of rheumatic heart disease and the relatively large excursion of the mitral valve leaflets, which made them an easier target for early M-mode techniques. M-mode echocardiography was instrumental in providing early clues to the severity of mitral stenosis and documenting changes after open mitral commissurotomy. Modern two-dimensional and Doppler techniques have made echocardiography an essential tool in the management of patients with known and suspected mitral valve disease. More recently, three-dimensional echocardiography has been shown to play a unique role in mitral valve disease. While its incremental clinical benefit has not been proven in many disease states, disease of the mitral valve, including detection of flail leaflets and assessment of mitral stenosis have been shown to be facilitated by three-dimensional imaging. Primary mitral valve disease can be the major contributor to cardiovascular symptoms. In addition, the mitral valve often is affected in a secondary manner in other cardiac diseases. Table 12.1 outlines the primary and secondary causes of mitral valve disease. These include congenital lesions such as congenital mitral stenosis and acquired valve disease such as rheumatic heart disease. Other forms of acquired disease, typically presenting later in life, include ischemic papillary muscle dysfunction and degenerative diseases.

Echocardiography is the primary diagnostic tool for evaluating patients with known or suspected mitral valve disease. The recently published “Appropriateness Criteria for the Utilization of Transthoracic and Transesophageal Echocardiography” have defined multiple indications for the utilization of transthoracic and transesophageal echocardiography in patients with known or suspected mitral valve disease (Table 12.2). The range of patients evaluated for suspected mitral valve disease is substantial and includes those with murmurs of uncertain significance, as well as patients with congestive heart failure, ischemic heart disease, and dilated and hypertrophic cardiomyopathies.


Table 12.1 Etiology of Mitral Valve Disease


Diseases directly affecting the mitral apparatus


Rheumatic heart disease


Congenital mitral stenosis


Congenital cleft mitral valve


Infectious endocarditis


Marantic endocarditis


Libman-Sacks endocarditis


Hypereosinophilic heart disease


Coronary artery disease


Diet-drug valvulopathy


Mitral annular calcification


Degenerative


Infiltrative


Carcinoid


Myocardial ischemia infarction


Indirect effect on mitral valve function


Dilated cardiomyopathy


Hypertrophic cardiomyopathy


Left atrial myxoma


Anatomy of the Mitral Valve

The leaflets of the mitral valve constitute only a portion of the mitral valve apparatus. Diseases resulting in mitral dysfunction often are caused by abnormalities in the overall apparatus rather than in the actual leaflets. The components of the mitral valve apparatus are schematized in Figure 12.1 and include the mitral annulus, leaflets, chordae tendineae, papillary muscles, and the underlying ventricular wall. Pathologic changes in any component of the mitral valve apparatus can result in mitral valve dysfunction. A classic form of mitral valve disease is rheumatic heart disease, which involves predominantly the leaflets and chordae. Other forms of mitral valve disease involve different aspects of mitral apparatus. Table 12.3 outlines the impact of different disease states on the different components of the mitral apparatus and the degree to which they result in mitral regurgitation or stenosis.

The mitral annulus is a complex three-dimensional structure and is part of the fibrous skeleton of the heart, which also includes the aortic annulus, the junction of the anterior mitral valve leaflet and aorta (anuloaortic fibrosa), and the tricuspid annulus. Three-dimensional echocardiography has been instrumental in demonstrating the nonplanar nature of the mitral annulus and the implications of this complex geometry for the diagnosis of mitral valve prolapse as well as for the design of therapeutic interventions such as mitral anuloplasty rings. Figure 12.2 depicts the anatomy of the mitral annulus and its relationship to mitral leaflet closure patterns.

There are two mitral valve leaflets, referred to as anterior and posterior. (An alternate nomenclature uses the terms septal and mural.) Figure 12.3, which details mitral valve leaflet anatomy further, reveals that the mitral leaflet should be viewed not as a two-leaflet structure but as a six-scallop structure. (Some investigators have proposed an even more complex description of mitral valve anatomy including as many as eight separate coaptation points.) This figure also depicts the perspective with which the mitral valve is viewed anatomically (from the left atrium) and with transthoracic and transesophageal echocardiography. Clinically, the most easily understood and clinically useful description of mitral valve anatomy divides it into six scallops, three each for the anterior and posterior leaflet, designated as scallop 1, 2, and 3. Scallop 1 is most lateral and scallop 3 is most medial. Chordae attach throughout the entire length of the coaptation line of each of the mitral valve leaflets and insert into the tips of the papillary muscles.

Anatomically, there are two major papillary muscles, each of which may have several heads. The anterolateral papillary muscle provides chordae to the anterolateral half of both mitral
leaflets. The posteromedial papillary muscle provides chordae to the posteromedial aspect of both leaflets. There is substantial variability in the exact number of chordae and the percentage of chords that are devoted to the anterior and posterior leaflets, but in general both papillary muscles provide chordal attachments to a portion of each of the leaflets. The posteromedial papillary muscle typically is perfused by the right coronary artery, and the anterolateral papillary muscle has a dual blood supply. Because of the dual blood supply of the anterolateral papillary muscle, it is less susceptible to ischemic injury than the posteromedial papillary muscle.


Table 12.2 Appropriateness Criteria for Use of Echocardiography in Mitral Valve Disease


Indication


Appropriateness Score (1-9)


1.


Symptoms potentially due to suspected cardiac etiology, including but limited to dyspnea, shortness of breath, lightheadedness, syncope, TIA, cerebrovascular events


A (9)


2.


Prior testing that is concerning for heart disease (i.e., chest x-ray, baseline scout images for stress echocardiogram, ECG, elevation of serum BNP)


A (8)


10.


Evaluation of known or suspected pulmonary hypertension including evaluation of right ventricular function and estimated pulmonary artery pressure


A (8)


14.


Evaluation of respiratory failure with suspected cardiac etiology


A (8)


17.


Initial evaluation of murmur in patients for whom there is a reasonable suspicion of valvular or structural heart disease


A (9)


18.


Initial evaluation of patient with suspected mitral valve prolapse


A (9)


20.


Initial evaluation of known or suspected native valvular stenosis


A (9)


22.


Routine (yearly) evaluation of an asymptomatic patient with severe native valvular stenosis


A (7)


23.


Reevaluation of a patient with native valvular stenosis who has had a change in clinical status


A (9)


24.


Initial evaluation of known or suspected native valvular regurgitation.


A (9)


26.


Routine (yearly) evaluation of an asymptomatic patient with severe native valvular regurgitation with no change in clinical status.


A (8)


27.


Reevaluation of native valvular regurgitation in patients with a change in clinical status


A (9)


31.


Initial evaluation of suspected infective endocarditis (native and/or prosthetic valve) with positive blood cultures or a new murmur


A (9)


53.


Guidance during percutaneous noncoronary cardiac interventions including but not limited to septal ablation in patients with hypertrophic cardiomyopathy, mitral valvuloplasty, PFO/ASD closure, radiofrequency ablation (TEE)a


A (9)


54.


To determine mechanism of regurgitation and determine suitability of valve repair (TEE)a


A (9)


19.


Routine (yearly) reevaluation of mitral valve prolapse in patients with no or mild mitral regurgitation and no change in clinical status


I (2)


21.


Routine (yearly) reevaluation of an asymptomatic patient with mild native AS or mild-moderate native MS and no change in clinical status


I (2)


25.


Routine (yearly) reevaluation of native valvular regurgitation in an asymptomatic patient with mild regurgitation, no change in clinical status, and normal LV size


I (2)


Reprinted with permission of the ACCF from Douglas PS, Khandheria B, Stainback RF, et al. ACCF/ASE/ACEP/ASNC/SCAI/SCCT/SCMR 2007 appropriateness criteria for transthoracic and transesophageal echocardiography. J Am Coll Cardiol 2007;50(2):187-204.


a TEE, transesophageal echocardiography is considered the primary imaging method.


ASD, atrial septal defect; BNP, brain natriuretic peptide; ECG, electrocardiogram; PFO, patent foramen ovale; TIA, transient ischemic attack.


Figure 12.4 schematizes the relationship between the anterior and posterior leaflets and their scallops to transesophageal echocardiographic planes. Figures 12.5, 12.6, 12.7 and 12.8 depict normal transthoracic and transesophageal echocardiographic images recorded in various imaging planes outlining the relationship of the echocardiographic image to the anatomic mitral valve. Because of the curved C shape of the closed mitral valve, confusion often arises when dealing with a flail mitral valve leaflet. The C-shaped coaptation results in image planes in which alternating portions of the anterior and posterior leaflets may be visualized simultaneously (see the 60° plane in Figs. 12.4 and 12.8). It is not uncommon to detect multiple regurgitation jets in this view. Coaptation of the mitral valve is complex and involves overlap of mitral valve tissue over a variable length of the mitral valve leaflet. Coaptation is not isolated to the mitral valve tips but is the result of overlap of several millimeters of tissue (the zona coapta) (Figs. 12.7 and 12.9). Because of this, the closing force of the anatomically intact mitral valve increases with systolic pressure as the leaflets are forced to coapt along a longer portion of their terminal length. Any disease process that reduces the ability of the mitral valve to coapt along a several-millimeter length will result in inefficient or incomplete coaptation and subsequent regurgitation. Figure 12.10 schematizes abnormal coaptation patterns seen in a variety of disease states. It should be emphasized that disease processes occurring anywhere along the length of the mitral apparatus (from the annulus to the base of the papillary muscle) can result in malfunction of the mitral valve.


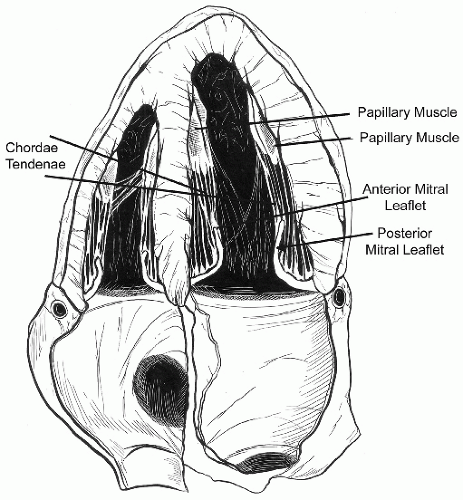
FIGURE 12.1. Anatomic rendering of the normal mitral valve apparatus. Note that the chordae are attached not only to the tips of the mitral valve leaflets but also to the mid portion of the leaflets. (Artwork by Amanda Almon and Travis Vermilye.)


Table 12.3 Anatomic Correlates of Disease of the Mitral Valve


MS


MR


Annulus


Leaflets


Chordae


Papillary Muscles


Left Ventricular Wall


Rheumatic heart disease


[check mark]


[check mark]


[check mark]


[check mark]


Congenital mitral stenosis


[check mark]


[check mark]


[check mark]


[check mark]


Cleft mitral valve


[check mark]


[check mark]


Bacterial endocarditis


[check mark]


*


[check mark]


[check mark]


*


Coronary artery disease-myocardial infarction


[check mark]


[check mark]


[check mark]


Diet-drug valvulopathy


[check mark]


[check mark]


[check mark]


Mitral annular calcification


±


[check mark]


[check mark]


±


Dilated cardiomyopathy


[check mark]


[check mark]


[check mark]


[check mark]


Hypertrophic cardiomyopathy


[check mark]


[check mark]


[check mark]


[check mark]


Myxoma


[check mark]


[check mark]


±


Radiation


±


[check mark]


[check mark]


[check mark]


Infiltrative


[check mark]


[check mark]


[check mark]


Carcinoid


[check mark]


[check mark]


[check mark]


[check mark]


Papilloma


±


[check mark]


[check mark]


Metastatic disease


±


±


±


±


±


MS, mitral stenosis; MR, mitral regurgitation; [check mark], common and primary involvement; ±, infrequent or late-stage involvement; *, rare abscess formation.


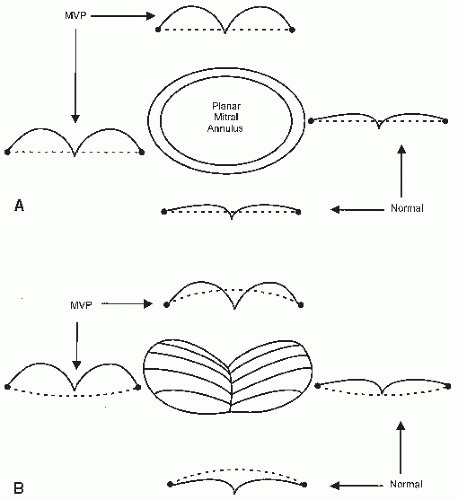
FIGURE 12.2. Schematic representation of a hypothetical planar mitral valve annulus (A) and the more accurate three-dimensional geometry of the annulus (B). In each set of schematics, the plane of the annulus is depicted as a dotted line and either a normal mitral valve or a mitral valve with mitral valve prolapse, depicted as viewed from orthogonal planes. A: Note that a planar annulus results in the same appearance of the mitral valve when viewed from two perspectives 90° apart. Normal mitral closure is noted on the right and the bottom of each schematic and mitral valve prolapse at the top and left. Note that the normal valve closes with the belly of the leaflet slightly behind the plane of the annulus, irrespective of the viewing perspective, and that the prolapse valve bows to a substantially greater degree. B: Because of its complex three-dimensional shape, the annulus may be either concave or convex toward the apex of the left ventricle depending on the viewing perspective. With a normal closure pattern in the lower annular schematic, note that the leaflet does not protrude above the plane of the annulus. The schematic to the right represents the identical closing geometry of the mitral valve, which now appears to prolapse behind the plane of the annulus because of its geometry in that perspective. The upper and leftward schematics depict the appearance of mitral valve prolapse as it relates to the saddle-shape geometry. In each instance, the geometry of the prolapse schematic is identical. Note the substantially greater degree to which prolapse is apparent on the left in B versus in A, which is related to the different contour of the annulus when viewed from the orthogonal views. MVP, mitral valve prolapse.


Physiology of Mitral Valve Disease

Physiologic abnormalities of mitral valve disease can be classified as stenosis, regurgitation, and a combination of the two. The classic form of mitral valve disease is rheumatic mitral stenosis in which the leaflet tips and chordae are involved and a transvalvular gradient develops, obstructing flow from the left atrium to the left ventricle. This has the effect of increasing left atrial pressure, which is transmitted to the pulmonary veins and pulmonary capillary bed. This elevated pressure then translates to an increased driving force for transudation of fluid into the alveoli and development of pulmonary congestion. Typically, with normal plasma oncotic pressure, fluid extravasation into the alveoli occurs at a pulmonary capillary pressure of approximately 24 mm Hg. Extravasation of fluid into the alveoli interrupts pulmonary gas exchange and results in dyspnea, initially with exercise but subsequently at rest, and to a variable degree may lead to secondary pulmonary hypertension. Development of pulmonary hypertension in the presence of increased pulmonary venous pressure is initially due to increased pulmonary vasoreactivity, but in chronic cases, fixed anatomic changes occur in the pulmonary vascular bed. Chronically elevated left atrial pressure, due to obstruction at the mitral valve level, results in secondary dilation of the left atrium. Over time, this results in progressive fibrosis in the atrial myocardium with a subsequent decrease in atrial contractility, stasis of blood, and the potential for atrial fibrillation and thrombus formation.


Mitral Stenosis

In adults, the etiology of mitral stenosis is most often rheumatic heart disease. Many patients with rheumatic mitral stenosis have no recognized history of rheumatic fever, but the morphology of the valve permits establishment of a diagnosis of antecedent rheumatic fever. A far less common etiology of mitral stenosis is congenital mitral stenosis. Infrequently, mitral annular calcification progresses to the point that it obstructs mitral valve inflow and mimics mitral stenosis. Tumors such as left atrial myxoma have been described as mimicking mitral stenosis, but presentation as occult mitral stenosis by a myxoma is exceptionally rare in contemporary practice.


FIGURE 12.3. Schematic representation of the mitral valve from multiple perspectives. Bottom: The view of the mitral valve in a surgical approach from inside the left atrium. Top: The mitral valve as viewed from a traditional transthoracic parasternal short-axis view. Middle: The mitral valve is seen from a transesophageal approach at the mid gastric level. In each instance, the proximal aorta is as noted in the schematic, as is the left atrial appendage. The three distinct scallops of the anterior and posterior leaflets (A1, A2, A3, P1, P2, P3) are also schematized. L, left coronary sinus; N, noncoronary sinus; R, right coronary sinus.


Two-Dimensional Echocardiography in Rheumatic Mitral Stenosis

The classic findings of rheumatic mitral stenosis involve thickening and fusion of the mitral valve commissural edges and chordae. This results in characteristic abnormalities of the mitral leaflet opening. Normally, the anterior and posterior leaflets open with a pattern that involves maximal excursion at the leaflet tips with substantially greater excursion of the anterior leaflet. In mitral stenosis, due to commissural fusion, the leaflets open with a “doming” motion. In rheumatic heart disease, the open anterior leaflet has also been described as having a “hockey stick” appearance. Initially, this results in reduction of the orifice and conversion of the mitral apparatus from a tubular channel to a funnel-shaped orifice. It should be recognized that the limiting factor in flow from the left atrium to the left ventricle is the orifice of the mitral valve and chordae at their junction. The degree of chordal thickening and mitral valve commissural fusion is highly variable. Over time, there is progressive fibrosis at the initial site of fusion as well as throughout the more distal chordae and more proximal leaflets. Eventually, this results in stiffening and calcification of these structures. Figures 12.11, 12.12, 12.13, 12.14, 12.15, 12.16 and 12.17 were recorded in patients with rheumatic mitral valve involvement. In Figures 12.11 and 12.12, the relatively pliable belly of the mitral valve leaflets with the disease limited to the tips and chordae is shown. In contrast, Figures 12.13,
12.14 and 12.15 show substantial fibrosis or calcification. In Figure 12.16, diffuse thickening and fibrosis of the entire extent of the leaflets and chordae are shown.


FIGURE 12.4. Expanded view of the mitral valve as seen from a transthoracic echocardiographic approach. This image corresponds to the top image of Figure 12.3. The imaging plane of a traditional transverse (0°) plane and parasternal long-axis view (or 120° transesophageal echocardiographic view) are as noted. Note that when imaged from a 60° imaging plane (commissural view) with a transesophageal echocardiographic probe, the imaging plane will intersect the P1, A2, P3 intersection. A1, A2, A3, anterior scallops 1 through 3; L, left coronary sinus; N, noncoronary sinus; P1, P2, P3, posterior scallops 1 through 3; PLAX, transthoracic parasternal long-axis plane; R, right coronary sinus; TEE, transesophageal echocardiography.


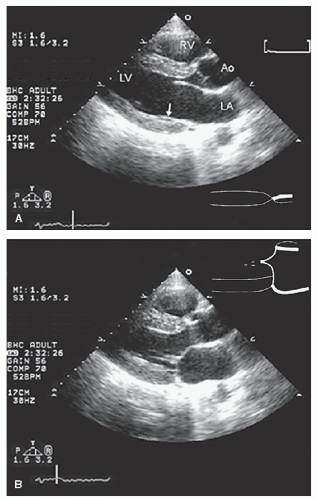
FIGURE 12.5. Parasternal long-axis view recorded in diastole (A) and systole (B) in a patient with a normal mitral valve. A: Note the anterior and posterior mitral valve leaflets. The posterior leaflet lies against the inferoposterior wall of the left ventricle (arrow) and may not be clearly seen when fully open. B: Both leaflets have moved toward the center of the left ventricular cavity and have closed with a 2- to 3-mm zone of overlap (the zona coapta). This is schematized in the middle to the right.


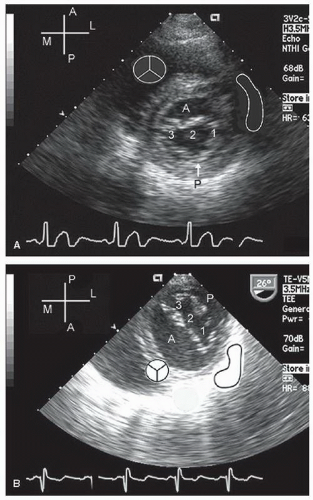
FIGURE 12.6. Parasternal short-axis view (A) and transesophageal short-axis view from a transgastric position (B) recorded in normal patients. The positions of the aorta and left atrial appendage are as noted by the schematics. In each of these examples, recorded in diastole, the anterior (A) and posterior (P) leaflets of the mitral valve are clearly visualized and the three distinct regions (1-3) can be seen. For each imaging format, notice that the A1/P1 coaptation point is closest to the left atrial appendage and the A3/P3 coaptation closest to the ventricular septum. M, medial; L, lateral.


FIGURE 12.7. Apical four-chamber view recorded in systole in a normal patient. In this image, the normal closure pattern of the anterior and posterior leaflets of the mitral valve is clearly demonstrated. At the upper right, the closure pattern has been expanded. Note that the anterior and posterior mitral valve leaflets do not close tip to tip but rather along a 4-mm length (the zona coapta [ZC]).


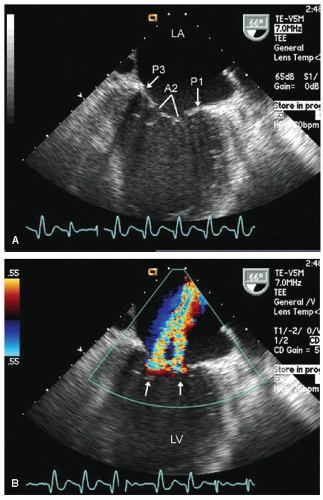
FIGURE 12.8. Transesophageal echocardiogram recorded at 66°. In this view, the P1, A2, and P3 scallops are clearly visualized (A). B: Note the two separate mitral regurgitation jets (arrows) arising from the P1-A2 and P3-A2 commissures. A1, A2, A3, anterior scallops 1 through 3; P1, P2, P3, posterior scallops 1 through 3.


FIGURE 12.9. Anatomic rendering of the normal mitral valve in a closed position. Again note the chordae that attach not only to the leaflet tips but to the belly of the leaflet as well. Also note that the normal mitral valve does not close in a tip-to-tip manner but that there is an overlap of the leaflets as they close (the zona coapta). (Artwork by Amanda Almon and Travis Vermilye.)


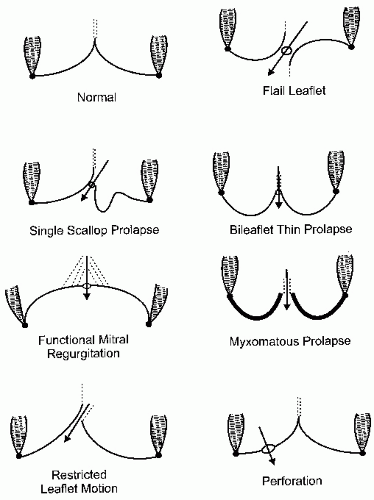
FIGURE 12.10. Schematic drawings demonstrate a normal mitral valve closure pattern (upper left) and multiple different pathologic closure patterns. In each example, the annulus (small black dot) and proximal ventricular wall are denoted. At the point of the intended coaptation, the open circle denotes the regurgitant orifice and the arrow denotes the direction of the regurgitant flow. The dotted lines denote the mitral valve chordae.


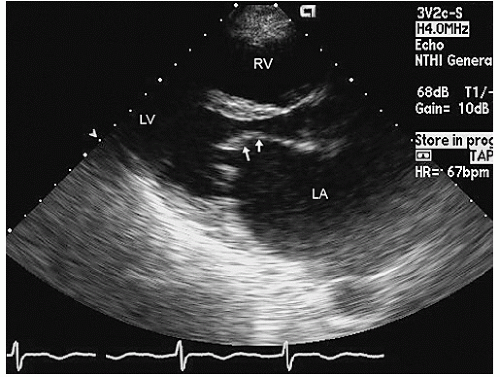
FIGURE 12.11. Transthoracic parasternal long-axis view echocardiogram recorded in a patient with rheumatic mitral stenosis. In this image, recorded in early diastole, note the doming motion of the anterior mitral valve leaflet with restriction of motion at the tips. The belly of the leaflet (arrows) is pliable, and there is little or no fibrosis, calcification, or thickening of the leaflets. Also note the secondary dilation of the left atrium. In the real-time image, note the relatively fixed position of the leaflet tips with all motion of the leaflet occurring at the mid and proximal portions of the leaflets.


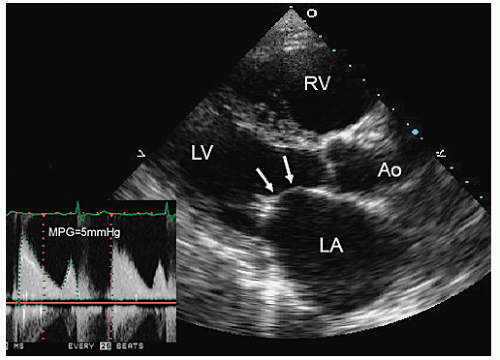
FIGURE 12.12. Parasternal transthoracic echocardiogram recorded in a patient with rheumatic mitral valve stenosis. The image frame was recorded in diastole and shows classic “doming” of the anterior mitral leaflet (arrows) as well as the dilated left atrium. Note the somewhat greater degree of focal thickening at the tips of the leaflets in comparison to Figure 12.11. Continuous wave Doppler showed a transmitral gradient of 5 mm Hg across the valve from an apical position (inset) MPG, mean pressure gradient.


FIGURE 12.13. Parasternal long-axis view (A) and apical four-chamber view (B) recorded in a patient with mitral stenosis. A: Note the marked doming of the mitral valve in diastole with focal thickening at the tips of both the anterior and posterior leaflets. In the real-time image, note that pliability of the mid portion of the mitral valve. B: Apical four-chamber view reveals a similar phenomenon with doming of the mitral valve in diastole toward the apex.


Congenital Mitral Stenosis

Congenital mitral stenosis is infrequently encountered in contemporary adult practice. There are two forms of congenital mitral stenosis. The first is the “parachute” mitral valve. It typically occurs in conjunction with a single papillary muscle to which all chordae of an otherwise normal valve attach. This limits the mobility of the leaflets and results in restriction of inflow to a variable degree. The second type of congenital mitral stenosis is due to an anatomic abnormality of the valve and chordae resulting in a combination of reduced mobility and an intrinsic reduction in the anatomic orifice due to abnormal leaflet morphology (Fig. 12.17). This is discussed further in Chapter 20, Congenital Heart Diseases.


M-Mode Echocardiography

M-mode echocardiography was one of the early tools used for the evaluation of rheumatic mitral valve disease. The hallmark
of rheumatic heart disease on M-mode echocardiography was increased echogenicity of the leaflets with decreased excursion and reduced separation of the anterior and posterior leaflets. This was accompanied by a reduced diastolic (E-F) slope of mitral closure (Fig. 12.18). The E-F slope could be measured in millimeter per second and followed after intervention (the only intervention available at the time that this measurement was commonly undertaken was open mitral commissurotomy). The E-F slope was inversely correlated with the severity of mitral stenosis and improved (i.e., became steeper) after successful commissurotomy. The E-F slope ultimately proved to be nonspecific and was noted in situations in which left ventricular filling was impaired such as in diastolic dysfunction. The E-F slope is of more historical than clinical value today. Additional features of mitral stenosis noted on M-mode echocardiography included “paradoxical” anterior diastolic motion of the posterior mitral valve leaflet. This occurred because tethering at the tips resulted in an obligatory anterior motion of the posterior leaflet tips that tethered to the larger anterior leaflet. M-mode echocardiography has been replaced by two-dimensional echocardiography and Doppler techniques as a means of diagnosing and quantifying mitral stenosis.


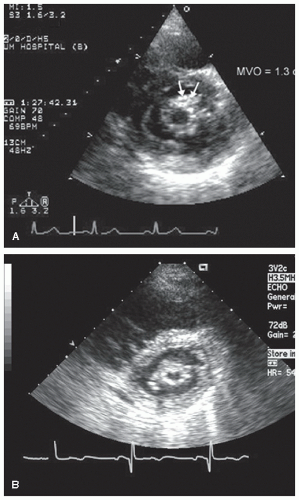
FIGURE 12.14. Parasternal short-axis views recorded in patients with rheumatic mitral stenosis. In each instance, note the restricted mitral valve orifice. A: The orifice can be planimetered as 1.3 cm2. In this example, note the localized thickening of the chordae at the anterolateral border of the mitral orifice (arrows). B: Recorded in a patient with more severe stenosis. The mitral orifice has been planimetered at 0.7 cm2. Also note the diffuse nature of thickening around the mitral orifice. MVO, mitral valve orifice.


FIGURE 12.15. Apical four-chamber view recorded in a patient with rheumatic mitral stenosis. Note the marked dilation of the left atrium. In this example, there is substantial, focal calcification of the anterior mitral valve leaflet (arrow). Note also the relatively restricted motion of both leaflets along their full length.


FIGURE 12.16. Parasternal long-axis (A) and short-axis (B) transthoracic echocardiograms recorded in a patient with rheumatic mitral stenosis. A: Note the marked thickening of the chordae throughout their entire length, from the mitral leaflet to the papillary muscles. In the short-axis view (B), the slit-like orifice of the mitral valve is visualized.


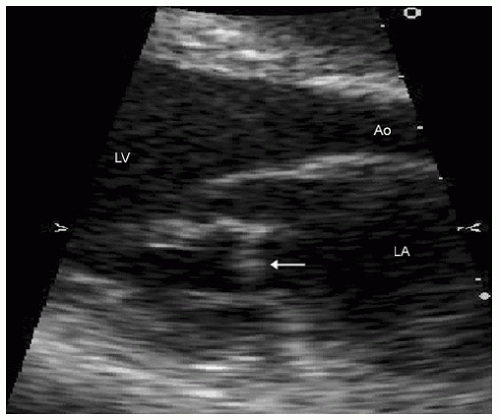
FIGURE 12.17. Expanded parasternal long-axis view recorded in a young patient with congenital mitral stenosis. Note the abnormal position of chordae to the posterior mitral leaflet (arrow), which restricts its motion, resulting in mitral stenosis. IVS, interventricular septum.


Transesophageal Echocardiography

Transesophageal echocardiography provides additional information in patients with rheumatic mitral stenosis. It should be emphasized, however, that for diagnosis and quantification, there is little incremental yield afforded by transesophageal echocardiography in patients in whom a high-quality, twodimensional echocardiogram can be obtained. There is incremental value of the transesophageal echocardiogram with respect to secondary findings such as left atrial appendage thrombus. Although transesophageal echocardiography provides a higher resolution view of the mitral valve apparatus, it may understate the severity of mitral annular and chordal
involvement when the mitral valve is viewed from the left atrial aspect. Use of transgastric planes in 90° to 120° views can provide detailed visualization of the chordal apparatus (Figs. 12.19, 12.20 and 12.21).


FIGURE 12.18. M-mode echocardiogram recorded in a patient with rheumatic mitral stenosis. Note the marked thickening of the mitral valve leaflets and the flat E-F slope during diastole. The posterior leaflet appears to move anteriorly in diastole as well.


FIGURE 12.19. Transesophageal echocardiogram recorded in transverse and longitudinal views in a patient with mitral stenosis. A, B: In both images, note the diffuse thickening of the mitral leaflets with the doming motion in diastole. B: Also note the diffuse thickening of the chordae (arrows).


Role of Three-Dimensional Echocardiography

Three-dimensional echocardiography either from a transthoracic or transesophageal approach can be used for a sophisticated evaluation of the mitral valve anatomy in both normal and diseased states. Modern scanners provide real-time threedimensional imaging with an imaging perspective “within the left atrium” and may be particularly valuable for precise localization of an eccentrically located stenotic orifice, thus allowing more precise measurement. Figure 12.22 is a real-time threedimensional image acquired from a transesophageal approach in a patient with rheumatic mitral stenosis. The walls of the left atrium as well as the orifice of the mitral valve are visualized. This image uniquely provides a perspective as visualized by the surgeon at the time of mitral valve surgery. Figure 12.23 was recorded in a patient with rheumatic mitral stenosis and regurgitation using three-dimensional transesophageal echocardiography and color flow Doppler. The dome-like configuration of the mitral orifice is clearly visualized in the real-time image, as is the mitral regurgitation jet.


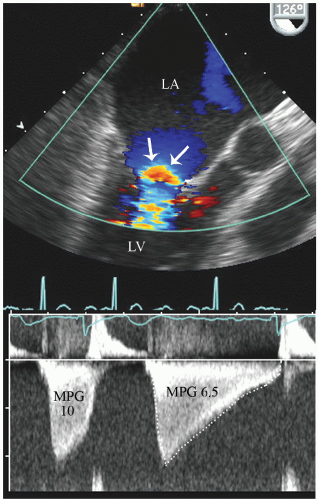
FIGURE 12.20. Transesophageal echocardiogram recorded from a 126° imaging angle from behind the left atrium. Note the doming of the mitral valve in diastole and the color flow convergence zone within the left atrium (arrows) as flow accelerates toward the restricted orifice. The continuous wave Doppler through the restricted orifice is also presented revealing mean transvalvular gradients of 10 and 6.5 mm Hg for the shorter and longer cycles in this patient with atrial fibrillation. MPG, mean pressure gradient.


Anatomic Determination of Severity

M-mode, two-dimensional, and three-dimensional echocardiography have all been used for the anatomic determination of severity of mitral stenosis. As noted previously, M-mode echocardiography relied on determination of leaflet thickness and the E-F slope as indirect measures of leaflet restriction. Although previously useful for serial follow-up, M-mode echocardiography provided no quantitative data regarding the actual restrictive orifice.

Using two-dimensional echocardiography, it is possible to visualize the actual restrictive orifice of the stenotic mitral valve at its limiting orifice (Figs. 12.14, and 12.16). In patients with relatively symmetric involvement, the orifice area can accurately be planimetered and correlates well with that determined from hemodynamic data. There are several technical factors that must be accounted for in determining anatomic orifice size
from this approach. First, one should recognize that, in mitral stenosis, the mitral valve represents a funnel-shaped structure that tapers to its limiting orifice at the tips and careful scanning must be performed to ensure that the image is frozen and planimetered at the mitral valve tips and not more proximally where the orifice area would be overstated (Fig. 12.24). Second, instrumentation gain, reject, and transmission power all affect the ability to accurately visualize the limiting orifice. Increased gain will result in a “blooming” of the echoes, which then overstates their boundary and thereby diminishes the visualized orifice. When appropriately recorded, the measured orifice area correlates very well with that determined by hemodynamics. After commissurotomy, the orifice often becomes more irregular and the area of the commissural opening may be difficult to planimeter accurately.


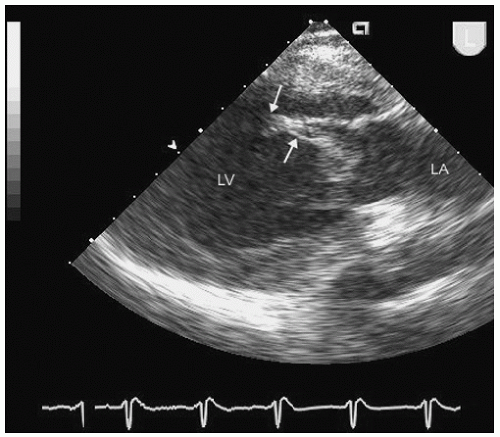
FIGURE 12.21. Transesophageal echocardiogram recorded in a longitudinal view in a patient with rheumatic mitral stenosis. Note the diffuse thickening of the chordae and fibrosis of the papillary muscle tip (arrows).


FIGURE 12.22. Real-time transesophageal three-dimensional echocardiogram recorded from a left atrial perspective in a patient with rheumatic mitral stenosis. Notice the diffuse thickening of the leaflets and the crescent-shaped mitral valve orifice (MVO) noted in both the illustrated schematic and real-time image.


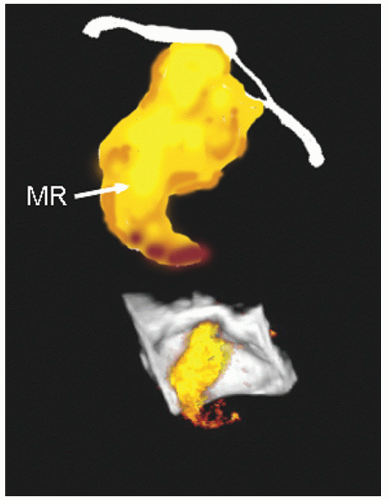
FIGURE 12.23. Three-dimensional echocardiogram with color flow Doppler recorded in a patient with rheumatic mitral stenosis. In the lower panel, note the diffuse thickening and doming of the mitral leaflets and the jet of mitral regurgitation, also schematized in the upper panel. The restricted doming motion of the mitral leaflets are best appreciated in the accompanying real-time image. MR, mitral regurgitation.


Doppler Echocardiographic Determination of Severity

There are several Doppler methods for assessing the severity of mitral stenosis (Fig. 12.25). Doppler echocardiography can be used to determine left atrial to left ventricular transvalvular gradient, which is the single most important factor in determining the functional significance of mitral stenosis. If one understands the hemodynamic and physiologic principles noted previously then the overall hemodynamic effect of mitral stenosis can be derived from the transthoracic echocardiogram. It should be recognized that the transmitral gradient plus the anticipated left ventricular diastolic pressure equals the left atrial pressure. As noted previously, left atrial, pulmonary venous, and pulmonary capillary pressures are all similar and represent the hydrostatic driving pressure leading to pulmonary congestion. The pressure gradient is dependent on volume status, stroke volume, and heart rate, which affect filling time. Determination of the pressure gradient and its overall relevance to left atrial pressure should play an equal role in management to determination of mitral valve area.

In most patients, the Doppler inflow profile of the mitral pressure gradient is easily measured from the transthoracic echocardiogram recorded from the apical view. It can often be recorded in individuals in whom two-dimensional scanning
provides suboptimal anatomic definition of the mitral valve. The transmitral gradient should be recorded using continuous wave Doppler imaging aligned as parallel as possible to the anticipated flow. If pulsed wave Doppler imaging is used, it is essential that the sample volume be placed at the level of the restrictive orifice and not further back near the annulus. Placement of the sample volume near the annulus will result in systematic underestimation of the transmitral gradient. In general, rheumatic mitral stenosis results in a central stenotic orifice with flow directed from the left atrium toward the apex of the left ventricle. As such, traditional two- and four-chamber viewing planes usually suffice for measurement. If necessary, color flow imaging can be used to determine the direction of flow and further refine this assessment. The peak and mean pressure gradient can be obtained online by electronic planimetry of the spectral profile (Fig. 12.26). Atrial fibrillation with an irregular heart rate poses additional problems. Depending on the diastolic filling time, there may be dramatic variation in the mean transvalvular gradient and multiple cycles should be averaged to provide an accurate assessment of severity (Fig. 12.27).


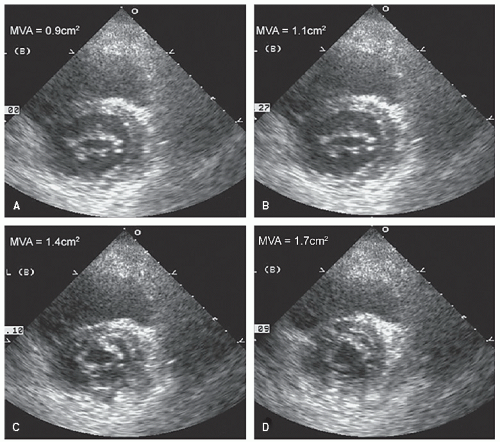
FIGURE 12.24. Series of parasternal short-axis views recorded in a patient with rheumatic mitral stenosis. A: Recorded at the actual restrictive orifice, and the mitral valve area (MVA) can be planimetered at 0.9 cm2. B-D: The three additional views were recorded progressively closer to the annulus and show a progressive increase in the planimetered mitral orifice depending on the position at which the “orifice” is planimetered.


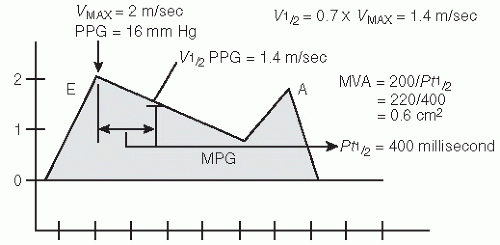
FIGURE 12.25. Schematic representation of mitral valve inflow depicting different parameters that can be extracted for determination of the severity of mitral stenosis. In the schematic, note the relatively flat decay of pressure from the E point. Parameters that can be measured include integration of the overall pressure gradient beneath the spectral display to calculate the mean pressure gradient (MPG) as well as calculation of mitral valve area (MVA) from the pressure half-time method. For the pressure half-time method, the time required for the pressure to decay from its peak value (16 mm Hg in this example) to one half of that value (8 mm Hg) is determined. The velocity at which the gradient has declined to one half its peak can be calculated as 0.7 × VMAX. This value (400 milliseconds in this example) is then entered into the equation MVA = 220/Pt½. In the schematic, the MVA calculates to 0.6 cm2. PPG, peak pressure gradient.

An additional feature of the pressure gradient is the rapidity with which the instantaneous pressure gradient decays over time. It was recognized relatively early in the hemodynamic laboratory that individuals in whom the pressure gradient persisted to the end of diastole had more severe stenosis than those individuals in whom the pressure gradient declined to near zero at end-diastole. A measure of the rate of decay of the mitral valve gradient is pressure half-time Pt½), or the time in milliseconds at which the initial instantaneous pressure gradient declines to one half of its maximum value. The mathematical calculation of Pt½ is depicted in Figures 12.25 and 12.28. Empirically, Pt½ is related to the mitral valve area by the formula: mitral valve area = 220/Pt½. There are several technical factors that should be noted. First, the initial validation was done in a very small number of patients with anatomical or hemodynamic rather than Doppler correlations. Second, the Pt½ calculation represents the “pressure decay” between the left atrium and left ventricle, and will be affected by any factor that changes
either left atrial driving pressure or left ventricular compliance and pressure. Situations in which the latter can be altered include left ventricular hypertrophy or concurrent aortic insufficiency, in which there is competitive filling of the left ventricle. In many instances, the mitral stenosis signal does not have a uniform slope but may have an early rapid decay followed by a more gradual decay, giving a “ski slope” appearance. In this instance, caution is advised, but the more accurate reflector of area will be derived from the flatter portion of the spectral envelope. In general, the derived anatomic area from the pressure half-time calculation is often less valuable for patient management than determination of pressure gradients and anatomically measured valve areas.


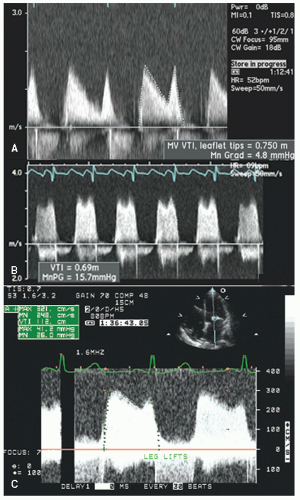
FIGURE 12.26. Transmitral Doppler tracings recorded in patients with varying degrees of mitral stenosis. A: Recorded in a patient with mild mitral stenosis. Note the relatively brisk pressure gradient decay and a mean gradient of 4.8 mm Hg. B: Recorded in a patient with more severe mitral stenosis and a mean gradient of 15.7 mm Hg. C: Recorded in a patient with severe mitral stenosis and a mean pressure gradient of 26 mm Hg after leg lifts. Also note the flat slope of pressure decay in this instance.

Although the mean pressure gradient is directly related to the average area of the restrictive orifice and cardiac output, the peak instantaneous early pressure gradient between the left atrium and left ventricle is also related to the early transmitral flow volume. Early flow volume is dependent on cardiac output and also affected by high early left atrial volumes, as may be seen with mitral regurgitation or high-output states. In the presence of mitral regurgitation or high cardiac output, there is a disproportionate increase in the early transvalvular velocity and gradient compared with the mean mitral valve gradient
(Fig. 12.29). On occasion, this exaggerated early pressure gradient, compared with the mean pressure gradient, can be a clue to the presence of concurrent mitral regurgitation in situations in which the mitral regurgitation may not be directly visualized. This observation may be of particular value in patients with highly eccentric regurgitation jets or paravalvular regurgitation in a mitral prosthesis.


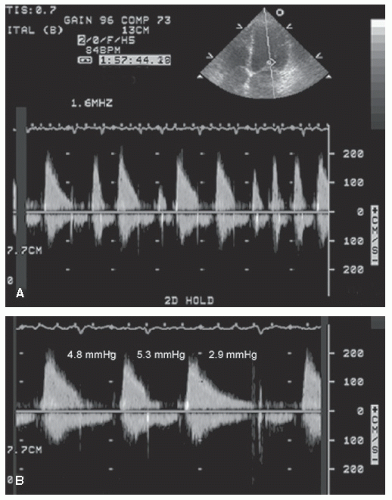
FIGURE 12.27. Transmitral continuous wave Doppler image recorded in a patient with mitral stenosis in atrial fibrillation with an irregular ventricular response. A: Note the marked variation in diastolic filling time and the obvious variation in the spectral profile. B: Recorded in the same patient, revealing three different diastolic filling profiles. Note the marked variation in the mean pressure gradient, dependent on diastolic filling time. MVA, mitral valve area.


FIGURE 12.28. Transmitral spectral Doppler image recorded in patients with mitral stenosis. Images recorded in a patient with relatively mild stenosis (A) and in a patient with more severe mitral stenosis (B). In each example, the pressure half-time has been used to calculate the mitral valve area, which is as noted on the figure. At the top, note the relatively steep decay of the pressure curve compared with the relatively flat pressure decay at the bottom.


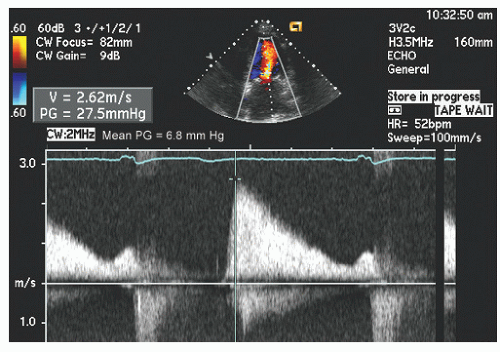
FIGURE 12.29. Transmitral Doppler image recorded in a patient with concurrent mitral stenosis and mitral regurgitation. Note the high peak early gradient (27.5 mm Hg) but the rapid decay and a negligible pressure gradient at end-diastole. Compare the peak early gradient of 27.5 mm Hg with the mean gradient of only 6.8 mm Hg. This discrepancy between peak and mean pressure gradient is often seen in patients with concurrent mitral regurgitation.


Exercise Gradients

By remeasuring the transmitral gradient with exercise, valuable information can be obtained regarding the physiologic impact of mitral stenosis. When high transmitral gradients are measured at rest, clinical dilemmas regarding the clinical relevance of mitral stenosis are uncommon. Occasional patients are encountered in whom there is a moderate resting gradient of 6 to 8 mm Hg but who have substantial clinical impairment. Limited exercise such as 30 to 60 seconds of leg lifts frequently increases the heart rate and, in a supine position, allows registration of transmitral gradients that can then be compared with values obtained at rest. Figure 12.30 is an example in which transmitral gradients were recorded at rest and again after 30 seconds of leg lifts. The gradient measured at rest is unimpressive but increased dramatically with limited exercise. Keeping in mind the physiologic principals and relationship between this transvalvular gradient and pulmonary capillary pressures, one can then surmise valuable information regarding the physiologic abnormalities present in these patients after limited exercise and establish a link between the mitral valve disease and symptoms. Finally, Doppler of the tricuspid regurgitation jet can be used to assess for exercise-induced pulmonary hypertension.


Secondary Features of Mitral Stenosis

Chronic mitral stenosis results in several common and easily recognized secondary features, the overwhelming majority of which are related to increased left atrial pressure. Chronic elevation in left atrial pressure results in left atrial dilation and eventual fibrosis of the atrial myocardium, which, in time, results in decreased atrial contraction and serves as a substrate for the development of atrial fibrillation. Dilation of the left atrium occurs both in the atrial body and in the left atrial appendage. The combination of atrial and atrial appendage dilation with decreasing mechanical function results in stasis of blood with an enhanced propensity to thrombus formation, most commonly in the left atrial appendage. The tendency to develop stasis and clot is markedly increased in the presence of atrial fibrillation. Using either high-resolution transthoracic imaging or more often transesophageal imaging, it is not uncommon to see varying degrees of stasis of the blood in the atrium of patients with mitral stenosis. This typically appears as a swirling mass of echoes in the body of the left atrium, referred to as spontaneous echo contrast, and is often maximal in the left atrial appendage. Figures 12.31, 12.32, 12.33, 12.34 and 12.35 were
recorded in patients with rheumatic mitral stenosis and varying degrees of spontaneous echo contrast and thrombus formation within the left atrium and left atrial appendage. Current opinion suggests that dense spontaneous echo contrast and stasis of blood are precursors to thrombus formation and are markers of a patient with increased thromboembolic risk, especially if seen in the presence of atrial fibrillation. Using pulsed Doppler, it is common to see reduced atrial appendage velocities in this setting (Fig. 12.36).

Only gold members can continue reading. Log In or Register to continue

Stay updated, free articles. Join our Telegram channel

Jun 22, 2016 | Posted by in CARDIOLOGY | Comments Off on Mitral Valve Disease

Full access? Get Clinical Tree

Get Clinical Tree app for offline access