Diastolic dysfunction as a cause of left heart failure and as a powerful predictor of cardiovascular events is now well established. Diastolic dysfunction is present in over 25% of adults over 40 years of age and is the primary cause of approximately 50% of heart failure cases. The potential of using Doppler techniques as a means of studying diastolic function has been recognized for over 25 years and has contributed significantly to our understanding of this condition. Among patients with symptoms, Doppler, combined with two-dimensional echocardiography, is the best method to ascertain whether or not diastolic dysfunction is present and a likely cause of those symptoms. This provides a comprehensive, noninvasive approach to evaluate diastolic dysfunction and to assess its severity and hemodynamic consequences. As such, an assessment of diastolic function should be a part of every comprehensive adult echocardiographic examination.
Normal Diastolic Function
Systole and diastole are intrinsically linked as the left ventricle alternately serves as pump and reservoir. For this reason, it is not appropriate to think of systole and diastole as separate and independent.
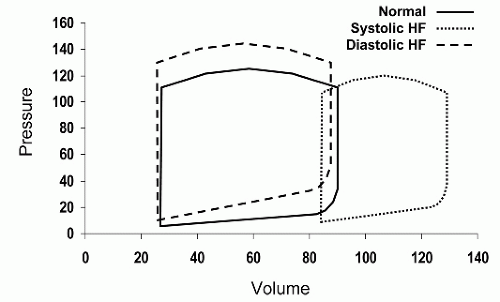
Figure 7.1 illustrates some of the differences between systolic and diastolic heart failure using pressure-volume loops. Although isolated systolic or diastolic dysfunction can occur, in most patients, elements of both contribute to the overall clinical status and symptom complex. Furthermore, the main causes of diastolic dysfunction are the same conditions that result in systolic dysfunction. Hypertension, coronary disease, and valvular heart disease are common causes of both conditions. In an individual patient with one or more of these diseases, detectable abnormalities of both systole and diastole frequently coexist although manifestations of one of the other may predominate.
It is also important to recognize the contribution of both upstream and downstream factors, relative to the left ventricle, as contributors to diastolic function. Upstream, left atrial function has an important effect on left ventricular filling. Since the left atrium acts as both conduit and pump, its ability to transfer blood to the ventricle essentially defines left ventricular filling. This explains why left atrial volume is now established as a useful indicator of the presence, chronicity, and severity of left ventricular diastolic dysfunction. Downstream, effective arterial elastance is related to both systolic and diastolic function of the left ventricle. Although afterload is more directly related to systolic function, it should be recognized that chronic elevation in arterial pressure will also affect left ventricular relaxation and chamber compliance.
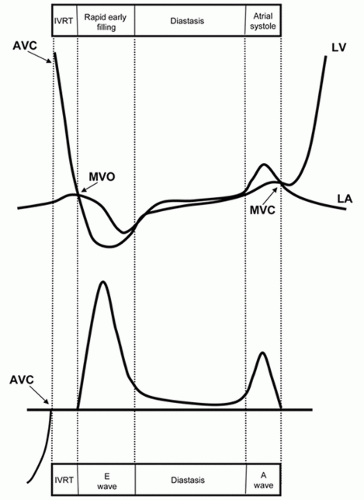
Left ventricular diastole begins when the aortic valve closes and includes isovolumic relaxation, rapid early ventricular filling, diastasis, and left atrial contraction (see
Fig. 7.2). The
initial phase, prior to mitral valve opening, involves the rapid, energy-dependent relaxation of the left ventricular myocardium to its resting unstressed length. This process is associated with a brisk decline in left ventricular pressure. Once ventricular pressure falls below left atrial pressure (which is rising), the mitral valve opens. The interval between aortic valve closure and mitral opening is referred to as isovolumic relaxation. The next step involves filling the left ventricle as rapidly as possible without resulting in a significant increase in pressure. After the mitral valve opens, ventricular pressure continues to fall, creating a pressure gradient between the left atrium and the left ventricle and blood is literally pulled through the mitral valve (
Fig. 7.3). As the left ventricle begins to fill, the pressure within the chamber rises and the rate of inflow slows. Continued filling in middiastole occurs only if left ventricular compliance is sufficiently low, or if left atrial pressure is sufficiently high, to allow the forward flow of blood. The final phase of left ventricular filling results from atrial contraction and ends with mitral valve closure. If diastolic pressure rises too quickly, left ventricular filling will be reduced and prematurely terminated. If a compensatory increase in left atrial pressure is required to maintain left ventricular filling, pulmonary venous pressure will rise as a result, leading to symptoms.
Conceptually, it is helpful to regard diastolic filling as a process of transporting blood through the mitral valve from one reservoir (the left atrium) to another (the left ventricle). This process depends on creating and maintaining a pressure gradient between the two chambers, the magnitude of which determines the rate of flow. Blood can be either pulled through the mitral valve, by rapidly lowering left ventricular pressure below left atrial pressure (suction), or pushed through the valve by raising atrial pressure above ventricular pressure. Both occur in the normal heart. In early diastole, flow is initiated by the rapidly relaxing left ventricle resulting in a suction of blood from the left atrium, through the mitral valve. In late diastole, the continued forward flow of blood is accomplished by a pushing mechanism, the result of atrial contraction. The concept of pulling versus pushing blood through the mitral valve is fundamental to understanding some of the pathophysiologic principles of diastolic function, which are discussed below.
Stages of Diastolic Dysfunction
It is helpful to consider diastolic dysfunction as a continuum of disease that progresses from mild to more advanced stages, eventually becoming severe and irreversible. These stages, along with the pathophysiologic changes that characterize each, are summarized in
Table 7.1. Although such a “natural history” is helpful to our understanding of the pathophysiology, it is a generalization. Not all patients progress linearly along the pathway and reversal of the path is possible. For example, preload reduction or treatment of hypertension can improve diastolic function, shifting the patient from a more advanced to a less advanced stage. In addition, changes in systolic function will also affect diastole. Conceptually, it is useful to define several stages of abnormal diastolic function. Although they are described below as distinct and separate, in reality they represent a continuum. In an individual patient, therefore, it is sometimes difficult to precisely assign a label, as he or she transitions from one stage to the next.
Normal Diastolic Function
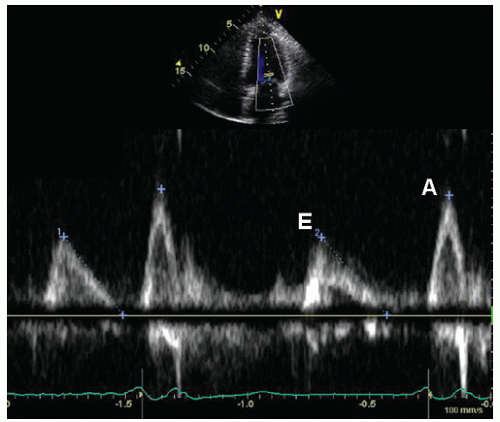
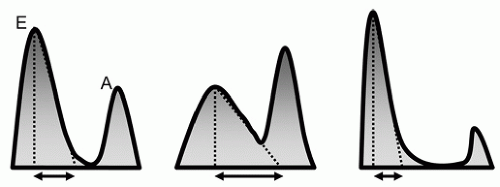
Diastolic function changes with age, so the Doppler criteria used to define normal and abnormal function must account for this factor. Regardless of age, however, normal diastolic function can be characterized as the complete and efficient filling of the left ventricle at physiologic pressures. This implies that an abnormally high left atrial pressure is not required and that the left ventricle can fill completely without an associated abnormal increase in pressure during filling. Following isovolumic relaxation, the mitral valve opens and most filling occurs in the first third of diastole, the result of elastic recoil and active relaxation of the chamber. This phase is referred to as the E wave (
Fig. 7.4A). This rapid early filling is associated with a similar brisk motion of the mitral annulus as the chamber expands to accommodate the inflow of blood. This process can be recorded and quantified using tissue Doppler as the e′ (
Fig. 7.4B). Little filling occurs in middiastole, the diastasis, the duration of which is heart rate dependent; that is, it shortens or disappears with increasing heart rate. This is followed by atrial systole (the A wave), which contributes a relatively small amount of additional
filling. As such, the A-wave peak velocity and area under the curve (time velocity interval) are less than the E wave. As blood enters the ventricle through the mitral valve, it propagates rapidly toward the apex, a parameter that is evaluated using color Doppler M-mode, and termed the propagation velocity or
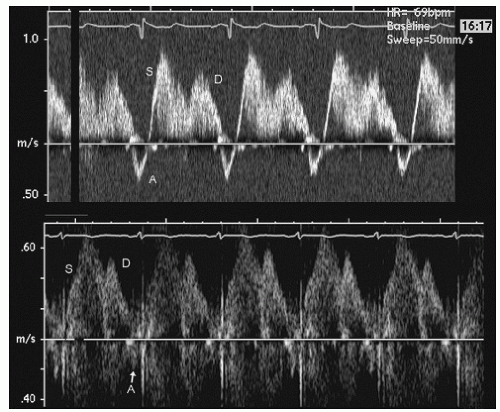
Vp. Coincident with left ventricular filling, left atrial filling occurs via the pulmonary veins. Normal pulmonary venous flow consists of a systolic and diastolic component followed by a brief reversal of flow during atrial systole (
Fig. 7.5). Finally, normal diastolic function is associated with a normal left atrial volume.
Impaired Relaxation, Grade I
For most patients who have diastolic dysfunction, the initial or earliest abnormality is termed
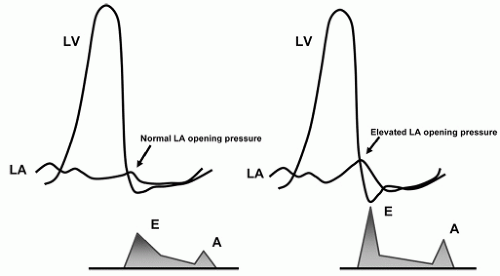
impaired relaxation. This results from the loss of elastic recoil of the left ventricle in early diastole leading to a reduction in the force by which blood is sucked through the mitral valve. Hemodynamically, this leads to a delay or prolongation of the left ventricular pressure curve during isovolumic relaxation. This prolongation, in turn, causes a delay in mitral valve opening and a prolongation of the isovolumic relaxation time (IVRT). With the decrease in suction during early diastole, the left atrial to left ventricular (LA-LV) pressure gradient at the time of mitral valve opening is also decreased (
Fig. 7.6). The rate of deceleration of early mitral inflow diminishes (i.e., deceleration time is prolonged, unless left ventricular stiffness is significantly increased) and the slope of the early diastolic flow propagation profile is also reduced. Antegrade flow across the mitral valve continues through middiastole. In contrast, mitral flow velocity during atrial systole is increased. This occurs through a combination of increased atrial preload and a more forceful atrial contraction, a compensatory mechanism. The auscultatory equivalent of this is the S4 gallop. At this early
stage, pulmonary venous flow and the E/e′ ratio usually are normal, consistent with normal filling pressures at rest.
Pseudonormalization, Grade II
With further deterioration of diastolic function, a decrease in chamber compliance (increased stiffness) adds to the continued delay in relaxation. Transmitral flow is increasingly dependent on maintaining a high left atrial pressure rather than active relaxation (i.e., pushing as opposed to pulling blood into the left ventricle). This results in an increase in mean left atrial pressure which has two subsequent effects. First, it contributes to a shortening of IVRT. The reasons for this are illustrated graphically in
Figure 7.7. Second, in contrast to impaired relaxation, the early mitral inflow velocity is restored back to the normal range. This increase is because the high left atrial pressure results in a larger LA-LV pressure gradient at the time of mitral valve opening. In most patients, left atrial contractility is maintained. As a result of these factors, the mitral inflow pattern appears similar to the normal state (
Fig. 7.8). Thus, this phase is often referred to
pseudonormalization. Pulmonary venous flow will usually show diastolic predominance. A very small systolic wave (less than 50% of the diastolic wave) suggests elevated filling pressures. The important concept here is that the mitral inflow velocity pattern resembles the normal state due to the combined effects of high filling pressure and impaired relaxation.
Restrictive Filling (Reversible), Grade III
With further deterioration in diastolic function, left ventricular chamber compliance becomes increasingly abnormal. To maintain forward flow, left atrial filling pressure must continue to increase. This results in a further shortening of the IVRT and a marked increase in the early diastolic mitral inflow velocity (
Fig. 7.9). Although the early mitral inflow velocity is very high, the rate of deceleration of flow is marked, the result of a noncompliant left ventricular chamber leading to a rapid equilibration of the LA-LV pressure gradient early in diastole. This pressure equilibration prevents the continuation of flow during middiastole. Filling velocity during atrial contraction is also reduced through a combination of elevated left ventricular pressure and failing left atrial contractility. Pulmonary venous flow during systole is greatly reduced relative to diastolic flow and there is usually prominent flow reversal during atrial systole. The retrograde pulmonary venous A-wave duration (Ar) is typically longer than the mitral A-wave duration (Ar – A > 30 ms), indicating high filling pressures. This phase of diastolic dysfunction is called
restrictive filling or
restrictive physiology. In some patients, this stage may be reversible. That is, with diuresis (or other forms of preload reduction), the restrictive filling pattern may revert one of the earlier stages of diastolic dysfunction, usually resembling pseudonormalization. This occurs because of an intervention that lowers left atrial pressure and reduces the LA-LV pressure gradient.
Restrictive Filling (Irreversible), Grade IV
In later stages of the restrictive filling stage, the pattern may become irreversible. In such cases, preload manipulation no longer leads to an improvement in the filling pattern or the clinical status. This late stage of irreversible restrictive physiology is often associated with a marked intolerance to volume manipulation. These patients often survive within a very narrow range of volume tolerance. In such patients, maintaining the precarious balance between volume overload and hypoperfusion can be very difficult.
Echo-Doppler Parameters of Diastolic Function
The progressive stages of diastolic dysfunction can be characterized using various Doppler parameters which are summarized in
Table 7.2. Note that each parameter reflects a specific component of diastolic function, but that no marker, by itself, completely captures all the information necessary to characterize an individual patient.
Isovolumic Relaxation Time
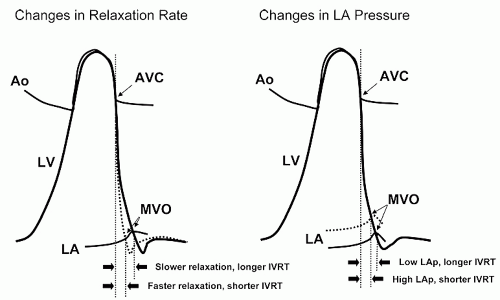
IVRT measurement provides insight into the rate of early diastolic left ventricular relaxation. When relaxation is prolonged, mitral valve opening is delayed and IVRT is increased. Conversely, when left atrial pressure is elevated, mitral valve opening will occur earlier and IVRT will be shortened. These concepts are illustrated in
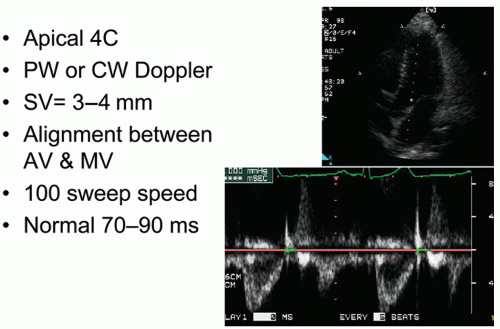
Figure 7.10. Isovolumic relaxation time does not directly measure the rate of relaxation but rather the duration of relaxation prior to mitral valve opening. It is derived using pulsed Doppler from a modified apical four-chamber view. The goal is to adjust the image to allow simultaneous visualization of left ventricular inflow and outflow. Once this view is obtained, the Doppler sample volume is placed midway between the inflow and outflow areas so that mitral and aortic flows are
captured simultaneously (
Fig. 7.11). The sample volume size can be adjusted to permit optimal recording, and generally a relatively large sample volume is best. Isovolumic relaxation time is most easily obtained by measuring the time from middle of the aortic closure click to the onset of the E wave of mitral flow. Gain and wall filters should be adjusted to allow precise definition of aortic closure and mitral opening. Generally, a fast sweep speed is used and measurements are performed at end-expiration. At least three measurements of IVRT should be obtained and averaged.
Isovolumic relaxation time is an indicator of the rate of myocardial relaxation. A major limitation is the fact that multiple factors influence the duration of the IVRT. For example, impaired relaxation lengthens IVRT while increases in left atrial pressure shorten IVRT. Furthermore, IVRT increases with age and is sensitive to changes in both heart rate and systolic function. All of these factors contribute to the nonspecificity of IVRT, which should never be used in isolation as a predictor of diastolic function.
Mitral Inflow
An accurate recording of mitral inflow velocity is the single most important parameter for the assessment of diastolic function. The use of mitral inflow Doppler recordings to assess diastolic function is based on the premise that the velocity curve throughout the cardiac cycle reflects the instantaneous pressure gradient between the left atrium and ventricle (see
Figs. 7.2 and
7.3). The greater the pressure difference, the higher the velocity at that point in time. If no gradient exists, then flow will cease. Thus, mitral inflow provides unique insight into left ventricular filling throughout the entire period of diastole.
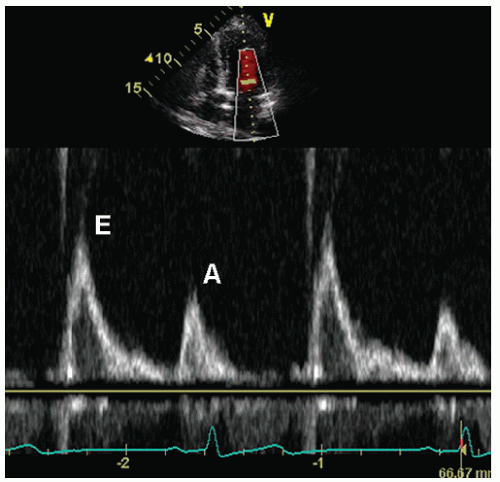
Mitral inflow is recorded from the apical four-chamber view. Once the view is properly aligned, the sample volume is positioned at the tips of the mitral leaflets. Sample volume size should be small, about 2 mm. Care should be taken to avoid placing the sample volume too close to the mitral annulus which will result in lower velocities and an inaccurate E/A ratio. By moving the sample volume up and down relative to the mitral tips, the true peak velocity in early and late diastole can be recorded with confidence (
Fig. 7.12). In addition, continuous wave Doppler can also be performed to confirm that maximal velocities are in fact recorded. Spectral gain and wall filter settings should be adjusted to ensure that a clean envelope is
recorded and to facilitate the accurate timing of the beginning and end of mitral inflow. The Doppler recording should be performed at both a slow and a fast sweep speed. The slow speed is useful for evaluation of respiratory variation, whereas the fast speed is used to obtain measurements. These measurements should be recorded at end-expiration and multiple beats should be averaged.
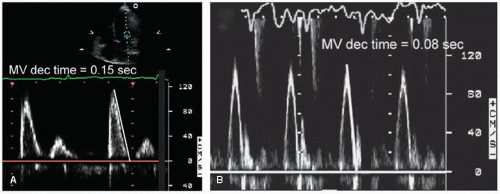
Once the Doppler recording is optimized, a variety of measurements should be obtained. The primary measurements include the peak early filling velocity (E wave), peak filling velocity during atrial systole (A wave), the E/A ratio, and the deceleration time of the early filling velocity (
Fig. 7.13). Deceleration time is defined as the time interval from early peak inflow velocity (the E wave) to the cessation of the rapid early filling phase (
Fig. 7.14). It is inversely proportional to chamber stiffness and is obtained by tracing the deceleration curve from the maximal E-wave velocity to the baseline which represents the time of pressure equalization between the two chambers (when inflow ends and velocity is zero). In many patients, the deceleration limb of the E wave does not reach the zero line. In these cases, the line should be extrapolated to the baseline in order to define the deceleration time (
Fig. 7.15). Factors that affect the mitral inflow pattern include sinus tachycardia and first-degree atrioventricular (AV) block, which tend to fuse the E and A waves, atrial fibrillation, which eliminates the A wave, and mitral valve disease, which independently alters the velocity pattern.
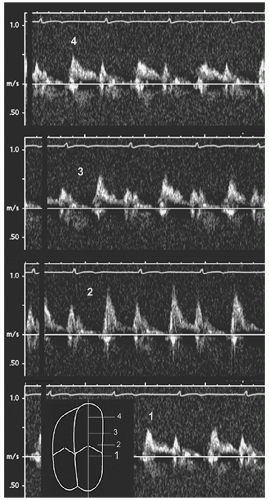
Color M-mode Flow Propagation Velocity (Vp)
When the mitral valve opens, flow accelerates from the valve orifice toward the apex of the left ventricle. Propagation velocity (
Vp) throughout diastole can be measured with color Doppler M-mode. Although a variety of parameters can be obtained, by convention, the slope of the early diastolic valve-to-apex contour is used most often. From the four-chamber view, the M-mode cursor is placed in the center of the column of mitral inflow, as parallel as possible to flow direction (
Fig. 7.16). Temporally, this is performed in early diastole, coincident with the E wave. By shifting the color baseline to a low Nyquist limit, an aliasing border (blue to red, representing the first aliasing velocity) near the center of the column is obtained. Although this border is not truly linear, a tangent is drawn from the mitral valve to a point 4 cm distal, representing the early diastolic flow propagation velocity.
The slope of this line corresponds to the velocity gradient from left ventricular base to apex. The primary determinant is the rate of myocardial relaxation or elastic recoil of the chamber in early diastole. Thus, impaired relaxation will slow the propagation of blood and thereby reduce the slope of the line. However, several other factors affect this simple measurement. These include ventricular geometry, chamber volume, regional dyssynchrony, systolic function, and the complexity of flow vortex patterns once blood enters the chamber. It is recommended that propagation velocity should never be used in isolation and
should only be assessed in the setting of a dilated left ventricle with reduced systolic function.
Tissue Doppler Mitral Annular Velocity
The velocity of the mitral annulus can be recorded throughout the cardiac cycle using the tissue Doppler method (
Fig. 7.17). From the four-chamber view, the sample volume is positioned on the annulus, near the insertion site of the mitral valve. Both the septal (medial) and lateral sites should be recorded. Because of the high amplitude of the signal, spectral gain should be lowered to ensure a crisp, reproducible tracing. Because of the low velocity, the velocity scale should also be adjusted to maximize the size of the curve, thereby permitting accurate determination of velocity throughout the cardiac cycle. The sweep speed should be high, between 50 and 100 cm/sec. Measurement of three or more consecutive cycles should be obtained at end-expiration. Using this approach, accurate, reproducible recordings are possible in the majority of patients.


 Get Clinical Tree app for offline access
