Thoracic Aorta
Daniel Nóbrega Costa
Geoffrey D. Rubin
Neil M. Rofsky
Richard L. Hallett
Spectrum and Prevalence of Diseases
Thoracic aortic diseases are often life-threatening conditions that require immediate diagnosis and treatment. Despite continuous progress in identification of clinical risk factors, prevention, and early diagnosis of these conditions, they remain major causes of morbidity and mortality throughout the world (1,2,3). These include aneurysms, acute aortic syndromes (which comprise aortic dissection, intramural hematoma [IMH], and penetrating ulcer), occlusive diseases, vasculitides, trauma, and congenital abnormalities.
Global View of Unique Aspects and Considerations of Imaging
Although assessment of the aorta has traditionally relied on conventional angiography, the cross-sectional information available with computed tomography (CT) and magnetic resonance (MR) extends its diagnostic possibilities and has been shown to provide benefits beyond angiography (4,5,6,7,8,9,10,11). Isotropic acquisitions in multidetector computed tomography (MDCT), as well as volumetric and multiplanar capabilities of magnetic resonance imaging (MRI), have overcome the challenging issue of vessel tortuosity, enable a truly transverse aortic plane (useful especially in aneurysms and dissections), facilitate understanding of the relation between the aorta and its branches, and provide supplementary assessment of intramural and perivascular abnormalities.
CT scanning provides a rapid assessment in emergent conditions and has been an important tool for evaluating patients presenting with chest pain. Transesophageal echocardiography (TEE), while readily available in many centers, is less commonly applied, as it is invasive and more operator- dependent than CT or MR. MR as an emergent tool is less attractive due to concerns of compatibility with the MR
environment; however, recent technologic developments have allowed fast acquisition of high-quality data sets and the potential to view them in MPR and real-time fashion.
environment; however, recent technologic developments have allowed fast acquisition of high-quality data sets and the potential to view them in MPR and real-time fashion.
Advantages of CT and MR
Despite the fact that transverse images are adequate for diagnosis in most cases, volume-rendered three-dimensional (3D) and multiplanar reformatted images can provide more information about the nature of the disease and better communication with clinicians (12,13).
Evaluation of the aortic wall is a critical part of the vascular assessment and is best appreciated with cross-sectional imaging (14,15,16,17,18). The same holds true to the evaluation of aortic wall distensibility and quantitative flow measurements that are achievable by using MRI (14,19,20,21).
Important additional information unique to CT imaging includes the detection of bony and other nonvascular abnormalities associated to trauma. MRI, on the other hand, provides assessment of flow dynamics in coarctation and real-time analyses of dynamic processes that can be used to extract functional data (e.g., intimal flap, aortic valve flow, and wall stress).
Imaging Strategies
A comprehensive assessment of the aorta requires that one examine its course, caliber, and contour along with visualization of the intraluminal and intramural details. The first step in performing CT and MR angiography is to define the imaging volume of interest, which depends on the anatomic territory to be studied and the clinical questions to be answered (22).
Computed Tomography
Although the thoracic aorta is the largest artery in the body, assuming that simple thick-section acquisition and borderline luminal enhancement will suffice for obtaining diagnostic studies would be a critical error. The diseases of the thoracic aorta and its branches necessitate high-resolution volumetric examinations that allow clear delineation of both the lumen as well as the wall of the vessel and offer the possibility in specific circumstances to compensate for pulsatile motion.
Computed Tomography Acquisition
Virtually all thoracic aortic examinations are performed with the patient lying in a supine position and centered so that the isocenter of the gantry corresponds to the center of the mediastinum. The patient’s arm should be placed above his or her head, but care should be taken to avoid extreme shoulder abduction, which can pinch the subclavian vein and hinder delivery of contrast medium. Exceptions to this positioning protocol include imaging of the thoracic aorta in association with an upper extremity in the setting of suspected cardiac source for upper extremity thromboembolism, in which case the symptomatic arm is abducted but the arm to be injected is held at the patient’s side. Another exception is when the primary focus of the examination are the carotid and intracranial arteries and only the upper portions of the thoracic aorta are to be imaged. In these circumstances, it may be desirable to image the patient with both arms at his or her sides.
A scout view is always obtained first and is sufficient for defining the scan range for thoracic aortic computed tomographic angiography (CTA). The scan range for thoracic CTA should begin in the lower neck to allow imaging of the proximal common carotid and vertebral arteries as well as the subclavian arteries. Inferiorly, the scan should not end above the celiac origin. Establishment of these proximal and distal landmarks is important in accurately locating aortic lesions as well as in detecting coexistent disease in the supra-aortic branches.
Prior to acquiring the CT angiogram, an unenhanced, thin-section (1 to 1.5 mm) acquisition should be performed whenever hemorrhage is suspected, particularly in the setting of an acute aortic syndrome. One notable exception to this acquisition strategy is in the setting of blunt or penetrating trauma, where an unenhanced scan is usually not required. Unenhanced scans are particularly sensitive for detecting intramural and periaortic blood. Another important reason for acquiring a preliminary unenhanced acquisition is when assessing the aorta following stent-graft placement, particularly for treating thoracic aortic aneurysms. Because calcifications within the aortic wall or within thrombus lining the aortic wall can mimic the appearance of small endoleaks, an unenhanced scan allows definitive characterization of potentially ambiguous opacities, as their presence on the unenhanced scan is diagnostic of calcification.
While 64-row and greater CT scanners are capable of acquiring images through the thorax with submillimeter section thickness, accurate characterization of aortic diseases rarely necessitates submillimeter section thickness unless a detailed assessment of the coronary arteries is desired simultaneously. As a result, most thoracic aortic CTA can be performed with 1- to 1.5-mm section thickness. Thicker sections are never advised. As with all CTA, overlapping reconstruction is recommended to improve the quality of multiplanar reformation (MPR) and 3D visualization. Section intervals equal to half of the effective section thickness are a good compromise between optimized longitudinal spatial resolution and overall image number. The CT angiogram should be acquired during breath holding whenever possible; however, due to its relatively fixed position within the thorax, high-quality images of the thoracic aorta can be obtained
while the patient is breathing. Quiet ventilation is preferred to hyperventilation.
while the patient is breathing. Quiet ventilation is preferred to hyperventilation.
Pulsatile motion and its effect on ascending aortic visualization, in particular, has been a reality of thoracic aortic CTA since its beginnings. The recognition of typical motion artifacts is critical to an accurate diagnosis of thoracic aortic CTA, lest incorrect diagnoses including aortic dissection are made. If the appearance of the aorta is ambiguous despite consideration of pulsatile artifacts, reconstruction of the helical acquisition by using a half scan interpolation algorithm rather than standard helical interpolation algorithms can substantially diminish the artifact and clarify the presence of motion versus intrinsic disease (Fig. 17-1).
With the introduction of 16-row MDCT, it is now practical to routinely image the thoracic aorta by using electrocardiogram (ECG)-gating. Because patients are often critically ill and because myocardial and cardiac valve function are frequently valuable adjunctive data to thoracic aortic imaging, retrospective gating of the thoracic aorta is preferred to prospective gating; however, a formal comparison of prospectively gated thoracic aortic CT angiograms relative to retrospectively gated acquisitions has not been performed to date. Because of the substantially greater radiation exposure associated with a retrospectively gated CTA even when implementing tube current modulation, a gated acquisition is not advised for all thoracic aortic CTA.
At Stanford University, we gate all CT angiograms where there is suspected or known ascending aortic pathology or any presentation of an acute aortic syndrome. We have found gated acquisitions to be critical in completely characterizing ascending aortic dissection and demonstrating the relationship of intimal flaps to the structures of the aortic root, assessing the aortic valve, and assessing for intracoronary extension of aortic dissection. Gated acquisitions are also very valuable postoperatively, when subtle dehiscence of graft anastomoses near the aortic root can be blurred due to motion artifacts. Gated acquisitions are also helpful in pinpointing the specific location of anastomotic dehiscence even in the setting of broad-based pseudoaneurysms that on static images do not allow clear delineation of the point of communication between the lumen and the pseudoaneurysm. In unusual circumstances, cardiac gating, by eliminating motion-related artifacts, may unmask lesions otherwise hidden within the motion-related artifacts (Figs. 17-2 and 17-3).
At Stanford University, we gate all CT angiograms where there is suspected or known ascending aortic pathology or any presentation of an acute aortic syndrome. We have found gated acquisitions to be critical in completely characterizing ascending aortic dissection and demonstrating the relationship of intimal flaps to the structures of the aortic root, assessing the aortic valve, and assessing for intracoronary extension of aortic dissection. Gated acquisitions are also very valuable postoperatively, when subtle dehiscence of graft anastomoses near the aortic root can be blurred due to motion artifacts. Gated acquisitions are also helpful in pinpointing the specific location of anastomotic dehiscence even in the setting of broad-based pseudoaneurysms that on static images do not allow clear delineation of the point of communication between the lumen and the pseudoaneurysm. In unusual circumstances, cardiac gating, by eliminating motion-related artifacts, may unmask lesions otherwise hidden within the motion-related artifacts (Figs. 17-2 and 17-3).
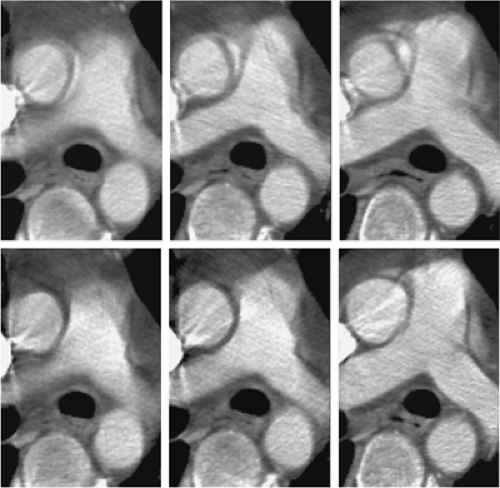 Figure 17-1 Contiguous transverse MDCT sections obtained through the ascending aorta in a patient who had been run over by a tractor. Acquisition parameters are 4 ÷ 3.75 mm, pitch 1.5, table speed of 22.5 mm per rotation, and 0.8 seconds per rotation. Top Row: An apparent linear filling defect is present within the ascending aorta on all three sections. This filling defect persisted even with the reconstruction of overlapping sections (not shown). Bottom Row: Identical image locations from the same CT acquisition reconstructed with a half scan or segmented reconstruction algorithm. The segmented reconstruction requires approximately 220 degrees of data, resulting in an effective temporal resolution of 0.5 seconds. By reconstructing the sections using this algorithm, the apparent linear filling defects are revealed to be motion-related artifacts, and thus there is no suspicion for ascending aortic injury. (Reprinted with permission from Rubin GD. CT angiography of the thoracic aorta. Semin Roentgenol. 2003;38:115–134.) |
When assessing the thoracic aorta both for aneurysms and acute aortic syndromes, imaging of the abdominal aorta and iliac
arteries is highly advisable. In the setting of thoracic aortic aneurysms, there is a high prevalence of coexistent abdominal aortic aneurysm, and in the setting of acute aortic syndromes, aortic dissection—particularly type B—can extend into the abdominal aorta and iliac arteries where malperfusion of abdominal and pelvic viscera and the lower extremities can be a critical cause of morbidity and must be considered in treatment planning. Moreover, because an important treatment option is endoluminal therapy with stent-graft placement, imaging of the abdominal aorta and iliac arteries provides visualization of the access route for these large thoracic aortic devices. The identification of iliac arterial stenoses and aneurysms within the abdominal aorta and iliac arteries are important to planning the delivery of the endovascular device both from the standpoint of determining the feasibility of device passage and the selection of the side for device insertion.
arteries is highly advisable. In the setting of thoracic aortic aneurysms, there is a high prevalence of coexistent abdominal aortic aneurysm, and in the setting of acute aortic syndromes, aortic dissection—particularly type B—can extend into the abdominal aorta and iliac arteries where malperfusion of abdominal and pelvic viscera and the lower extremities can be a critical cause of morbidity and must be considered in treatment planning. Moreover, because an important treatment option is endoluminal therapy with stent-graft placement, imaging of the abdominal aorta and iliac arteries provides visualization of the access route for these large thoracic aortic devices. The identification of iliac arterial stenoses and aneurysms within the abdominal aorta and iliac arteries are important to planning the delivery of the endovascular device both from the standpoint of determining the feasibility of device passage and the selection of the side for device insertion.
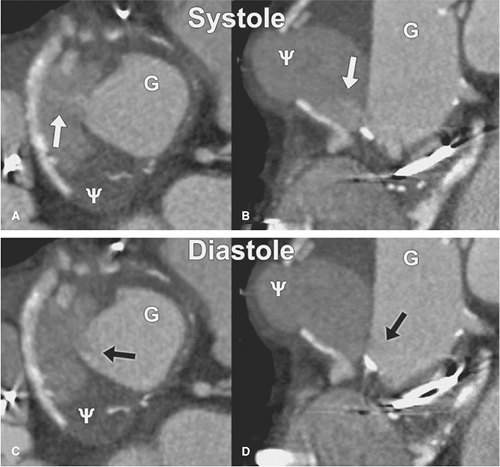 Figure 17-2 Cardiac-gated CTA acquired 6 days following aortic root aneurysm repair with an interposition graft above a preexisting St. Jude aortic valve prosthesis. The left and right coronary arteries were transplanted onto the graft. Transverse and coronal sections at the proximal graft anastomosis were acquired in mid-systole (A and B, respectively) and mid-diastole (C and D, respectively). There is a pseudoaneurysm (ψ) that contains thrombus and an enhancing lumen. The pseudoaneurysm has a broad region of contiguity with the graft (G). The specific point of anastomotic dehiscence is identified by a jet of high concentration contrast entering the pseudoaneurysm in systole (white arrows) and reversal of flow with filling of the graft by less enhanced blood from the pseudoaneurysm in diastole (black arrows). |
 Figure 17-3 Gated CTA of patient with Marfan syndrome and anuloaortic ectasia. Frontal volume rendering with an opacity transfer function that renders the myocardium transparent and the contrast-enhanced arterial blood opaque (A). There is a 6.5-cm ascending aortic aneurysm with effacement of the sinotubular junction and dilation of the aortic root. The narrowest portion of the left ventricular outflow is in the subvalvular region below the annulus (arrow). The anatomy of the root is clearly visualized for surgical planning (B) (white arrow, right coronary artery origin; black arrow, commissure between right and noncoronary cusps; curved arrow, aortic annulus, illustrating that the annulus is not a simple ring but a complex three-crowned “coronet” shape; open arrow, subanular “interleaflet triangle”). Coronal MPR in diastole (C) and systole (D) demonstrate the movement of the aortic valve leaflets and the incomplete coaptation of the leaflets in diastole (arrow) due to the dilated annulus, resulting in aortic insufficiency. Three-centimeter thick-slab volume-rendered images in diastole (E) and systole (F) were created with an opacity transfer function that renders the aortic lumen transparent and allows delineation of the interior of the aortic root and the 3D relationships of the valve leaflets. |
Contrast Medium
When performing thoracic aortic CTA, it is always preferable to inject into the right arm instead of the left arm. This assures that the left brachiocephalic vein is not filled with undiluted, high-attenuation contrast medium. When the left arm is used, a high degree of opacification of the left brachiocephalic vein and associated streak artifacts can obscure the origins of the supra-aortic branches and limit the assessment of occlusive disease and extension of intimal flaps into these branches as well as the possibility for streak artifacts mimicking lesions that are not present. Although a saline flush should always be employed when performing thoracic aortic CTA to clear the inflowing veins of high-attenuation contrast medium, because the CT angiogram is acquired from a cranial to caudal direction, the supra-aortic branches and aortic arch are acquired during the earlier phase of the acquisition prior to the clearing of the veins with the saline flush.
Another important consideration when delivering contrast medium for thoracic aortic CTA concerns the position of a region of interest for automated bolus triggering. Although it is tempting to place a region of interest within the largest vessel cross section (the aortic arch), this strategy has an important pitfall in the setting of aortic dissection and aneurysmal disease of the aortic arch. Because of the frequent coexistence of mural thrombus in the setting of both aortic dissection and arch aneurysm, the positioning of a region of interest on unenhanced views can result in its placement within an area of thrombus. If the images acquired during the course of the bolus monitoring are not carefully examined directly, the scan may not trigger at the appropriate time. A more reliable method for bolus monitoring and automated scan triggering relies on placement of the region of interest within the descending thoracic aorta approximately 2 cm distal to the aortic arch (Fig. 17-4). Because a near-orthogonal cross section of the vessel is acquired at this point, the inclusion of the true vessel lumen in at least a portion of the region of interest is much more likely than in the aortic arch, where the true lumen may pass above or below the plane selected for region-of-interest
placement. Once opacification achieves a threshold above 100 Hounsfield units (HU), the scan is triggered after the table is repositioned to allow initiation of the acquisition in the lower neck.
placement. Once opacification achieves a threshold above 100 Hounsfield units (HU), the scan is triggered after the table is repositioned to allow initiation of the acquisition in the lower neck.
 Figure 17-4 Transverse MDCT sections from a patient with an 11-cm ascending aortic aneurysm (A) and a 16-cm ascending aortic aneurysm (B). In both cases, the superior vena cava has been compressed into a slitlike configuration with contrast reaching the heart via the hemiazygous vein. Case (A) was acquired after bolus monitoring and scan triggering in the descending thoracic aorta. Case (B) was performed with an empiric 20-second delay. The capacious aneurysm and obstructed inflow combine to hinder aortic opacification. Bolus monitoring should be employed always to assure adequate contrast enhancement. ([A] Reprinted with permission from Rubin GD. CT angiography of the thoracic aorta. Semin Roentgenol. 2003;38:115–134.) |
Postprocessing
Because the bony thorax completely surrounds the thoracic aorta, it is not possible to visualize the thoracic aorta with 3D rendering methods without some form of segmentation. However, region-of-interest editing and more recently automated chest wall removal tools can be used to facilitate thoracic aortic visualization. The limitation of these tools is that they may remove portions of the supra-aortic branches and internal mammary arteries. Perhaps the most expedient means for volume rendering the thoracic aorta is the use of a 2- to 5-cm thick slab. By dynamically translating and rotating the slab, all branches can be visualized and the visualization is not subjected to the idiosyncrasies of automated algorithms. It is also an easy means to eliminate the overlying pulmonary vessels, which automated chest wall removal tools may not remove effectively.
Because of the complex spatial relationships of the thoracic aorta and the overall thickness of the vessel, maximum intensity projections (MIPs) are rarely valuable and volume rendering is preferred. MPRs, particularly curved planar reformation (CPR), can be very useful for assessing the thoracic aorta and its branches, especially in the setting of multiple lumina or mural hematoma in the acute aortic syndromes.
Magnetic Resonance
Nuances of Acquisition Strategies
A comprehensive assessment of the aorta with MR requires that one assesses accurately the course, caliber, and contour of the aorta and visualizes the intraluminal and intramural details. Since ECG-triggering is commonly utilized in many approaches, a brief digression to address lead placement will be pursued.
A practical consideration of time constraints, patient compliance, and efficacy mandate the prescription of diagnostic and time-efficient strategies for MR aortography. The combination of dark blood techniques, cine MRI, and 3D gadolinium-enhanced MRA (or some other bright blood strategy) constitutes a comprehensive evaluation of the thoracic aorta that can be performed in a reasonable time frame. In certain circumstances, a subset of these techniques can be applied.
It is useful to divide MR aortic techniques in two broad groups: dark blood and bright blood strategies. Both groups can benefit from synchronizing the acquisition to the cardiac cycle in order to compensate for cardiovascular motion. ECG-triggered sequences are used when quantifying aortic valve insufficiency and stenosis, for a clear and uniform assessment with dark blood sequences, for distinguishing flow from thrombus, and for minimizing pulsation artifacts.
Dark blood strategies consist of cardiac-triggered spin- echo (SE) imaging, cardiac-triggered echo-train imaging, half-Fourier single-shot turbo SE, with or without cardiac- triggering and magnetization prepared gradient echo (GRE) imaging. These techniques provide an excellent depiction of the anatomy and simultaneous evaluation of the lumen, vessel wall, and periaortic structures. With techniques that render the blood pool as low signal, excellent contrast also facilitates visualization of IMH and dissection (Fig. 17-5). This approach has had a long history beginning with nonbreath-hold SE imaging of the chest.
Traditional SE imaging has a demonstrated high accuracy for diagnosis of aortic dissection but offers limited assessment of the branch vessels and entails lengthy acquisition times. Breath-hold imaging is not possible with SE techniques, and therefore, effective resolution is compromised. In SE imaging, ECG-triggering is essential for obtaining images of diagnostic quality. The R-wave is used to trigger the acquisition and thus achieve a uniform synchronization for gathering data with respect to the cardiac cycle.
The weighting of the image is not essential, but trade-offs in the echo time (TE) selection should be highlighted. The selection of shorter TE values provides a greater
number of slices for a given repetition time (TR). The selection of a longer TE allows for more spin dephasing and therefore often yields a better dark blood image. Saturation bands applied above and below the slices can improve the uniformity of the dark blood (23). All SE sequences tend toward a dark blood appearance by virtue of an exit phenomenon. That is, excitation of the slice includes a plug of blood with substantial components exiting the slice prior to the ability to encode it.
number of slices for a given repetition time (TR). The selection of a longer TE allows for more spin dephasing and therefore often yields a better dark blood image. Saturation bands applied above and below the slices can improve the uniformity of the dark blood (23). All SE sequences tend toward a dark blood appearance by virtue of an exit phenomenon. That is, excitation of the slice includes a plug of blood with substantial components exiting the slice prior to the ability to encode it.
 Figure 17-5 Dissection of the ascending, arch, and descending aorta in a 63-year-old patient. On this ECG-triggered SE T1-weighted MR image, the intimal flap is readily identified (arrows). Note the heterogeneous signal secondary to slow flow in the false lumen, making it easy to identify the true lumen (T). |
In cardiac-triggered black blood imaging, an R-wave spike is used to trigger image acquisition at a specific point during the cardiac cycle in order to minimize motion artifacts of the heart and the other mediastinal structures. The early success of ECG-triggered SE sequences for aortography was achieved with dark blood imaging (24,25,26,27,28). In such older versions of black blood imaging, the outflow phenomenon was exploited—excited spins in blood left the slice of interest before it was possible to apply the refocusing pulse, thus leaving a signal void; saturation bands placed above and below the extreme sections were often used to minimize flow-related enhancement (23).
Faster acquisitions are achievable by using echo train imaging techniques, with less sensitivity to cardiac and respiratory motion. During a TR interval, a series of echoes with unique phase-encoding information is acquired, with contrast determined by those echoes featured in the center of the k-space data matrix. With this family of sequences, referred to as fast spin echo (FSE) or turbo spin echo (TSE), one can reduce acquisition times to a breath-hold. For aortic protocols, this is most often employed as an ECG-triggered strategy that benefits from saturation bands.
Inversion pulses can be used to facilitate black blood imaging. Inversion pulses can be applied to echo train SE imaging or to GRE imaging. In each case, the inversion pulse is a preparation pulse that sets up the condition for black blood imaging. For TSE imaging, a double inversion pulse is used. This is really a misnomer, as the pulse sequence is actually an inversion–reversion strategy. A nonselective inversion pulse inverts the magnetization over a broad range of the body. This is followed by a slice-selective reversion that restores the magnetization in the slice only while leaving the magnetization outside the slice inverted. During systole, blood in the imaging slice flows out while blood outside the imaging slice, with inverted magnetization, flows in. This sequence can be properly timed so that data acquisition is initiated as the T1 recovery of blood crosses the null point. Thus, blood will lack the longitudinal magnetization necessary for signal generation. This allows for uniform dark blood. When combined with a half-Fourier reconstruction readout, robust and rapid black blood imaging is obtainable (Fig. 17-6). Alternatively, single-shot without half-Fourier reconstruction can obtain one to two slices per breath hold, which trades off improved resolution for less efficient anatomic coverage per unit of time as compared with the half-Fourier approach.
An inversion pulse preparation can be applied to GRE imaging. This is often known as magnetization preparation GRE and has also been referred to as Turbo FLASH. This rapid acquisition can be a useful strategy when ECG-triggering is not practical and strong T1 contrast is desired (29). Since each slice can be obtained in less than 1 second, ECG-triggering is not a strict constraint.
Bright blood strategies include gadolinium-enhanced angiography, GRE flow-sensitive imaging, steady-state free precession imaging, and phase-contrast MRI.
Gadolinium-enhanced MRA is especially useful for studying the branch vessels of the thoracic aorta, with
improved resolution, signal-to-noise ratio, speed, and overall quality of vascular images. The entire thoracic aorta can be covered in <20 seconds with minimal flow artifacts and with sufficiently thin sections for versatile data displays. These displays include an infinite number of projections and MPR images of the aorta.
improved resolution, signal-to-noise ratio, speed, and overall quality of vascular images. The entire thoracic aorta can be covered in <20 seconds with minimal flow artifacts and with sufficiently thin sections for versatile data displays. These displays include an infinite number of projections and MPR images of the aorta.
 Figure 17-6 Dissection of the ascending aorta in a 67-year-old male. Compare the diagnostic quality of images obtained with turbo SE T1-weighted (A, imaging time: 3 minutes) and dark blood HASTE (B, imaging time: 31-second breath hold) ECG-triggered images, despite the difference in the acquisition times. (HASTE, half-Fourier turbo spin-echo.) |
A sagittal or oblique sagittal acquisition with a large field of view can cover the entire aorta, offering its maximal resolution in a familiar projection. It can be done by using non-breath-hold technique with slower sequences or with a breath-hold technique that exploits the benefits of high-performance gradient systems. Despite the respiratory motion that degrades the quality of images, the non-breath-hold technique provides diagnostic images in almost all cases (30). The breath-hold technique uses a spoiled 3D GRE with very short TRs and TEs to encompass the entire aorta in a single breath-hold, typically within 15 to 25 seconds.
The application of ECG-triggering to ensure diagnostic quality images for GRE strategies requires further discussion (see section below). The effective TR is calculated first based on the R-R interval. Conventional GRE images without the use of saturation bands can be acquired at different phases of the cardiac cycle and displayed in dynamic fashion. Flow is visualized as changes in signal intensity through the cardiac cycle on the cine display, which is useful for demonstrating altered flow at the aortic valve. The TR depends on the heart rate of the patient, the SE is the minimum achievable with flow compensation (in the range of 4 to 10 ms), the flip angle is 30 to 40 degrees, and matrix is typically 128 ÷ 256 (phase ÷ frequency encoding). The data are acquired in peak systole immediately following the R-wave to maximize inflow into the imaging section. The number of heartbeats and breath-hold duration required is determined by the number of phase-encoding steps per section, the number of lines of k-space sampled per R-R interval, and the heart rate of the patient (30).
ECG-Triggering and Gating
The heart contracts in a rhythmic manner, and cardiac contraction motion artifacts may be eliminated by application of an electrocardiographic gate to cardiac image acquisition. In this approach, each phase-encoding step in an acquisition is obtained at the same phase of the cardiac cycle. Then, when the image is processed, it will be coherent and free from cardiac motion–related artifacts. By convention, the R-wave is chosen as the gating signal because it has the greatest amplitude and is therefore more easily identified in the ECG. In addition, because the R-wave immediately precedes ventricular contraction, it represents the end of ventricular diastole and thus the images are obtained when the ventricular chambers are most dilated (31). Certain calculations must be made in order to set up the MR sequence correctly.
It is important to define the terms applied to the use of ECG leads in MRI/MRA: ECG-triggering and ECG-gating. These terms are often used interchangeably. The term ECG-triggering can be used to describe prospective acquisitions during which data accumulation is initiated based on synchronization with the ECG-tracing. This differs from ECG-gating, a term that refers to the continuous acquisition of image data during an independent recording of the ECG. With retrospective gating, the sequence is initiated by using the minimum TR without being synchronized to the ECG. The points in the cardiac cycle at which the data are acquired are monitored and later referenced to the ECG for reconstruction.
Lead placement can be time consuming when trying to achieve a trace that will provide reliable information for triggering the acquisition. However, the time investment is important and can be facilitated by some helpful tips.
The objective is to achieve a tracing in which the R-wave is substantially taller than the T-wave of the tracing. The T-wave elevation that is characteristically seen in the MR environment results from the magnetoelectrodynamic effect that scales with field strength (32). This can lead to data acquisition triggered off the T-wave. Thus, data will not be adequately synchronized to the mechanical-temporal features needed for optimized flow and quantitative evaluations.
Depending on the system, typically three or four electrodes are used. Optimized electrode contact is important. Thorough cleansing of the contact area with alcohol and/or acetone is recommended. Body hair should be removed in the area where the electrode is placed.
Lead placement typically represents a compromise between optimizing signal (wider spacing of the electrodes) and minimizing gradient artifacts (narrower spacing of the electrodes). The latter typically dominates, and therefore it is common to begin the procedure with the leads relatively close together on the anterior chest wall. In cases when a poor tracing dominates, it can be helpful to position the electrodes on the patient’s back.
The recent implementation of vectorcardiography improves the efficiency which adequately identifies the QRS complex correctly (32). This approach examines the 3D orientation of the ECG signal and uses the calculated vector of the QRS complex as a filter mechanism to ignore electrical signals that are of a similar timing in the cardiac cycle or of a similar magnitude but different vector.
When setting up the parameters for imaging, it is important to understand the relationship of heart rate with
the TR. In triggered echoes, the TR is equal to the R-R interval. The R-R interval is calculated by multiplying (1/patient’s heart rate) by 60,000 (msec/minute).
the TR. In triggered echoes, the TR is equal to the R-R interval. The R-R interval is calculated by multiplying (1/patient’s heart rate) by 60,000 (msec/minute).
R-R interval = 60,000/Heart rate (in beats per min [BPM]) (or effective TR)
For example, considering determining the effective TR for a patient with a heart rate of 80 BPM. If the patient’s heart rate is 80 BPM, there are 80 beats occurring for every 60 ÷ 1,000 msec (1 second); stated inversely, during 60,000 msec, there will be 80 heart beats. We wish to solve for msec/beat (each beat yields one R-R interval), and in this example, the R-R interval is 60,000/80 = 750 msec. To obtain images with T2-weighting, longer TR values are needed—usually >2,000 msec at 1.5T. Thus, for T2-weighted images, triggering occurs every two to three R-R intervals.
When triggering, the slices are sampled once during the effective TR in the same way as in conventional imaging. However, multiple slices can be sampled in a given R-R interval, and the number of slices is influenced by the patient’s heart rate. That is, with slower heart rates, there is a longer TR allowing for more slices to be sampled. The important limitation to be recognized is that each slice of a multislice acquisition will be imaged during a different portion of the cardiac cycle.
To reduce pulsatile flow artifacts when quantification of aortic valve disease is not needed, the application of pulse-triggering can be effective and is much simpler to set up as compared with ECG-triggering.
Functional Assessment
The ability to provide accurate assessments of flow velocities along with a comprehensive anatomic evaluation extends the role of MRI in aortography when an aortic valve assessment is being considered. As previously commented, however, echocardiography is the modality of choice for aortic valve evaluation in most instances, as it provides sufficient temporal and spatial resolution for structural and functional information in a noninvasive and readily obtainable format.
For aortic flow measurement with MR, a plane transecting the aortic root immediately distal to the aortic valve cusps has been recommended. Through-plane, flow measurements are obtained with velocity encoded along the slice select gradient. Such phase velocity mapping, also referred to as phase-contrast MR, is acquired at multiple points throughout the cardiac cycle, emphasizing the cross-sectional through-plane mean directed velocity. This provides measurements of systolic forward flow and diastolic reversed flow, the latter after valve closure (Fig. 17-7).
Nuances of Contrast Methods
Although detailed discussion can be found in Chapter 5, following is a summary of the key points regarding the use of intravenous contrast in thoracic aorta MRA.
Because the right brachiocephalic vein courses more directly into the right atrium, facilitating more rapid and coherent delivery of contrast to the heart, the right arm should be used for the injection of the contrast media whenever possible. Besides, the left brachiocephalic vein has been known to obscure visualization of the arch vessels due to its proximity to these vessels as it crosses left to right (33).
In order to deliver all of the contrast from the venous circulation into the heart in one efficient, tight, and coherent bolus, use of saline bolus (or flush) is recommended (34). There is no consensus about the volume to be used, but most protocols suggest around 20 mL at the same rate as the contrast injection (35). It is important to remember that a variety of injection approaches are available, and further details can be found in Chapter 5.
Different timing strategies are also available, including timing bolus, automated bolus detection (such as SmartPrep, developed by GE Healthcare), operator-dependent bolus detection (also known as FluoroTrigger, BolusTrak, and CareBolus, respectively developed by GE Healthcare, Philips Medical Systems, and Siemens Solutions), and time-resolved sequences (e.g., TRICKS and TREAT, developed by GE Healthcare and Siemens Solutions, respectively) (36,37,38,39).
Although general guidelines can be found in the literature, choices usually depend on available equipment, previous experience and success, level of expertise, individual preferences, and careful coordination in the data sampling (k-space filling strategy).
Nuances of Postprocessing
Magnetic Resonance Imaging and Angiography Pitfalls
Pseudostenosis can result from susceptibility artifacts secondary to metallic stents, surgical clips, and prostheses. These can cause signal loss within a vessel, mimicking stenosis or occlusion. Clinical information is crucial, and sometimes source images reveal a blooming or susceptibility artifact near the suspicious vascular segment (33).
Another cause of signal loss on contrast-enhanced MRA reported more recently is the suppression of intravascular
signal on fat-saturated sequences (Fig. 17-9). Magnetic susceptibility effects from aerated lung result in frequency shifts in adjacent fat- and water-containing tissues. Thus, when a spectrally selective fat-saturation technique is used, regions of water, and not adjacent fat, may be saturated. In order to identify this as an artifact, it is important to recognize the lack of luminal narrowing and the absence of collateral vessels. Because of this artifact, one should avoid the routine use of fat saturation with contrast-enhanced MR angiographic studies of the chest (40).
signal on fat-saturated sequences (Fig. 17-9). Magnetic susceptibility effects from aerated lung result in frequency shifts in adjacent fat- and water-containing tissues. Thus, when a spectrally selective fat-saturation technique is used, regions of water, and not adjacent fat, may be saturated. In order to identify this as an artifact, it is important to recognize the lack of luminal narrowing and the absence of collateral vessels. Because of this artifact, one should avoid the routine use of fat saturation with contrast-enhanced MR angiographic studies of the chest (40).
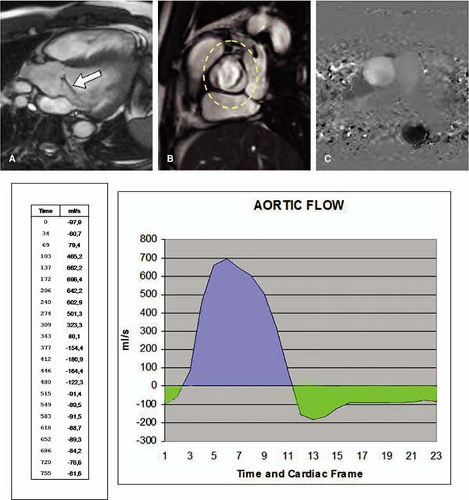 Figure 17-7 Aortic regurgitation. MRI for quantification of left ventricular systolic function and aortic valve assessment in a 39-year-old man with known aortic regurgitation. A: This cine image shows a signal void (arrow) during diastole in the left ventricular outflow tract directed toward the anterior mitral leaflet, consistent with aortic regurgitation. B: In this cine image in a plane transverse to the aortic valve, note that this is bicuspid valve (dashed circle). C: Phase-contrast cine image was obtained transverse to the ascending aorta. In this image, flow in the caudocranial direction (as in the ascending aorta, in this case) appears bright whereas flow in the opposite direction (as in the descending aorta) appears dark. The measured aortic regurgitant fraction (the green areas over the sum of the green and blue areas) was consistent with moderate to severe aortic regurgitation. |
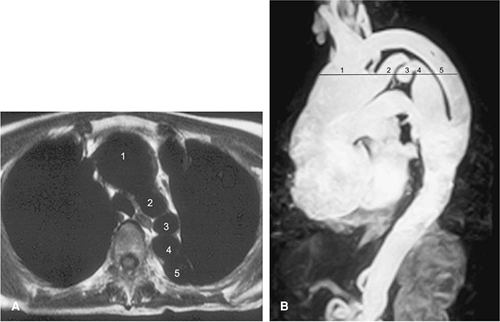 Figure 17-8 Postoperative findings in a patient with aortic coarctation surgically corrected by using an extra-anatomic bypass. In the axial dark blood HASTE image (A), a curious image results of the contiguous multiple lumina (numbers). It is not easy to appreciate their meaning in this single image. On the other hand, the sagittal MIP (B) allows the understanding of these different structures as the oblique section of a single redundant and tortuous aortic arch and the circumjacent bypass. (1, prearch ascending aorta; 2, proximal branch of coarctation; 3, pseudoaneurysm of coarctation; 4, distal portion of coarctation; 5, lumen of extra-anatomic bypass graft.) |
Anatomy
Normal Anatomy
The thoracic aorta is divided into four regions: the aortic root, the ascending aorta, the transverse aorta or aortic arch, and the descending aorta (Fig. 17-10).
The aortic root is the region of the aorta from the aortic annulus to the sinotubular junction (STJ). The normally trileaflet aortic valve is attached to the aorta at the annulus, which is a complex 3D coronet or crown-shaped structure
rather than a simple two-dimensional (2D) ring. The three sinuses of Valsalva are outpouchings above the annulus that terminate distally at the sinotubular junction or STJ. The left main and right coronary arteries typically originate at the apex of the left and right sinuses of Valsalva, respectively. The third sinus is referred to as the posterior or noncoronary sinus.
rather than a simple two-dimensional (2D) ring. The three sinuses of Valsalva are outpouchings above the annulus that terminate distally at the sinotubular junction or STJ. The left main and right coronary arteries typically originate at the apex of the left and right sinuses of Valsalva, respectively. The third sinus is referred to as the posterior or noncoronary sinus.
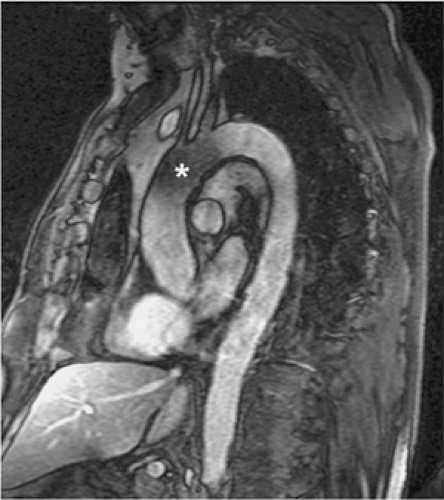 Figure 17-9 Fat-suppression artifact. Sagittal thin-slab MIP from a fat-saturated 3D MR angiographic examination demonstrates moderate loss of signal intensity within the proximal aortic arch (*). |
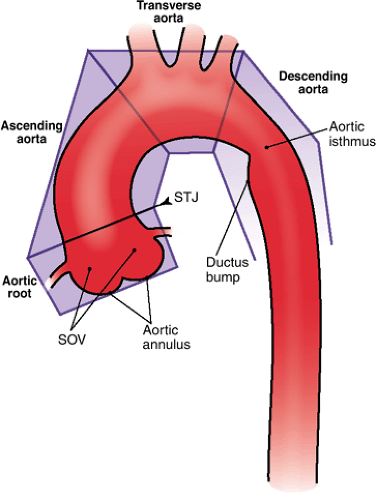 Figure 17-10 Diagram of the segments of thoracic aorta, their anatomical references, and adjacent structures. (SOV, sinuses of Valsalva; STJ, sinotubular junction.) |
The ascending aorta comprises the tubular segment of the aorta, extending from the aortic root to the brachiocephalic or innominate artery. The ascending aorta is anterior to the left atrium, right pulmonary artery, and right main bronchus. The superior vena cava and right atrial appendage are located to the right of the ascending aorta, and the pulmonary trunk is on its left. Most of the ascending aorta lies within the pericardial sac.
The transverse aorta or aortic arch extends from the proximal aspect of the brachiocephalic arterial origin to the distal aspect of the left subclavian arterial origin and thus contains the three supra-aortic branches—the brachiocephalic, left common carotid, and left subclavian arteries, which provide oxygenated blood to the neck, head, and upper extremities (further details can be found in Chapter 15). In 5% of subjects, the left vertebral artery can be seen originating separately from the aorta between the left common carotid and the left subclavian arteries. The bifurcation of the pulmonary trunk, the left main bronchus, and the left recurrent laryngeal nerve lie within the concavity of the arch. To the right are the trachea and the esophagus.
The descending aorta extends from the left subclavian artery to the aortic hiatus of the diaphragm. The aortic isthmus is that segment of the aorta between the origin of the left subclavian artery and the ligamentum arteriosum. Just distal to the isthmus, a bulge on the lesser curve of the aorta is a ductus bump, which is a normal finding and should not be confused for an aneurysm (Fig. 17-11). The esophagus is on the right of the proximal two thirds of the descending aorta. The esophagus crosses the aorta anteriorly and, distal to this, is on the left side of the descending aorta (41).
In adults, the ascending aorta is typically 5 cm in length, the arch 4.5 cm, and the descending aorta 20 cm. The diameter of the thoracic aorta is largest at the aortic root and gradually decreases distally: 3.6 cm is the average diameter of the aortic root, 3.5 cm in the ascending aorta, and 2.4 cm in the distal descending aorta (42). The diameter increases progressively with age. The aorta is smaller in females and also varies with body habitus (41).
The branches of the descending aorta are divided into visceral (pericardial, bronchial, esophageal, and mediastinal arteries) and parietal (intercostal, subcostal, and superior
phrenic arteries) branches. The pericardial branches consist of a few small vessels that are distributed to the posterior aspect of the pericardium. The bronchial arteries vary in number, size, and origin and are further discussed elsewhere in this text. The esophageal arteries are four or five in number, arise from the anterior wall of the aorta, and travel obliquely downward to the esophagus, creating a net of anastomoses along the esophagus. The mediastinal branches are multiple small vessels that supply the lymphatic tissue in the posterior mediastinum.
phrenic arteries) branches. The pericardial branches consist of a few small vessels that are distributed to the posterior aspect of the pericardium. The bronchial arteries vary in number, size, and origin and are further discussed elsewhere in this text. The esophageal arteries are four or five in number, arise from the anterior wall of the aorta, and travel obliquely downward to the esophagus, creating a net of anastomoses along the esophagus. The mediastinal branches are multiple small vessels that supply the lymphatic tissue in the posterior mediastinum.
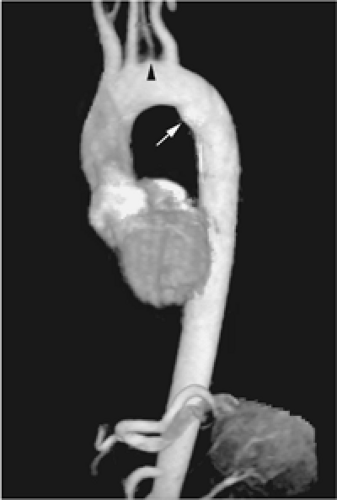 Figure 17-11 Image of a 39-year-old woman allergic to iodinated contrast and complaining of severe chest pain. Thick-slab sagittal oblique MIP demonstrates a normal ductus bump (arrow) in an otherwise unremarkable aorta. Incidentally seen is a separate origin of the left vertebral artery off the arch (arrowhead). |
The intercostal arteries are usually nine pairs that arise from the posterior wall of the aorta and course along the lower nine intercostal spaces. The first two spaces are supplied by the highest intercostal artery, a branch of the costocervical trunk of the subclavian artery. The aortic intercostal branches are longer on the right side because of the position of the aorta on the left side of the spine. They pass across the vertebral bodies, posterior to the esophagus, thoracic duct, and vena azygos, and are covered by the right lung and pleura.
The subcostal arteries lie below the last ribs and are the lowest pair of branches arising from the thoracic aorta. Each passes along the lower border of the twelfth rib, posterior to the kidney. After passing forward between the transversus abdominis muscle and the obliquus internus muscle, it anastomoses with the superior epigastric, lower intercostal, and lumbar arteries. The superior phrenic branches are small vessels that arise from the lower part of the thoracic aorta. They are distributed to the posterior part of the upper surface of the diaphragm, and anastomose with the musculophrenic and pericardiacophrenic arteries (43).
It is also important to recognize the contribution of the descending thoracic aorta to the circulation of the spinal cord (Fig. 17-12). The major arterial circulation to the
spinal cord is the anterior longitudinal spinal artery and the paired posterior longitudinal spinal arteries with the great anterior medullary artery (the artery of Adamkiewicz, arteria radicularis magna or ARM) serving as the dominant feeder of the spinal cord (44). In anatomical studies, the ARM most often originated from the left side in 72% to 78% of patients (45,46), between T8 and L1 levels in 91% of patients (45), and between T7 and L1 levels in 94% of patients (46). Koshino and colleagues (45) reported that there was no significant correlation between the diameter of the ARM and the diameters of the intercostal artery and lumbar artery from which the ARM originated.
spinal cord is the anterior longitudinal spinal artery and the paired posterior longitudinal spinal arteries with the great anterior medullary artery (the artery of Adamkiewicz, arteria radicularis magna or ARM) serving as the dominant feeder of the spinal cord (44). In anatomical studies, the ARM most often originated from the left side in 72% to 78% of patients (45,46), between T8 and L1 levels in 91% of patients (45), and between T7 and L1 levels in 94% of patients (46). Koshino and colleagues (45) reported that there was no significant correlation between the diameter of the ARM and the diameters of the intercostal artery and lumbar artery from which the ARM originated.
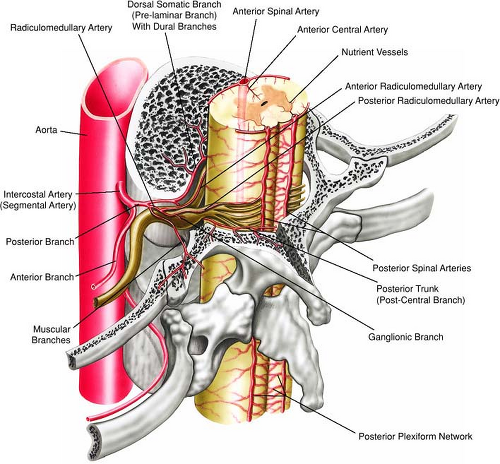 Figure 17-12 Radiculomedullary, spinal arteries, and plexiform network. (Reprinted with permission from Uflacker R. Atlas of Vascular Anatomy: An Angiographic Approach. 2nd ed. Philadelphia: Lippincott Williams & Wilkins; 2007.) |
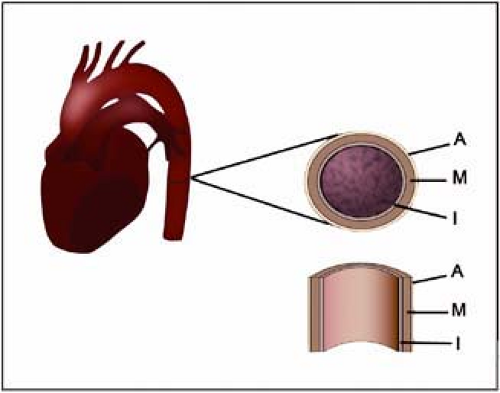 Figure 17-13 Schematic illustration of the layers constituent of the aortic wall. (I, intima; M, media; A, adventitia.) |
The aortic wall is composed of three layers: the inner layer of intima, the middle layer of media, and the outer layer of adventitia (Fig. 17-13). Studies evaluating the aortic wall thickness in vivo are far less common than those of the carotid arteries. Li and associates (47) used MRI to measure aortic wall thickness in 196 individuals without clinical evidence of cardiovascular disease. According to their results, wall thickness increases with age and is greater in men. There is no statistically significant difference between whites and blacks. The average thickness was 2.32 mm and 2.11 mm, respectively, in men and women (47).
Aneurysmal Disease
Definition and Epidemiology
An aneurysm is defined as a permanent localized enlargement of an artery to more than 1.5 times its expected diameter. Aneurysms can be seen in any location of the arterial tree but are more common in the aorta, especially in the infrarenal aorta (48). In general, the ascending and transverse aorta are considered aneurysmal when their diameter exceeds 4 cm, and the descending aorta is considered aneurysmal when its diameter exceeds 3.5 cm.
Thoracic aortic aneurysms (TAAs) are less common than abdominal aortic aneurysms but are becoming increasingly prevalent as the population ages, with an incidence of 6 per 100,000 persons per year. It is the most common condition of the thoracic aorta requiring surgical treatment. TAAs are more equally distributed between the genders than abdominal aneurysms, with a male-to-female ratio of 2:1. The afflicted population is usually elderly, and familial incidence is also present (3,49,50).
Classification and Pathogenesis
Aneurysms can be described further according to their location, morphology, and etiology.
Location is used commonly to classify aortic aneurysms for clinical significance and surgical approach. Typically, the aneurysm can be localized to the aortic root, an individual sinus of Valsalva, ascending, arch, descending, and abdominal portions of the aorta.
The morphology of an aneurysm is either fusiform or saccular. Fusiform aneurysms are sausage-like in shape; they are dilated symmetrically throughout the full circumference of the aorta. Saccular aneurysms are asymmetric and involve an outpouching of a portion of the circumference of the aortic wall.
Aneurysms also may be classified morphologically as either true or false (pseudoaneurysm). True aneurysms involve all layers of the aortic wall. A pseudoaneurysm is a contained rupture that extends through all layers of the aortic wall. The integrity of the vasculature is maintained by surrounding tissues and the chronic inflammatory reaction to extravasated blood. Pseudoaneurysms are the second most common form of TAA and the most common type in younger patients. They are contained arterial disruptions usually caused by blunt nonpenetrating trauma, most often due to rapid deceleration in motor vehicle collisions (41).
Aneurysms can be classified according to their etiology as congenital or acquired, although the pathogenesis of aortic aneurysms is complex and not completely understood. A number of hypotheses have been proposed, but no single theory has been universally accepted. Acquired aneurysms may be due to atherosclerosis, cystic medial degeneration, infection, trauma, iatrogenic, or inflammatory processes. Atherosclerosis is the most common cause of aortic aneurysms (Fig. 17-14).
The pathologic basis of atherosclerotic aneurysm is a diseased intima with secondary degeneration and fibrous replacement of the media beneath it. Following aortic dilatation, the wall is exposed to increasing tension due to the increasing lateral hydrostatic pressure as the velocity of blood flow diminishes. These factors compromise mural vascular nutrition. Increased mechanical stress and poor nutrition lead to further degeneration and progressive
dilatation. Ultimately, the aneurysm wall consists of acellular and avascular connective tissue (51,52,53).
dilatation. Ultimately, the aneurysm wall consists of acellular and avascular connective tissue (51,52,53).
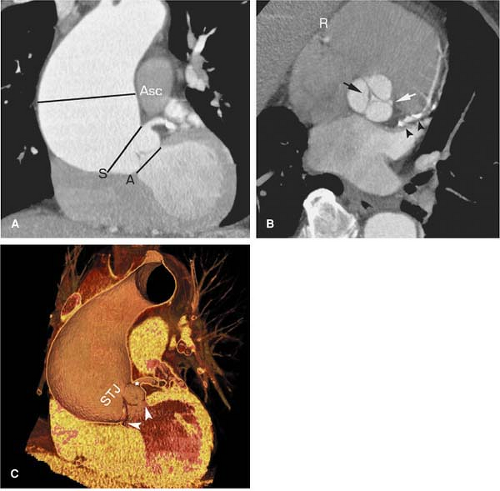 Figure 17-14 Ascending aortic aneurysm with sparing of the annulus and sinuses. A 77-year-old male with aortic stenosis and regurgitation. A: Orthogonal MPR image from a cardiac-gated MDCT angiogram shows marked dilatation of the ascending thoracic aorta, from the sinotubular junction through the arch. Annulus (A) measurement was 24 mm, sinuses (S) measured 40 mm, and ascending aorta (Asc) measured 88 mm maximally. B: Orthogonal short-axis image of the aortic valve in maximal closed position shows incomplete coaptation of the right and left leaflets (white arrow) as well as lack of central coaptation (black arrow). Note severe left coronary artery calcification (black arrowheads). The patient was found to have a significant right coronary artery stenosis, which was treated by saphenous vein bypass grafting at the time of aortic valve replacement. The right coronary artery (R) is seen in cross section in the right atrioventricular groove. C: Volume-rendered image shows sparing of the annulus (white arrowheads) and preferential dilatation from the sinotubular junction (STJ) cephalad. The left main coronary artery is also noted in normal position (*). |
Medial degeneration resulting from repetitive aortic injury and repair encountered in aging, sometimes accelerated by connective disorders (such as Marfan and Ehlers-Danlos syndromes), is the most common cause of degenerative aneurysms. These are the most common aneurysms in the ascending aorta (52,54).
Connective disorders (such as Marfan and Ehlers-Danlos syndromes) are genetic conditions that affect the connective tissues throughout the body. In Marfan syndrome, a major elastic fiber protein found in the wall of the aorta is defective, and most patients with this disease develop aneurysms of the ascending aorta with subsequent malfunctioning of the aortic valve (Figs. 17-15, 17-16 and 17-17). In contrast to ascending aortic aneurysms in patients without underlying connective tissue disease, which tend not to involve the aortic root, patients with Marfan disease often manifest annuloaortic ectasia and aortic root aneurysms (Fig. 17-15). The annular dilation results in incomplete coaptation of the aortic valve leaflets and aortic valvular insufficiency (Fig. 17-16).
Another important and independent risk factor for the development of ascending aortic and aortic root aneurysms is bicuspid aortic valve disease. The disease has a prevalence of approximately 1:1,000 with a 4:1 male predominance and familial aggregation. The disease is associated with aortic coarctation, coronary artery anomalies, and patent ductus arteriosus. Aortic root dilation is present in approximately 50% of individuals and is a precursor to aneurysm and dissection. Aortic dissection occurs in 5% of affected individuals. Routine surveillance of subjects with bicuspid aortic valve by using echocardiography is advised (55).
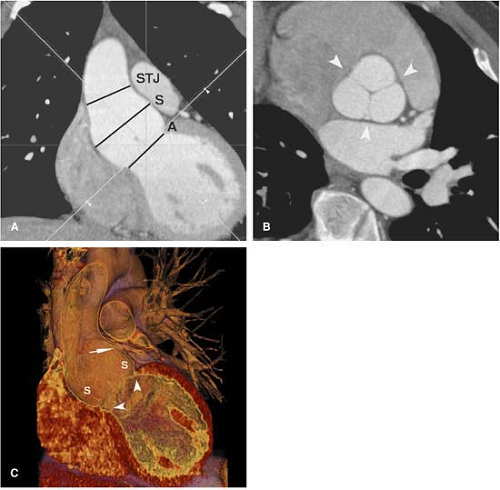 Figure 17-15 Utility of cardiac-gated MDCT angiography for evaluation of aortic root pathology in a 43-year-old male with Marfan syndrome. A: Orthogonal MPR image from retrospectively gated MDCT angiogram shows dilatation of the aortic annulus, reaching 34 mm in size (normal range 23 to 27 mm). There is dilatation of the sinuses of Valsalva (S), reaching 48-mm orthogonal dimension. At the sinotubular junction (STJ), there is less dilatation, measuring 33 mm. Annuloaortic ectasia may be seen in Marfan syndrome, forme-fruste Marfan, Ehlers-Danlos syndrome, osteogenesis imperfecta, and other connective tissue disorders; it may also be idiopathic. B: Orthogonal short-axis image of the aortic valve shows trileaflet configuration (arrowheads). The ability to create a “cine” loop of the retrospectively reconstructed gated MDCT series allows excellent detail of valvular motion and coaptation. C: Volume-rendered image shows dilatation of the aortic annulus (arrowheads) and sinuses (S). The left main coronary artery (arrow) arises high from the left sinus of Valsalva, which is important for planning of valve-sparing surgery. Aortic dilatation in Marfan syndrome may be complicated by dissection and aortic regurgitation. |
Although primary aortic infection may result in aortic aneurysmal disease (commonly seen in patients with syphilis in the preantibiotic era), secondary infection is more common. An aneurysm caused by nonsyphilitic infection of the arterial wall is known as mycotic aneurysm, a misnomer generally adopted and originally applied based on the gross pathologic appearance (mushroom-like morphology) (56). The most common pathogens for blood-borne infection are Staphylococcus and Salmonella, and contiguous spread is rare but most commonly due to tuberculosis extending from the spine (57,58). Mycotic aneurysms are often insidious and may lead to sepsis and aortic rupture if untreated. The normal arterial intima is extremely resistant to infection, and the development of a mycotic aneurysm requires prior damage to the aortic wall. Its prevalence is increased in immunocompromised patients, and predisposing factors include contiguous bacterial endocarditis, atherosclerosis, drug abuse, and aortic trauma (caused by accidents, surgery, or catheterization) (59).
Other noninfective generalized inflammatory processes are associated with TAAs, including Takayasu arteritis, giant cell arteritis, ankylosing spondylitis, psoriatic arthritis, rheumatic fever, rheumatoid arthritis, relapsing polychondritis, Reiter syndrome, systemic lupus erythematosus, scleroderma, ulcerative colitis and Behçet disease. (41).
Clinical Presentation and Natural History
Because no large-scale screening programs for aortic aneurysm are in place and TAAs seldom produce symptoms, most of them are discovered on imaging during investigation of an unrelated problem. Although uncommon,
symptoms usually are the result of a large aneurysm compressing (Fig. 17-18) or eroding adjacent structures, including superior vena cava syndrome, stridor or dyspnea due to tracheobronchial compression, dysphagia due to esophageal compression, and hoarseness secondary to recurrent compression of the laryngeal nerve. Acutely expanding aneurysms produce severe deep back pain. This presentation often precedes rupture, and urgent treatment is required. Rarely, the first clinical manifestation is embolization to the lower extremity. This complication is not related to the size of the aneurysm and constitutes itself an independent indication for repair (41,60,61).
symptoms usually are the result of a large aneurysm compressing (Fig. 17-18) or eroding adjacent structures, including superior vena cava syndrome, stridor or dyspnea due to tracheobronchial compression, dysphagia due to esophageal compression, and hoarseness secondary to recurrent compression of the laryngeal nerve. Acutely expanding aneurysms produce severe deep back pain. This presentation often precedes rupture, and urgent treatment is required. Rarely, the first clinical manifestation is embolization to the lower extremity. This complication is not related to the size of the aneurysm and constitutes itself an independent indication for repair (41,60,61).
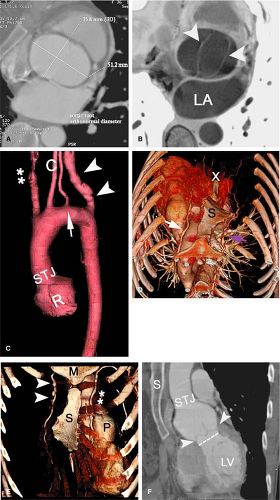 Figure 17-16 Marfan syndrome in a 36-year-old female with bicuspid aortic valve and aneurysms of aortic root and left subclavian artery. Images from ECG-gated CTA of the chest. A: Orthonormal (obtained orthogonal to vessel centerline) measurement at sinuses of Valsalva demonstrates aneurysmal dilatation of the aortic root, reaching 51 mm in dimension. B: MPR with inverted grayscale, obtained orthogonal to aortic valve in systole. The two aortic valve leaflets are well demonstrated (arrowheads), assuming a “fish-mouth” appearance typical of bicuspid aortic valve. (LA, left atrium.) C: Volume-rendered image of thoracic aorta with bone segmentation shows the typical “onion-bulb” appearance of the aortic root (R). There is dilation of the aortic annulus and sinuses of Valsalva, with preservation of the sinotubular junction (STJ). There is a fusiform aneurysm of the left subclavian artery (arrowheads). There is separate origin of the left vertebral artery directly from the aortic arch (arrow), which represents variant anatomy. An artifact from the bone segmentation process is created in the innominate artery (**), secondary to streak artifact from dense contrast in the venous system on the source images. (C, left common carotid artery.) D: Volume-rendered image viewed from the head shows a severe pectus excavatum deformity with depression and angulation of the sternum (S). There are focal aneurysms of the right internal mammary artery (purple arrow). There is ectasia of the left internal mammary artery (white arrow) but no focal aneurysm. (X, xyphoid process.) (Figure 17-16) E: Volume-rendered image viewed anteriorly shows the right internal mammary aneurysm (arrowheads). The sternal deformities are again seen (S). (**, left internal mammary artery; M, manubrium; P, pulmonary outflow tract.) F: Oblique coronal thin-slab MIP image demonstrates widening of the aortic annulus (– – – – –), measuring 31 mm. There is good coaptation of the aortic valve on this image in diastole (arrowheads). There is preservation of the sinotubular junction (STJ). (LV, left ventricle; S, sternum.) |
The natural history of aortic aneurysms is to enlarge and rupture (Fig. 17-19), and treatment strategies are designed to prevent this complication since an overall mortality rate of 94% is found following rupture (50). Unlike
rupture of abdominal aortic aneurysms, which can be contained in the retroperitoneal compartment, rupture of TAAs is usually unrestrained and rapidly fatal. The single most important factor associated with rupture is maximal cross-sectional aneurysm diameter. Equal in significance but less commonly used is maximal cross-sectional area (48,62,63,64,65).
rupture of abdominal aortic aneurysms, which can be contained in the retroperitoneal compartment, rupture of TAAs is usually unrestrained and rapidly fatal. The single most important factor associated with rupture is maximal cross-sectional aneurysm diameter. Equal in significance but less commonly used is maximal cross-sectional area (48,62,63,64,65).
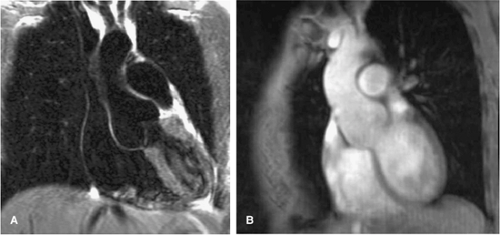 Figure 17-17 Coronal oblique dark blood HASTE (A) and postcontrast (B) in an asymptomatic patient with Marfan syndrome show a dilated tulip-bulb appearance of the aortic root. |
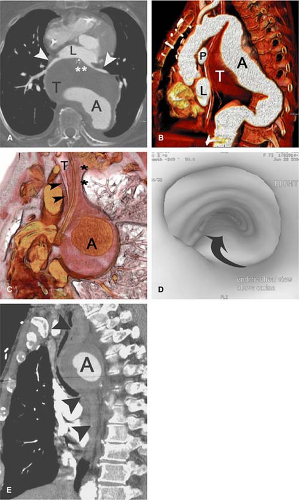 Figure 17-18 A 73-year-old female with thoracic aortic aneurysm causing compression of mediastinal structures. A: Axial image at level of the left atrium (L) depicts an aneurysm of the descending thoracic aorta (A), which contains a large amount of thrombus (T). There is marked compression of the pulmonary veins (arrowheads) and left atrium. A nasogastric tube in the esophagus is displaced anteriorly (**). B: Oblique sagittal volume-rendered image demonstrates the large aneurysm (A) and anterior thrombus (T). There is marked elongation and tortuosity of the descending thoracic aorta. Mass effect on the left atrium (L), pulmonary artery (P), and nasogastric tube is noted again. C: Oblique volume-rendered image is rendered with airway opacity, viewed from left posterior oblique. There is marked mass effect on the nasogastric tube (**) by the aneurysm (A). The trachea (T) is also narrowed along its inferior portion (arrowheads). D: Virtual bronchoscopic view of the trachea reconstructed from the CTA data set shows the degree of compression of the distal trachea (arrow), near the carina. E: Sagittal thin-slab MIP image demonstrates high-density esophageal contents (arrowheads) draped around the aneurysm (A). At surgery, an aortoesophageal fistula was found. |
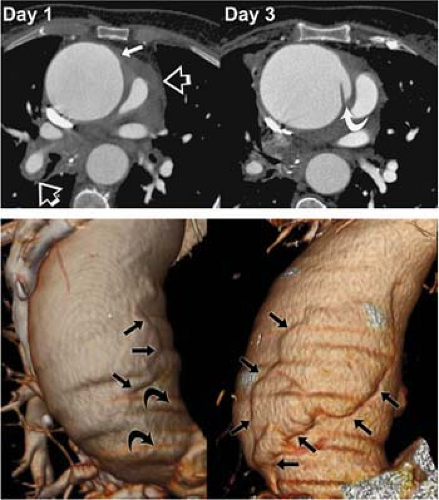 Figure 17-19 A 73-year-old man with chest pain referred to CT to assess for pulmonary embolism. The transverse section and volume rendering on the left were obtained at the time of initial presentation, and the transverse section and volume rendering on the right were obtained 2 days later. Initially, the transverse section demonstrated a 6-cm ascending aortic aneurysm with thrombus in the mediastinum extending around the left interlobar pulmonary artery (open arrows). A subtle contour irregularity is present on the anteromedial surface of the ascending aorta (small arrow), corresponding to the only direct manifestation of mural instability at this time. The volume rendering below reveals an obvious longitudinal “crack” (small black arrows) at the site of the contour abnormality on the transverse section. It is distinguished from transverse ridges (curved arrows) that are caused by aortic pulsation in this ungated acquisition. Two days later, the rupture has progressed with aneurysm expansion and undermining of the intimomedial complex (curved white arrow) and early pseudoaneurysm formation (black arrows). The patient underwent ascending aortic replacement where a ruptured aneurysm was identified with only the aortic adventitia preventing exsanguinations. |
Imaging Findings
The criteria for diagnosing aortic aneurysm with CT are well established. Information regarding the focal or diffuse nature of aortic dilatation and deformity, as well as the length of the aneurysm, is readily available on unenhanced scans. Unenhanced CT scans are also important for identifying calcification and acute hematomas. Peripheral calcifications have been reported in about 75% of aortic aneurysms. It is important to remember that peripheral calcification on the surface of the false lumen in a chronic dissection can mimic an aneurysm (41,66).
Mural thrombus is frequently present with aneurysmal disease. There is a direct relationship between the size of the aneurysm and the amount of thrombus. Thrombus may be circumferential or crescentic. Since the thrombus is usually removed in the open surgical approach, and inadequate manipulation of the thrombus may result in embolization to distal vessels, knowledge of the position and amount of mural thrombus may be important in surgical planning. The injection of intravenous contrast material is usually required to differentiate between the patent lumen and mural thrombus (41,66,67) (Fig. 17-20).
The aorta can be dilated or normal in caliber following dissection. Aortic dissection can be accurately differentiated from aneurysms when an intimal flap and two aortic lumens are demonstrated. Intravenous contrast material is usually required for visualization of an intimal flap on CT,
but it is sometimes visible on unenhanced images. It may be challenging to distinguish an aneurysm with thrombus from an aortic dissection with a thrombosed false lumen. In this setting, the most reliable sign of dissection is the presence of a recent thrombus within the aortic wall (41,68).
but it is sometimes visible on unenhanced images. It may be challenging to distinguish an aneurysm with thrombus from an aortic dissection with a thrombosed false lumen. In this setting, the most reliable sign of dissection is the presence of a recent thrombus within the aortic wall (41,68).
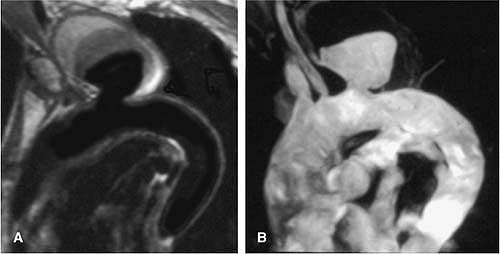 Figure 17-20 Arch aneurysm. Note the distinct layers with high and intermediate signal within the mural thrombus that represent blood in different stages of decomposition in the black blood image (A) and the remaining patent region of the aneurysm in the postcontrast MIP image (B). (Courtesy of Mark Flyer, MD.) |
CT and MRI are superior to angiography in evaluating the true size of an aneurysm because of the ability to demonstrate mural thrombus with cross-sectional techniques (for further details, refer to Chapter 6). Furthermore, CT and MRI have the advantage of being minimally invasive. CT and angiography can better depict the coronary arteries. MRI and angiography can better demonstrate aortic insufficiency. In comparison to conventional angiography, CT and MRI are usually capable of better depicting the relationship of an aortic aneurysm to adjacent structures and the attendant complications that may be present. Subtle erosion of bone, compression of the tracheobronchial tree, pulmonary vessels or the superior vena cava, and esophageal displacement or obstruction may be appreciated (41,60) (Fig. 17-21).
As discussed previously, atherosclerosis is the leading cause of TAAs. Atherosclerotic aneurysms usually begin distal to the left subclavian artery and are relatively uncommon in the ascending aorta. Saccular aneurysms of the ascending thoracic aorta should prompt consideration of an infectious etiology. Whereas syphilis was formerly the major cause of eccentric ascending aortic aneurysms, currently, the most common cause of a saccular ascending thoracic aortic aneurysm is atherosclerosis. TAAs may extend into the abdomen, or a second aneurysm in the abdominal aorta can be present. Most of them are fusiform, but up to 20% are saccular (41).
Degenerative aneurysms are the most common in the ascending aorta. Involvement of the aortic sinuses and concurrent cardiovascular diseases are frequent. The aneurysmal dilatation generally decreases at higher levels in the ascending aorta, and the aortic arch is usually normal. Aortic calcifications are rare. Aortic valve regurgitation is common, occurring in all patients with a diameter over 6 cm. Annuloaortic ectasia is the combination of an aneurysm of the aortic root and aortic valve regurgitation due to dilatation of the aortic annulus (41).
Most traumatic pseudoaneurysms of the thoracic aorta occur near the aortic isthmus. Acute aortic transection can be diagnosed as subtle changes in aortic contour with CT and MRI, but CT is the preferred method in the emergency setting. Nevertheless a mediastinal hematoma, even in a periaortic location, does not mean that the aorta is traumatized (69). Angiography is the definitive method of making or excluding the diagnosis of aortic injury. If secondary rupture of the aorta does not occur, a chronic pseudoaneurysm will develop. These usually calcify and may contain thrombus (41).
In its classical appearance, mycotic aneurysms are saccular, with an irregular lumen, perianeurysmal fluid, gas and/or hematoma, osteomyelitis in adjacent vertebral bodies, and disruption of intimal calcification (70).
Thoracic aortic aneurysms may rupture into the mediastinum (Fig. 17-22), pericardium, pleural sac, or the extrapleural space. Aortobronchopulmonary fistula is rare
and is demonstrated as a consolidation of the lung adjacent to the aneurysm (71,72).
and is demonstrated as a consolidation of the lung adjacent to the aneurysm (71,72).
 Figure 17-21 Post-traumatic pseudoaneurysm in a 50-year-old male patient, a victim of a motor vehicle accident 30 years before, now complaining of a pulsatile left neck mass. The axial (A)
Get Clinical Tree app for offline access
Stay updated, free articles. Join our Telegram channel
Full access? Get Clinical Tree


|