Stress echocardiography is based on the fundamental causal relationship between induced myocardial ischemia and left ventricular regional wall motion abnormalities. The potential for using echocardiography for this purpose was first reported in 1979 when two groups of investigators demonstrated the proof of concept. Mason and colleagues used M-mode echocardiography to study 13 patients with coronary artery disease and 11 age-matched control subjects during supine bicycle exercise. Stress-induced wall motion changes were detected in 19 of 22 segments supplied by stenotic coronary arteries. Although this was the first demonstration of transient ischemia being detected with ultrasound, the inherent limitations of the M-mode technique were apparent. That same year, Wann and coworkers applied an early two-dimensional, 30° sector imaging system to demonstrate inducible wall motion abnormalities during supine bicycle exercise and subsequent improvement of the wall motion response after revascularization. These early studies were limited by image quality and a reliance on videotape analysis, factors that would slow the growth of the field in its early years.
In the 1980s, improvement in image quality and the development of digital acquisition technology, or frame grabbers, contributed to greater accuracy and increased the practicality of using stress echocardiography in clinical situations. Most important, the digitization of echocardiographic images reduced the problem of respiratory interference by permitting selection of cardiac cycles that were devoid of lung interference and the creation of cine loops that permitted side-by-side analysis of rest and stress images. This allowed more accurate interpretation of wall motion, largely by permitting relatively subtle changes in stress-induced wall motion to be detected. Digital technology also shortened the acquisition time for postexercise imaging and facilitated display, storage, and transmission of echocardiographic data. More than any other single factor, the application of digital imaging led to the rapid development of stress echocardiography as a clinical tool.
In the past 15 years, stress echocardiography has continued to evolve. The addition of contrast in selected patients has led to improved endocardial border detection. Subsequent developments in microbubble technology provided a mechanism for semiquantitative evaluation of regional perfusion. Most recently, real-time three-dimensional imaging has been applied to stress echocardiography to provide a more complete recording of left ventricular function.
Physiologic Basis
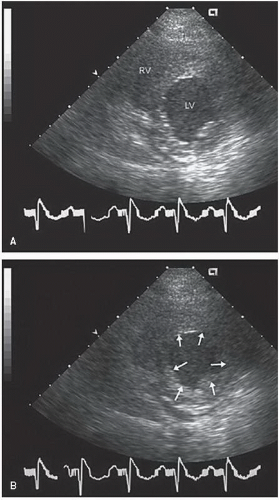
In the 1930s, Tennant and Wiggers observed the relationship between systolic contraction and myocardial blood supply to the left ventricle. With the induction of ischemia, these investigators demonstrated the rapid and predictable development of systolic bulging (or dyskinesis). This observation established the link between induced ischemia and transient regional myocardial dyssynergy, recorded echocardiographically as the development of wall motion abnormality after the application of a stressor (Fig. 17.1).
In the absence of a flow-limiting coronary stenosis, physiologic stress results in an increase in heart rate and contractility that is maintained via an increase in myocardial blood flow. Systolic wall thickening, endocardial excursion, and global contractility all increase, leading to a decrease in end-systolic volume (and an increase in the ejection fraction) compared with baseline. Although this response may be blunted in the setting of advanced age and/or hypertension or in the presence of beta-blocker therapy, absence of the hypercontractile state in response to stress should generally be considered an abnormal response.
FIGURE 17.1. Short-axis views of a patient during an episode of acute ischemia in diastole (A) and systole (B). With the onset of ischemia, anterior and lateral akinesis (arrows) develops almost immediately.
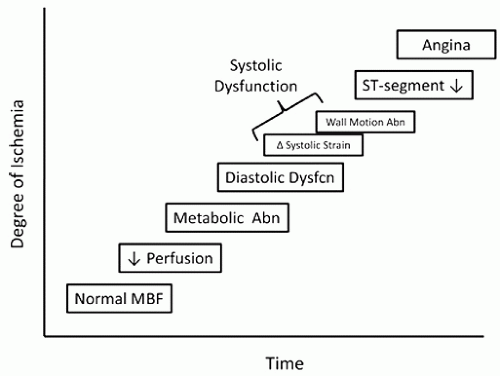
FIGURE 17.2. The ischemic cascade is the term used to describe the sequence of events that occur after the onset of ischemia. The temporal abnormalities develop in a predictable sequence, as demonstrated in this schematic. Wall motion abnormalities detectable by echocardiography generally develop after a perfusion defect but before electrocardiographic changes or angina. Abn, abnormal; Dysfcn, dysfunction; MBF, myocardial blood flow.
In the presence of a coronary stenosis, the increase in myocardial oxygen demand that occurs in response to stress is not matched by an appropriate increase in supply. If the supplydemand mismatch persists, a complex sequence of events known as the ischemic cascade will develop (Fig. 17.2). It should be recognized that the ischemic cascade is a generalization. The overlap of the parameters depicted in the schematic is intended to convey the variability that exists. That is, in an individual patient, the sequence and timing of the ischemic markers will vary. For example, ST-segment depression may occur early or later than depicted, or may not occur at all.
Soon after the development of a regional perfusion defect, a wall motion abnormality will occur, characterized echocardiographically as a reduction in systolic thickening and endocardial excursion. The severity of the wall motion abnormality (hypokinesis versus dyskinesis) will depend on several factors, including the magnitude of the blood flow change, the spatial extent of the defect, the presence of collateral blood flow, left ventricular pressure and wall stress, and the duration of ischemia. Deterioration in regional wall motion, however, is a specific and predictable marker of regional ischemia that generally precedes such traditional manifestations as angina or electrocardiographic abnormalities.
Once the stressor is eliminated, myocardial oxygen demand decreases and ischemia resolves. Normalization of wall motion may occur rapidly, although typically the complete recovery of normal function takes 1 to 2 minutes, largely depending on the severity and duration of ischemia. Stunned myocardium is the term applied when functional abnormalities persist after transient ischemia for a longer period. Although a reversible process, stunning may last days or even weeks if the ischemia is severe and prolonged.
Table 17.1 Causes of Wall Motion Abnormalities
Wall Motion Abnormalities at Rest
Wall Motion Abnormalities during Stress
Infarction
Ischemia
Cardiomyopathy
Translational cardiac motion
Myocarditis
Marked increase in blood pressure
Left bundle branch block
Cardiomyopathy
Hypertension/afterload mismatch
Rate-dependent left bundle branch block
Hibernating myocardium
Pulmonary hypertension
Stunned myocardium
Toxins (e.g., alcohol)
Postoperative state
Paced rhythm
Right ventricular volume/pressure overload
The utility of echocardiography in conjunction with stress testing is contingent on the ability to record wall motion and left ventricular function at baseline and then to detect changes after the induction of stress, either exercise or pharmacologic (Table 17.1). At baseline, the presence of a regional wall motion abnormality generally implies the presence of previous myocardial damage, in most cases due to myocardial infarction. Less often, cardiomyopathy and stunned or hibernating myocardium cause resting wall motion abnormalities. Regional deterioration of left ventricular function during stress is a specific marker of ischemia. Although exercise-induced wall motion abnormalities may occasionally occur in normal individuals after prolonged, intense exercise, this type of response during stress testing is usually the result of significant coronary disease. A global decrease in left ventricular function in response to stress, however, may be due to other causes, such as hypertension, valve disease, or cardiomyopathy. Therefore, by comparing regional wall motion at baseline and during stress, the presence of inducible ischemia can be detected and localized.
Although most of the useful information gathered during stress echocardiography is dependent on two-dimensional imaging and the analysis of regional and global left ventricular function, several other useful parameters should also be considered. For example, Doppler techniques can be applied to measure changes in stroke volume that occur during stress. Analysis of mitral inflow velocity and annular tissue Doppler velocity has been used to assess diastolic abnormalities in response to stress. This may be especially helpful in patients with exertional dyspnea. As is discussed later, Doppler imaging has particular utility in the evaluation of patients with valvular heart disease, prosthetic valves, and hypertrophic cardiomyopathy. Stress testing in these patients can provide valuable information and has been used to assess the effectiveness of therapy and to make decisions regarding the timing of interventions.
The application of contrast echocardiography has the potential to revolutionize stress echocardiography by providing the simultaneous opportunity to assess regional myocardial perfusion in conjunction with wall motion analysis. Relative changes in myocardial perfusion in response to stressors form the basis of most nuclear stress techniques. Instead of relying on the development of wall motion abnormalities, perfusion methods depend on an ability to detect an abnormal blood flow (or perfusion) response. Because changes in myocardial perfusion precede regional systolic dysfunction, contrast echocardiography offers the potential for a more sensitive marker of myocardial ischemia.
Table 17.2 Types of Stressors Used in Stress Echocardiography
Exercise
Nonexercise Stress
Treadmill
Dobutamine
Supine bicycle
Dipyridamole
Upright bicycle
Dipyridamole/dobutamine combination
Handgrip
Adenosine
Stair step
Pacing
Methodology
Guidelines for the performance, interpretation, and application of stress echocardiography have recently (Pellikka et al., 2007) been published by the American Society of Echocardiography. One of the advantages of stress echocardiography is its versatility with respect to the type of stress used (Table 17.2). Echocardiographic imaging can be applied to both exercise and pharmacologic stress for the detection of myocardial ischemia. Exercise echocardiography is most often performed using either treadmill or bicycle (upright or supine) exercise. The most common pharmacologic agent used in conjunction with echocardiography is dobutamine. Less commonly used stressors include isometric exercise such as handgrip, vasodilators such as dipyridamole or adenosine, and pacing, usually through a transesophageal approach. Modalities may even be combined. For example, handgrip may be used during dobutamine stress to increase workload and improve sensitivity.
Treadmill
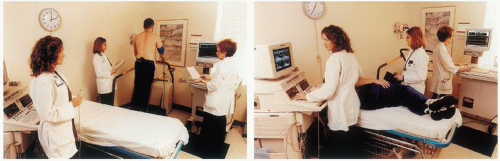
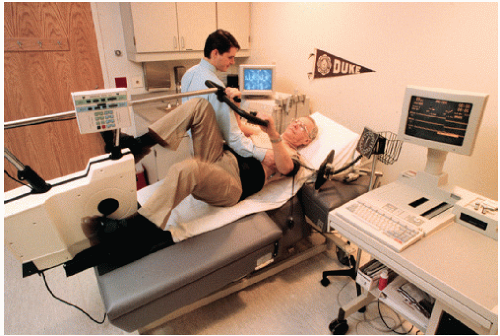
Treadmill exercise is the most common form of stress testing in the United States. It provides a plethora of useful clinical information that has both diagnostic and prognostic value. These include exercise capacity, blood pressure response, and arrhythmias. It is safe and well tolerated and can be applied to a large percentage of the patients referred for stress testing. Because clinicians have become comfortable with this form of stress testing and because of the widespread availability of treadmill equipment, it is logical that stress echocardiography should be applied to this technique (Fig. 17.3).
FIGURE 17.3. A treadmill exercise echocardiogram is being performed. The proximity of the echocardiography bed to the treadmill is critical so that postexercise images can be acquired immediately after termination of exercise.
Echocardiographic imaging in conjunction with treadmill exercise is intended not to alter the standard exercise protocol. Imaging is performed before and immediately after treadmill exercise, without affecting the exercise portion of the test. Thus, the advantages of treadmill exercise echocardiography include preserving the additional information already available from treadmill exercise, the widespread availability of this form of stress, and the relatively simple protocol created by the addition of echocardiographic imaging. The primary disadvantage of treadmill echocardiography stems from the difficulty in obtaining images while patients walk in an upright position. For this reason, imaging is limited to the immediate postexercise period. Because ischemia may resolve quickly after termination of exercise, it is incumbent on the operator to complete postexercise imaging as soon as possible, certainly within 1 to 1.5 minutes after exercise. As soon as the exercise test ends, the patient must step off the treadmill and assume a recumbent position so that imaging can be completed quickly.
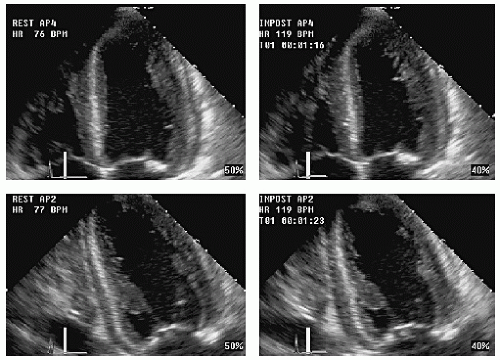
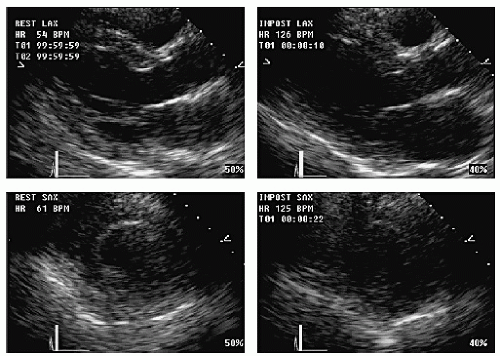
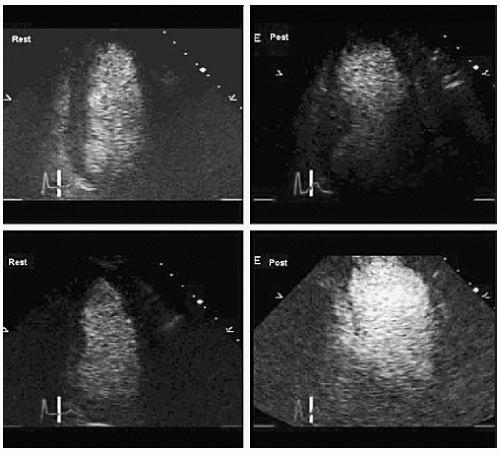
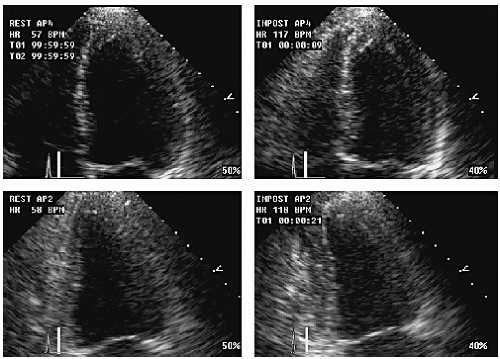
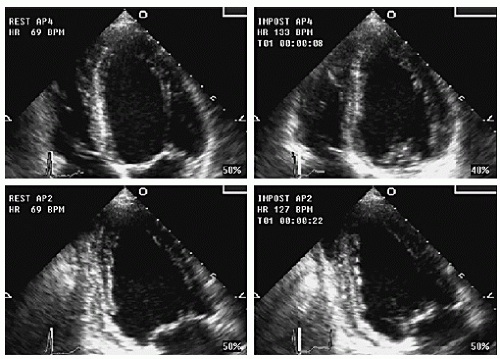
Although any available transthoracic view can be used in exercise echocardiography protocols, the traditional approach has included the parasternal long- and short-axis and the apical four- and two-chamber views. The apical long-axis, the subcostal four-chamber, and short-axis views may also be included at the discretion of the operator. Image acquisition can be individualized, depending on available ultrasound windows but is always intended to acquire images that provide more than one opportunity to examine each region of the left ventricle. In addition, some attention to right ventricular function and wall motion should also be a part of most stress echocardiographic protocols. Figure 17.4 is an example of a treadmill exercise echocardiogram showing the apical four- and two-chamber views. The resting or baseline images are on the left and the postexercise images are on the right. Each quadrant contains annotated information about heart rate, stage, time of acquisition, etc.
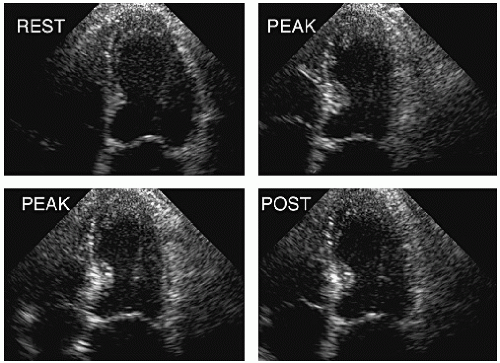
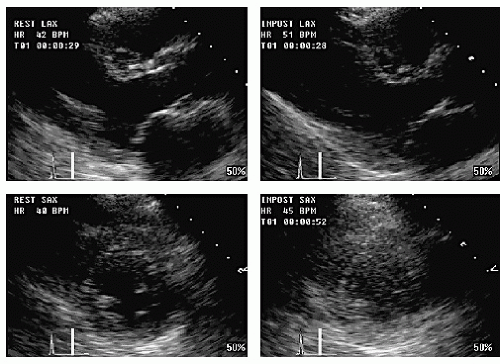
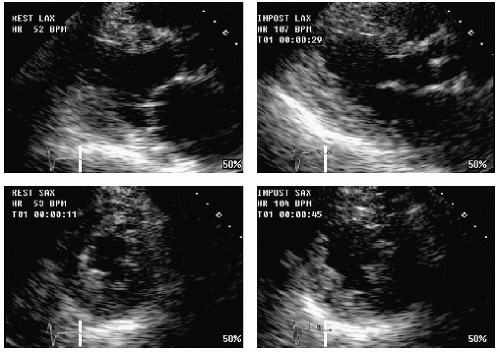
Resolution of induced wall motion abnormalities before postexercise imaging can be completed is a cause of false-negative results (Fig. 17.5). In this example, with treadmill exercise, anterior ischemia is evident in the long- and short-axis views, less obvious in the four-chamber view, and no longer present in the two-chamber view. This is because the wall motion abnormality resolved over the course of poststress image acquisition. As the heart rate decreases postexercise, wall motion recovers. If an adequate workload is achieved and postexercise images are acquired within 1 minute, the likelihood of a false-negative finding is minimized. Figure 17.6 is another example of rapid recovery, in this case during supine bicycle exercise. Note the obvious apical wall motion abnormality at peak exercise. Postexercise, there is near normalization of wall motion. Why some wall motion abnormalities normalize very quickly is not completely understood. Several investigators have compared peak and postexercise imaging during bicycle protocols and examined the frequency and possible causes of rapid recovery of wall motion abnormalities. Exercise duration, extent of disease, workload achieved, or medical therapy is not predictive of rapid recovery. Conversely, wall motion abnormalities that persist into late recovery generally indicate more severe epicardial coronary disease and/or multivessel disease.
FIGURE 17.4. The standard format to display stress echocardiographic images. This example, from a treadmill exercise echocardiogram, demonstrates the four-chamber view at the top and the two-chamber images at the bottom. The resting study is displayed on the left and the immediate postexercise images are on the right. Note that heart rate, exercise duration, and time of image acquisition are displayed for each quad.
Bicycle Ergometry
Stationary bicycle ergometry was the first form of exercise used in conjunction with echocardiography. Initially, upright bicycle ergometers were used and imaging was performed during and after exercise. Later, supine bicycle systems that permit a variety of patient positions became popular. By providing an approximately 30° head-up tilt of the patient, a balance between comfort and image quality can be achieved (Fig. 17.7). To perform graded exercise, patients pedal at a constant cadence at increasing levels of resistance.
FIGURE 17.5. An example of rapid recovery of abnormal wall motion is demonstrated in a patient undergoing treadmill exercise. The resting study is normal. Postexercise, septal, and apical ischemia develops and is evident in the long-and short-axis views. The abnormality is less apparent in the four-chamber view and nearly resolved in the two-chamber view. Image acquisition was completed in approximately 75 seconds.
FIGURE 17.6. This study demonstrates rapid recovery during supine bicycle exercise. An obvious apical wall motion abnormality develops during exercise and is recorded at peak (right upper and left lower quads). Postexercise (right lower quad) wall motion is nearly normal. This is especially apparent in the two-chamber view.
The primary advantage of bicycle stress echocardiography is the ability to image throughout exercise, particularly at peak stress. This not only avoids the potential problem of rapid recovery but also permits the onset of a wall motion abnormality to be documented. Exercise-induced wall motion abnormalities are more frequent, more extensive, and more easily visualized at peak compared with postexercise. Imaging at intermediate stages can also be analyzed and this may improve the sensitivity of the test by facilitating the detection of a biphasic response. Image acquisition at peak exercise is less rushed than postexercise imaging, so image quality is often better. The application of contrast to stress echocardiography is also easier using bicycle exercise compared with treadmill exercise. The major disadvantage of bicycle exercise echocardiography is the problem of workload. Some patients find bicycling in the supine position very difficult, which may prevent an adequate level of stress to be achieved. However, supine posture appears to facilitate the induction of ischemia, perhaps by increasing venous return and preload or because it is associated with a greater blood pressure response. As a result, ischemia occurs at a lower heart rate during supine versus upright exercise. Again, the newer generation of bicycle ergometers increases the comfort and tolerability of supine exercise.
FIGURE 17.7. A supine bicycle exercise system. The patient is positioned to maximize comfort and to ensure optimal image acquisition. Imaging can be performed throughout the exercise protocol. See text for details.
Dobutamine Stress Echocardiography
Dobutamine is a synthetic catecholamine that causes both inotropic and chronotropic effects through its affinity for β1, β2, and α receptors in the myocardium and vasculature. Because of differences in affinity, the cardiovascular effects of dobutamine are dose dependent, with augmented contractility occurring at lower doses followed by a progressive chronotropic response at increasing doses. Peripheral effects may result in either predominant vasoconstriction or vasodilation, so changes in vascular resistance (i.e., blood pressure) are unpredictable. The net effect of these interactions is a combined increase in contractility and heart rate with an associated increase in myocardial oxygen demand. If coronary flow reserve is limited, myocardial oxygen demands will eventually exceed supply and ischemia will develop.
It should be noted that the mechanism of action of dobutamine is not identical to exercise. For example, the change in venous return that typically accompanies leg exercise is less pronounced with dobutamine. In addition, the autonomic nervous system-mediated changes in systemic and pulmonary vascular resistance are quite different with exercise compared with dobutamine. These differences have implications for the determinants of the ischemic threshold during exercise and pharmacologic stress. For example, heart rate response is less important with dobutamine compared with exercise, and ischemia can often be induced even if target heart rate is not attained. The lower heart rate achieved during dobutamine infusion is offset by the greater augmentation in contractility. Thus, the two modalities are both capable of producing ischemia but do so by different mechanisms. As a result, the parameters that define an adequate level of stress are also different.
The primary application of dobutamine echocardiography is in patients unable or unwilling to exercise adequately. The ability of dobutamine to mimic the cardiac effects of exercise, coupled with the safety and versatility of the test, has contributed to the popularity of dobutamine echocardiography. A related application has been for the detection of viable myocardium in the setting of either stunned or hibernating myocardium. As with exercise, the goal is to produce a graded increase in cardiac workload that can be monitored for the development of ischemia. To do this, dobutamine is infused at increasing rates for 3- to 5-minute stages. Although this duration at each stage is insufficient to produce a steady-state effect, it generally yields a gradual and well-tolerated increase in both contractility and heart rate. Atropine is frequently used to augment the heart rate response. The use of atropine for this purpose has been shown to improve sensitivity, especially in patients taking betablockers. Although there is no universally agreed-on protocol for dobutamine administration, a commonly used approach is outlined in Table 17.3.
Table 17.3 Protocol for Dobutamine Stress Echocardiography
Patient is prepared for standard stress testing.
Intravenous access is obtained.
Digital images are acquired at baseline (these loops are displayed and used as reference throughout the infusion).
Continuous electrocardiogram and blood pressure monitoring are established.
Dobutamine infusion is begun at a dose of 5 (or 10) µg/kg/min.
The infusion rate is increased every 3 minutes to doses of 10, 20, 30, and 40 µg/kg/min.
The echocardiogram, electrocardiogram, and blood pressure are monitored continuously.
Low-dose images are acquired at either 5 or 10 µg/kg/min (at the first sign of increased contractility).
Atropine in aliquots of 0.5 to 1.0 mg can be given during the mid- and high-dose stages to augment the heart rate response.
Middose images are acquired at either 20 or 30 µg/kg/min.
Peak images are acquired before termination of the infusion.
Poststress images are recorded after return to baseline.
The patient is monitored until he or she returns to baseline status.
Table 17.4 End Points and Reasons to Terminate the Dobutamine Infusion during Stress Testing
Exceeding target heart rate of 85% age-predicted maximum
A decrease in systolic blood pressure > 20 mm Hg from baselinec
Arrhythmias such as atrial fibrillation or nonsustained ventricular tachycardia
Limiting side effects or symptoms
a Decision may depend on clinical status of the patient and presence/extent of wall motion abnormality.
b Decision may depend on clinical status of the patient and extent/severity of the wall motion abnormality.
c Decision may depend on clinical status and left ventricular function and/or outflow tract gradient.
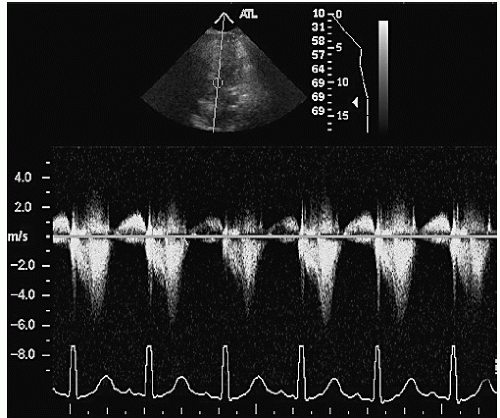
The test may be terminated when one of several end points are reached (Table 17.4). Although such guidelines are essential, the decision to terminate the dobutamine infusion must be individualized. The ability to monitor wall motion is critically important to that decision. For example, atypical symptoms not associated with objective evidence of ischemia (i.e., a new wall motion abnormality) are not necessarily a reason to stop the test. A subtle or limited wall motion abnormality, particularly if well tolerated, also does not mandate termination. To assess the true extent of coronary disease, it is often prudent to continue the test under close monitoring. A decrease in blood pressure is sometimes an indication of extensive ischemia. During dobutamine infusion, however, hypotension may instead indicate the development of a left ventricular outflow tract gradient, and this can be easily recognized using Doppler imaging (Fig. 17.8). Finally, electrocardiographic evidence of ischemia is less reliable during dobutamine infusion than it is during exercise testing. Thus, neither ST-segment depression nor elevation occurring in the absence of a wall motion abnormality or typical symptoms is sufficient reason for terminating the dobutamine infusion.
FIGURE 17.8. An example of an induced left ventricular outflow tract gradient during dobutamine stress testing. This occurred in a patient with severe left ventricular hypertrophy who developed hyperdynamic wall motion at peak stress. Note the late peaking Doppler gradient.
The safety of dobutamine stress echocardiography has been examined in several series. Because of the short half-life of dobutamine, inducible ischemia can be readily reversed through termination of the infusion. In severe cases or when the ischemic manifestations persist, a short-acting intravenous beta-blocker (such as metoprolol or esmolol) is effective. In one series of 1,118 patients referred for dobutamine stress echocardiography, there were no incidents of death, myocardial infarction, or sustained ventricular tachycardia or fibrillation (Mertes et al., 1993). The most common side effects associated with dobutamine infusion were minor arrhythmias such as premature ventricular contractions and atrial arrhythmias and minor symptoms such as palpitations or anxiety. Nonsustained ventricular tachycardia was seen in 3% of patients and was not a specific marker of coronary artery disease. Rare isolated serious complications have been reported.
There are no absolute contraindications to dobutamine stress testing. Unstable patients, such as those with uncompensated heart failure for unstable angina, should rarely be subjected to stress testing of any kind. Dobutamine echocardiography has been safely performed in patients with recent myocardial infarction, extensive left ventricular dysfunction, abdominal aortic aneurysm, syncope, aortic stenosis, hypertrophic cardiomyopathy, history of ventricular tachycardia, and aborted sudden death. In each instance, the value of the expected diagnostic information must be balanced with the individualized risk to the patient. Unlike dipyridamole, dobutamine can be safely used in patients with bronchospastic lung disease.
Dipyridamole and Adenosine
Potent vasodilators such as dipyridamole and adenosine have been used in conjunction with echocardiography for the detection of coronary artery disease. Unlike dobutamine, these agents work by creating maldistribution of blood flow, that is, by preventing the normal increase in flow in areas supplied by stenotic coronary arteries. In more extreme cases, flow may actually be diverted away from abnormal regions (so-called coronary steal), resulting in true ischemia. Adenosine is a potent and short-acting direct coronary vasodilator. Dipyridamole is slower acting and its effects result from inhibition of adenosine uptake. With both agents, the development of a wall motion abnormality is predicated on the ability to create sufficient maldistribution of regional blood flow to result in an ischemia-induced wall motion abnormality. Compared with dobutamine, these changes tend to be more subtle and short-lived.
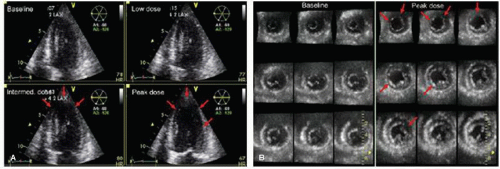
FIGURE 17.9. A three-dimensional dobutamine stress echocardiogram is presented using two different display formats. A: On the left, using multiplane mode, orthogonal apical views are displayed. At mid and peak dose, an apical and lateral wall motion abnormality is indicated by the red arrows.B: On the right, the same stress echocardiogram is displayed using multislice mode in which nine parallel short-axis views are simultaneously presented. At peak dose, multiple wall motion abnormalities are apparent, including the apical and anterolateral region, as well as the inferoposterior region. There is also evidence of left ventricular dilation. (From Yoshitani H, Takeuchi M, Mor-Avi V, et al. Comparative diagnostic accuracy of multiplane and multislice three-dimensional dobutamine stress echocardiography in the diagnosis of coronary artery disease. Am Soc Echocariogr 2009;22:437-442, with permission.)
The safety of dipyridamole and adenosine echocardiography is well established. However, both agents are substantially less popular compared with dobutamine as a pharmacologic stressor. The primary reason for this relates to the mechanism of action. It is conceivable that redistribution of regional blood flow can occur without an associated wall motion abnormality. Thus, vasodilator stress agents may be better suited to imaging techniques that rely on relative changes in perfusion rather than the development of a wall motion abnormality. This is the reason that dipyridamole and adenosine have been commonly used with nuclear imaging techniques. It also explains the renewed interest in these agents as contrast echocardiography gains support.
Three-dimensional Stress Echocardiography
The application of real-time three-dimensional imaging to stress echocardiography is now feasible and is growing in popularity. A full volume data set can be acquired and then sliced and displayed in variety of views. For example, a series of parallel short-axis scans can be derived and analyzed (called “multislice”). With as many nine short-axis images available for analysis, this approach permits virtually the entire left ventricle to be examined. Alternatively, traditional orthogonal planes can be derived from the volumetric data set, a technique called multiplane imaging. The advantage of this approach is that each plane can be adjusted to ensure that it is properly aligned. These two methods for three-dimensional stress imaging have recently been compared (Yoshitani et al., 2009). Figure 17.9 is an example of a three-dimensional dobutamine echocardiography analyzed using both multislice and multiplane techniques. Although both methods permitted detection of the anteroapical wall motion abnormality, only the multislice images (Fig. 17.9B) demonstrated the inferior ischemia. This study shows the versatility of three-dimensional techniques which should contribute positively to overall accuracy.
Three-dimensional stress echocardiography has several advantages. With treadmill exercise, the acquisition of the entire left ventricle in a single volume shortens postexercise imaging time. Three-dimensional echocardiography also allows a more complete examination of the left ventricle than would be possible with two-dimensional imaging alone. In addition, this approach permits precise alignment and matching of rest and stress views which facilitates detection of subtle abnormalities. Finally, it is well established that three-dimensional echocardiography is a more accurate means of measuring left ventricular volume and ejection fraction. With stress, the ability to compare, for example, left ventricular end-systolic volume before and after exercise has both diagnostic and prognostic utility and this determination has been improved through the use of three-dimensional imaging. The major limitation of three-dimensional stress echocardiography continues to be image quality. In addition, frame rate on some systems remains suboptimal, in some cases as low as 16 volumes/sec. As technology continues to improve, these technical issues should become less of a problem, allowing this modality to develop as a practical approach to stress echocardiography.
Choosing among the Different Stress Modalities
The wide range of choices in stress testing has the potential to create confusion for the clinician trying to select the optimal test for any given patient. Is the stress test necessary? Is any form of imaging required? Which stress modality is better: exercise or pharmacologic? What type of exercise works best with a given form of imaging? Although some of these decisions must be individualized, general guidelines can be provided. It is well established that all forms of imaging increase the accuracy of stress testing, particularly in those patients who have had or are likely to have a nondiagnostic stress electrocardiogram (ECG). Imaging also provides information on the location and extent of disease, contributing both to the diagnostic and prognostic value of the test. General guidelines for choosing among the various modalities are provided in Table 17.5.
For most patients, exercise is the preferred form of stress, provided the patient is capable of adequately performing either treadmill or bicycle exercise. The additional information available during an exercise stress test provides most of the advantage over pharmacologic testing. When compared in the same group of patients, exercise has generally been a more sensitive test for the detection of coronary disease compared with dobutamine. However, the superiority of exercise is modest and has not been a universal finding. In most clinical situations, exercise is preferred for the reasons listed previously. An exception to this general rule is when myocardial viability is an issue. In such cases, pharmacologic stress testing with dobutamine is preferred. Thus, dobutamine stress echocardiography is generally limited to patients who are unable to exercise adequately or to specifically address the question of viability.
Table 17.5 Comparison of the Different Stress Methodologies in Various Clinical Situations
Clinical Question
Treadmill
Bicycle
Dobutamine
Chest pain evaluation
++
++
+
Postmyocardial infarction risk
++
++
++
Viability
−
−
++
Evaluation of dyspnea/fatigue
++
++
−
Preoperative risk assessment
+
+
++
Severity of valve disease
−
++
−
Pulmonary hypertension
−
++
−
When nonexercise stress is deemed necessary and echocardiography is the imaging modality, the weight of evidence and the general experience support the use of dobutamine as the stress agent. Because dobutamine is more likely to cause true ischemia rather than merely a flow mismatch, the induction of a wall motion abnormality, detectable with echocardiography, is more likely. For the induction of a perfusion abnormality, both vasodilators and dobutamine have been employed. One recent study (Kowatsch et al., 2007) suggested that dobutamine was equivalent to adenosine for induction of perfusion abnormalities that could be detected with echocardiography. However, because dobutamine is superior to vasodilators for inducing wall motion abnormalities and perhaps equivalent for creating perfusion mismatch, it is likely that dobutamine will remain the preferred pharmacologic stressor for the near future.
Among the various forms of exercise echocardiography, both bicycle and treadmill techniques have been used successfully and are safe and well tolerated. Bicycle exercise has as its primary advantage the opportunity to image throughout exercise. The larger general experience with treadmill stress testing and the comfort that most clinicians have with the methodology and information available during a treadmill test must also be considered. Few studies have directly compared treadmill and bicycle exercise. In one series (Badruddin et al., 1999), in which treadmill exercise and supine bicycle exercise were performed in random order on 74 patients with suspected coronary disease, the bicycle technique was found to be slightly more sensitive, whereas treadmill exercise was slightly more specific. Although mean exercise duration was considerably longer for bicycle exercise, overall workload, expressed as double product, was similar for the two tests. When an ischemic wall motion abnormality was induced, the extent of the defect was greater with bicycle exercise, most likely because imaging was performed during rather than after stress. Thus, both the treadmill and the bicycle are acceptable forms of stress when echocardiographic imaging is used. Methods that permit imaging during exercise may allow both the presence and the extent of disease to be more accurately determined. These advantages must be balanced by patient preference, exercise ability, and the availability of other types of diagnostic and prognostic data.
Interpretation of Stress Echocardiography
Most stress echocardiograms are analyzed on the basis of a subjective assessment of regional wall motion, comparing wall thickening and endocardial excursion at baseline and during stress. The rest or baseline echocardiogram is first examined for the presence of global systolic dysfunction or regional wall motion abnormalities (Table 17.1). The presence of baseline wall motion abnormalities suggests previous myocardial infarction. Other less likely possibilities include stunned or hibernating myocardium or a form of focal cardiomyopathy. Subtle abnormalities at baseline, such as hypokinesis of the inferior wall, may occur in the absence of coronary artery disease and represent a cause of false-positive results. Interventricular septal motion may be specifically altered in the presence of left bundle branch block, the postoperative state, ventricular pacing, or pressure or volume overload of the right ventricle.
Table 17.6 Combination of Rest and Stress Wall Motion Responses
Rest
Stress
Interpretation
Normal
Hyperkinetic
Normal
Normal
Hypokinetic/akinetic
Ischemic
Akinetic
Akinetic
Infarction
Hypokinetic
Akinetic/dyskinetic
Ischemic and/or infarction
Hypokinetic/akinetic
Normal
Viable
Regardless of the form of stress, the normal response is the development of hyperdynamic wall motion (Table 17.6 and Fig. 17.10). Although this is generally true, some heterogeneity may be expected and not all left ventricular segments will necessarily display the same degree of hypercontractility. When examined quantitatively, this variability in the normal response is apparent and even mild hypokinesis may be present in normal subjects. Despite this caveat, a global increase in contractility should still be regarded as the normal response. Lack of hyperkinesis is abnormal and is most often caused by the development of regional myocardial ischemia. Other factors may also affect the ability to develop hyperkinesis. These include the presence of a nonischemic cardiomyopathy, treatment with beta-blocker agents, certain valve diseases, left bundle branch block, and severe hypertension. In addition, submaximal exercise resulting in attainment of a low workload is often associated with the absence of a hyperkinetic response. If postexercise imaging is performed after treadmill exercise, an excessive delay in image acquisition may miss the transient hyperkinesis and lead to a misinterpretation.
A limitation of this approach to interpretation is the subjective and nonquantitative nature of wall motion analysis. Several studies have examined the reproducibility of subjective wall motion scoring. In general, experienced interpreters agree in the majority of cases, and overall accuracy is reasonable. More quantitative and objective approaches, however, would have obvious advantages. Historically, such attempts have been limited by image quality and translational motion. In addition, the complexity and time-consuming nature of some methods greatly limited their acceptance. Calculation of the ejection fraction at rest and during stress, for example, is fraught with technical challenges and rarely performed in routine practice. A more practical approach involves the estimation of left ventricular volume changes during stress. The normal response to stress includes a decrease in both end-systolic and end-diastolic volume that can be visually appreciated using side-by-side inspection of images. Failure of the ventricular size to decrease is an abnormal response. An increase in volume with stress often indicates severe and extensive (i.e., multivessel) disease. Although this is generally done by subjective analysis of chamber volume, one study (Yao et al., 2007) quantified the normal and abnormal range of left ventricular volume change during stress. A normal response was defined as a 25% to 30% decrease in volume (both end-systolic and end-diastolic) from baseline to peak stress. An increase in volume from rest to stress of more than 17% was found to be the best threshold to define an abnormal volume response, based on an increased likelihood of cardiac events. This degree of stress-induced ventricular dilation was a sensitive indicator of severe coronary disease and an increased risk of events. Both end-systolic and end-diastolic volume changes were similarly predictive. An example of this phenomenon is provided in Figure 17.11. In this case, apical dilation was due to a severe stenosis of the proximal left anterior descending coronary artery.
FIGURE 17.10. An example of a normal treadmill exercise echocardiogram, demonstrating a hyperdynamic response to stress, is provided. The resting study is on the left and postexercise images are on the right. Mild left ventricular hypertrophy is present.
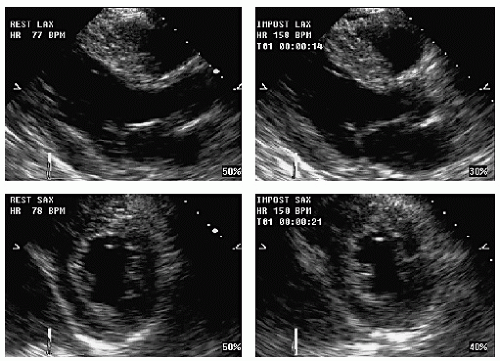
Supine bicycle exercise is an exception to this rule. With this form of stress, elevation of the legs increases venous return throughout exercise so that left ventricular dilation at peak exercise may be a normal finding. Once exercise stops, the cavity usually will rapidly decrease in size. Figure 17.12 is an example of an abnormal volume response in a patient with extensive coronary disease. Note the increase in left ventricular systolic dimension, especially in the four-chamber view. The right ventricle also dilates, in this case, due to proximal right coronary artery ischemia.
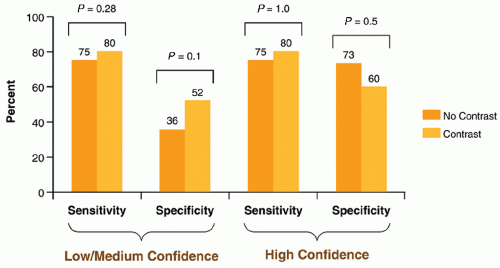
When image quality is suboptimal, wall motion analysis can be augmented through the use of contrast agents that improve endocardial border definition and increase both the confidence and the accuracy of diagnosis. In general, when two or more left ventricular segments are not seen on the resting study, use of contrast should be considered. The contrast can be delivered either as intermittent boluses of a diluted solution or as a continuous infusion. Using low mechanical index (less than 0.5) imaging, border delineation is improved and both wall thickening and endocardial excursion are better evaluated. Figure 17.13 demonstrates endocardial definition with the use of contrast, allowing an extensive area of apical ischemia to be accurately identified. In a randomized, crossover single-center study (Plana et al., 2008), the use of contrast during dobutamine stress echocardiography increased the percentage of interpretable segments, both at baseline and with stress. This led to an increase in overall accuracy and a higher level of confidence in interpretation (Fig. 17.14).
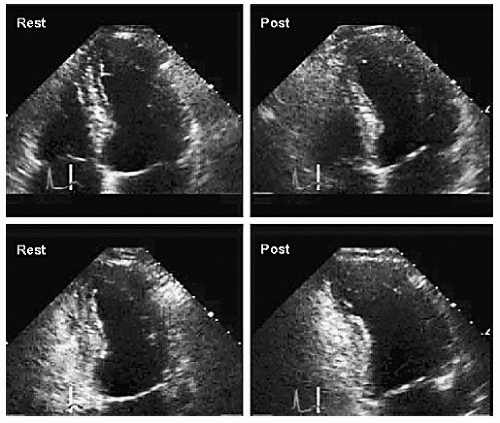
FIGURE 17.11. This treadmill exercise echocardiogram demonstrates an abnormal left ventricular volume response to stress. The resting study is normal. Postexercise, there is evidence of anteroseptal, apical, and lateral ischemia, resulting in dilation of the left ventricle.
FIGURE 17.12. This treadmill exercise echocardiogram demonstrates an abnormal left ventricular volume response. These frames were taken at end-systole (right). (Resting images on the left.) The postexercise images demonstrate a larger end-systolic volume compared with baseline, suggesting chamber enlargement in response to stress.
To provide a more quantitative approach, strain rate imaging has been applied to stress echocardiography. This approach relies on tissue Doppler imaging or speckle tracking to quantify myocardial deformation in response to applied stress. Strain is simply the change in length of a segment of tissue that occurs when force is applied. Strain rate is the first derivative of strain or how strain changes over time. When assessed using the Doppler technique, strain rate can be measured as the difference in velocity between two points normalized for the distance between them. Speckle tracking depends on being able to identify a small region of tissue, based on its unique acoustic signature, and then track that region as it moves throughout the cardiac cycle. Strain is derived by simultaneously tracking the displacement of adjacent regions and quantifying small changes in distance. This approach relies on B-mode imaging, rather than Doppler, so it is not angle-dependent. Regardless of how it is derived, strain is a three-dimensional phenomenon. When evaluated in two dimensions, it is defined as having three components: longitudinal strain occurs parallel to the long axis of the chamber, circumferential strain is parallel to the short axis, and radial strain is perpendicular to the endocardial and epicardial surfaces.
FIGURE 17.13. This is an example of a technically difficult treadmill exercise echocardiogram. Endocardial definition on the noncontrast-enhanced study was poor. With the addition of contrast, endocardial definition improved. In this case, the four-chamber (top) and two-chamber (bottom) views are shown following contrast administration. The resting study is normal. The postexercise images demonstrate extensive apical ischemia and dilation.
Strain and strain rate have been examined as objective, quantifiable markers of ischemia during stress testing. Experimental studies have shown that strain is affected early in the course of ischemia and therefore could be a more sensitive marker of disease. One approach involves determining the myocardial velocity gradient, which is the difference between the systolic velocities of the endocardium versus the epicardium (normalized for wall thickness). Normally, the endocardium has a higher velocity than the epicardium, and this difference is frequently diminished with ischemia. Another approach relies on the delay in systolic shortening, sometimes called postsystolic shortening, that may occur with ischemia. This phenomenon is probably the equivalent of regional asynchrony or tardokinesis, both of which have been described as abnormal wall motion responses to stress.
FIGURE 17.14. The use of contrast to improve endocardial border definition has an impact on the sensitivity and specificity of the test. The left panels demonstrate the effect of contrast on sensitivity and specificity in those studies grouped by confidence of interpretation of the unenhanced images. A trend toward improved specificity is demonstrated. On the right, in those studies in which the interpreter was confident based on the unenhanced image, contrast added no additional benefit with respect to accuracy. (From Plana JC, Mikati IA, Dokainish H, et al. A randomized cross-over study for evaluation of the effect of image optimization with contrast on the diagnostic accuracy of dobutamine echocardiography in coronary artery disease. J Am Coll Cardiol Imaging 2008;1:145-152, with permission.)
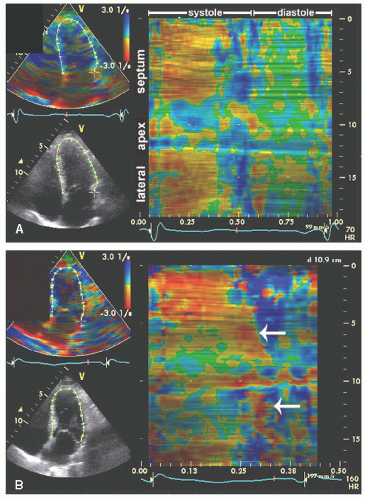
Using modern equipment, strain can now be derived automatically and simultaneously from multiple areas with the heart. The potential to identify and even quantify such subtle manifestations of ischemia is an attractive feature of strain rate imaging. The theoretic advantages of strain and strain rate imaging include a relative independence of translational motion and tethering, its inherently quantitative nature, the ability to distinguish active from passive motion, and the potential to examine wall motion throughout the cardiac cycle. Although more work is needed to validate the utility and accuracy of strain rate imaging during stress echocardiography, preliminary studies have been encouraging. Figure 17.15 shows two examples of strain rate imaging during exercise stress testing. This display technique uses curved M-mode to track changes in midwall strain rate around the circumference of the left ventricle. Location is on the vertical axis and time is plotted along the horizontal axis. The colors then correspond to levels of strain rate. In the example, the resting study is from a normal subject. The postexercise study, taken from a patient with coronary artery disease, demonstrates abnormal systolic strain in the apical region with postsystolic shortening.
FIGURE 17.15. Strain rate imaging can be applied to stress echocardiography. A: The resting four-chamber view demonstrates a normal strain pattern in all areas throughout the cardiac cycle. Changes in color correspond to changes in strain rate with they-axis indicating location and the x-axis indicating time over the cardiac cycle. Color changes in the apex are the result of the angle between the Doppler beam and the wall. B: Postexercise (from a different patient), apical postsystolic shortening is indicated by the arrows. This manifestation of ischemia is difficult to appreciate on wall motion analysis.
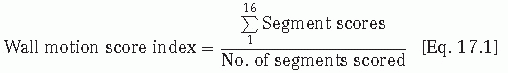
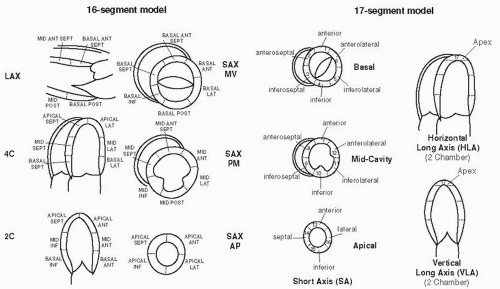
Several schemes for interpreting and reporting stress echocardiographic results are in clinical use. One approach divides the left ventricle into 16 segments (Fig. 17.16, left) and then grades each segment on a scale from 1 to 4 in which 1 is considered normal, 2 indicates hypokinesis, 3 indicates akinesis, and 4 corresponds to dyskinesis. Wall motion is analyzed at baseline, and a wall motion score index is generated according to the formula:
A 17-segment model, which includes an apical cap, is another option and has the advantage of being more compatible with most nuclear imaging schemes (Fig. 17.16, right). Both of these schemes have been endorsed by the American Society of Echocardiography. A similar approach is then taken for analysis of wall motion during stress. In this case, the development of hyperkinesis is assumed to be normal and assigned a score of 1. Thus, a normal study would be associated with a wall motion score index of 1.0 at both baseline and stress. Any score greater than 1.0 would indicate the presence of an abnormality. An increase in score would indicate either an increase in the extent and/or the severity of a wall motion abnormality. An example of wall motion scoring of a stress echocardiogram is provided in Figure 17.17. This approach has several advantages. It provides a systematic approach to wall motion analysis and encourages a thorough and standardized approach. Furthermore, it acknowledges the subjectivity of wall motion analysis but provides a quantitative reporting scheme that allows studies to be compared. The prognostic value of wall motion score index has been demonstrated in several studies.
Categorization of Wall Motion
Hypokinesis is the mildest form of abnormal wall motion. It is defined as the preservation of some degree of thickening and inward motion of the endocardium during systole but less than normal. It has been defined arbitrarily as less than 5 mm of endocardial excursion. The distinction between normal wall motion and hypokinesis is subtle, particularly in the setting of advanced age or beta-blocker therapy. Hypokinesis is most likely to be truly abnormal if it is limited to a region or territory that corresponds to the distribution of one coronary artery and is associated with normal (or hyperdynamic) wall motion elsewhere. One particular form of hypokinesis is tardokinesis, which is used to describe delayed inward motion or thickening. Analyzing wall motion frame by frame or trimming a cine loop to include only the first half of systole will help identify tardokinesis and distinguish it from other wall motion responses. Akinesis is defined as the absence of systolic myocardial thickening and endocardial excursion. Bear in mind that translational motion of the heart during systole can create the illusion of akinesis. However, wall thickening is less translation dependent and should be relied on in such cases. Dyskinesis is the most extreme form of a wall motion abnormality and is defined as systolic thinning and outward motion or bulging of the myocardium during systole. A left ventricular segment that is thin and/or highly echogenic indicates the presence of scar. Other less common wall motion responses have also been recognized. For example, early relaxation is used to describe a segment that appears to contract in early systole and then relaxes or dilates earlier than the other walls. It is a common cause of false-positive results because it is most likely a normal variant and not associated with ischemia.
FIGURE 17.16. Analysis of stress echocardiograms should include regional wall motion assessment. This entails dividing the left ventricle into regions that can be analyzed either from parasternal or from apical views. On the left, the standard 16-segment model is demonstrated. On the right, a slightly different approach to segmentation involves the 17-segment model in which the apical cap is analyzed separately in the four-chamber and two-chamber views.
Summary:
Abnormal stress echo. Resting wall motion abnormalities, involving the apex and inferior walls. Worse with stress. New wall motion abnormalities involving the septum and apex.
CONCLUSIONS:
Evidence of prior MI with mild rest wall motion abnormalities, induced ischemia of the septum and apex.
FIGURE 17.17. An example of a stress echocardiographic report is provided, including a regional wall motion scoring summary. LVSI, left ventricle score index; %FM, percentage of normally functioning segments; LAD, left anterior descending; LCX, left circumflex; MI, myocardial infarction; RCA, right coronary artery. See text for details.
Again, trimming the cine loop to include only the first half of systole is a useful way to identify early relaxation and differentiate it from truly abnormal wall motion.
Wall Motion Response to Stress
By comparing wall motion at baseline and during stress, valuable diagnostic information is available (Table 17.6). Wall motion that increases or augments during stress is generally considered normal. The development of a wall motion abnormality during stress in an area normal at rest is most suggestive of ischemia. Segments that are abnormal at rest and remain unchanged with stress are generally best interpreted as showing evidence of infarction without additional ischemia. Hypokinetic areas that worsen during stress are usually labeled ischemic. These may represent a combination of previous nontransmural infarction and induced ischemia. Segments that are akinetic or dyskinetic at baseline, even if wall motion worsens during stress, are best interpreted as indicating infarction, and the ability to detect additional ischemia in such segments is limited. Occasionally, wall motion appears normal at rest and is unchanged with stress, that is, neither hyper- nor hypokinetic. Some readers consider this abnormal and report it as an ischemic response. Although this may be the case, it is also the cause of many false-positive findings. Bear in mind that lack of hyperkinesis has multiple etiologies, including low workload, delayed postexercise imaging, beta-blockade, and cardiomyopathy. Elderly patients, especially women, may be unable to manifest a frankly hyperkinetic response. Therefore, to minimize false-positive results, consider these other possibilities before interpreting lack of hyperkinesis as an ischemic end point. A marked increase in blood pressure during exercise can also prevent the development of hyperkinesis or even result in global hypokinesis. An example of such a response is provided in Figure 17.18. Despite an adequate level of exercise and an appropriate heart rate response, the peak-exercise views are unchanged or, in some areas, mildly hypokinetic. This was due to a marked increase in blood pressure during exercise.
Finally, segments abnormal at baseline that improve with stress are uncommon and represent a special category. During exercise testing, these most likely indicate either a normal response or a localized abnormality in which the improvement is due to tethering from the surrounding normal myocardium. With dobutamine, however, improvement may indicate viability and the potential for recovery after revascularization. This topic is covered later in this chapter.
FIGURE 17.18. This exercise echocardiogram was performed in a patient who developed marked hypertension in response to exercise. The significant increase in blood pressure resulted in mild global hypokinesis. Failure to develop hyperdynamic wall motion is an abnormal response but in this case was due to afterload mismatch.
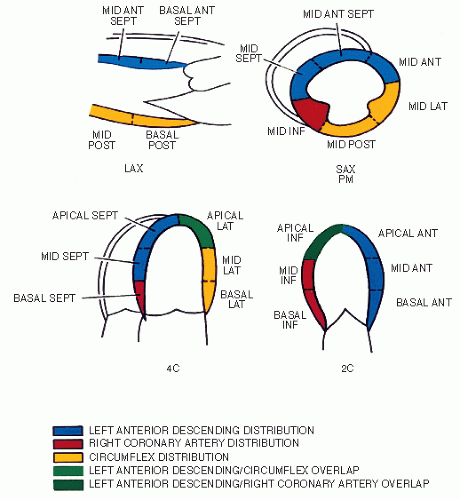
FIGURE 17.19. This schematic demonstrates the relationship between the coronary artery distribution and the corresponding left ventricular segments. With the four standard views, the territories of each of the main coronary arteries can be evaluated, as defined by the color scheme. Areas of overlap are indicated in green.
Localization of Coronary Artery Lesions
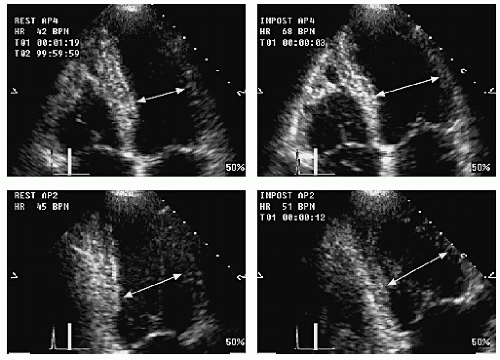
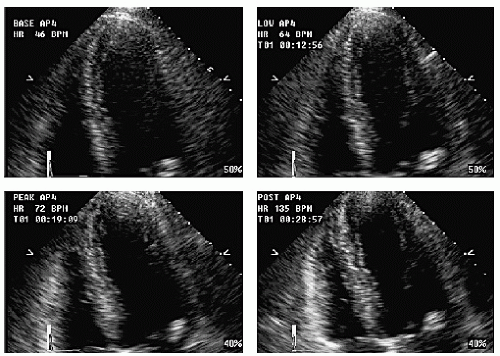
A practical application of stress echocardiography is to predict the presence of disease in specific coronary arteries or branches (Fig. 17.19). The relationship between left ventricular segments or territories and the corresponding artery distribution is covered in Chapters 6 and 16. A similar approach is applied to stress echocardiography. By recording the left ventricle in multiple views, an evaluation of the territories of each of the three main coronary arteries is possible. This allows a prediction of both the location and the extent of disease to be made on the basis of wall motion. In general, stress echocardiography is more sensitive in patients with multivessel disease compared with single-vessel disease and more accurate for specifically identifying disease in the left anterior descending artery or right coronary artery compared with the left circumflex artery. Because of the variability in coronary artery distribution, accurate differentiation between lesions of the right coronary artery and left circumflex artery is not always possible. Figure 17.20 is an example of localized apical ischemia induced during dobutamine echocardiography. Wall motion is normal at the 20 µg/kg/min stage (heart rate, 72 bpm), but apical dyskinesis develops at the next stage, associated with a much higher heart rate. Figure 17.21 shows inferior ischemia in a patient with no prior history of heart disease. At baseline, wall motion is normal. With stress, the inferior wall becomes severely hypokinetic, with reduced thickening. In Figures 17.22 and 17.23, multivessel ischemia is demonstrated. In both, bicycle exercise echocardiography demonstrates multiple wall motion abnormalities induced in the setting of normal resting function. Figure 17.24 is an example of extensive anteroapical and lateral ischemia during treadmill exercise. This occurred in the setting of left anterior descending and circumflex coronary disease.
FIGURE 17.20. An example of an abnormal dobutamine stress echocardiogram. The fourchamber view is shown and demonstrates apical and lateral ischemia. The abnormality is apparent only at peak stress (lower right quad).
FIGURE 17.21. This is an example of inferior ischemia in a patient with no prior history of heart disease. The resting study is normal. The patient exercised to a high workload on the treadmill. Postexercise, there is an inferior wall motion abnormality that can be seen in the short-axis and two-chamber views. On coronary angiography, there was a significant lesion on the mid right coronary artery.
FIGURE 17.22. This exercise echocardiogram demonstrates multivessel ischemia involving the inferior, lateral, and apical segments. Extensive ischemia developed despite a modest heart rate response. In addition, note the akinesis of the right ventricular free wall due to proximal right coronary artery disease.
FIGURE 17.23. This bicycle exercise echocardiogram demonstrates multivessel ischemia involving the apex, septum, and inferior wall.
Correlation with Symptoms and Electrocardiographic Changes
It should be apparent that the analysis of the stress echocardiogram is only one component of the comprehensive stress test and that the other parameters, including the development of symptoms and/or ECG changes, cannot be ignored. In virtually every study that has examined the question, wall motion has been shown to be more sensitive and specific than either symptoms or ST-segment changes for the detection of coronary artery disease. In most instances, there is concordance among the various parameters that define ischemia. When a patient experiences typical chest pain in association with ECG and wall motion abnormalities, the diagnosis is straightforward. When results are discordant, however, certain assumptions must be made. Because wall motion is such a sensitive and specific marker of ischemia and because of the limitations in interpreting symptoms and ECG changes, the final report generally relies most heavily on the echocardiographic findings. In fact, one of the most common indications for stress echocardiography is to assess symptoms in patients who have had or would likely have an abnormal or nondiagnostic stress ECG. This would include patients with an abnormal ECG or left ventricular hypertrophy, and even women. In such cases, when the ECG is nondiagnostic, the added cost and inconvenience of imaging are most easily justified.
Only gold members can continue reading. Log In or Register to continue