Specialized Echocardiographic Techniques and Methods
The basic principles of interaction of ultrasound with tissue and blood and the basic mechanisms by which an image is created were discussed in Chapter 2. Echocardiography consists of several imaging “domains” or acquisition methodologies. The commonly used clinical imaging domains are listed in Table 3.1. Each of these ultrasound methodologies has specific strengths and weaknesses, and there are established clinical questions for which one technique may play a unique or predominant role. Each imaging modality uses the same basic principle of reflection of ultrasound to register data, conveying information regarding the presence and location of a reflective boundary or the direction and velocity of a moving target such as red blood cells or tissue.
Imaging Devices and Methods
M-Mode Echocardiography
The earliest ultrasound image was obtained using a single interrogation beam from a dedicated transducer. Basically, ultrasound energy is sent out from the transducer as an ultrasound packet that is then reflected back to the transducer. Transmission of ultrasound from the transducer is not continuous but rather interrupted, with the nontransmit time being used to receive the signal. When used in this method and directed into the thorax, the ultrasound along the single line of interrogation is reflected from cardiac structures and registered as a series of reflective interfaces. If the location and strength of these interfaces are then plotted over time, typically by recording the continuous returning signal on a strip-chart recorder or scrolling video screen, an M-mode echocardiogram is recorded (Fig. 3.1). The term M-mode refers to “motion” that is derived from the time component. Some older references referred to this methodology as time-motion mode (T-M mode). Because M-mode echocardiography interrogates only along a single line, it is not a comprehensive anatomic screening method. Another limitation is that the true orientation of the beam with respect to accurate cardiac anatomy is often not known if a stand-alone transducer is used. Advantages of M-mode interrogation include high temporal resolution (1,000-3,000 Hz compared to 20-120 Hz for two-dimensional echocardiography). Additionally, the spatial resolution along the single line of interrogation is higher than that of two-dimensional echocardiography. This was of clinical relevance when using earlier-generation two-dimensional ultrasound devices. Current devices using harmonic imaging or high-frequency transducers provide spatial resolution clinically equivalent to that available from M-mode echocardiography. They do not, however, provide the temporal resolution of M-mode echocardiography, which is suited to identifying brief, rapid, or fine oscillatory motion, such as that seen with mitral valve diastolic flutter in patients with aortic insufficiency, aortic valve systolic notching in dynamic outflow obstruction, and subtle abnormalities of wall motion as seen in conduction disturbances.
Table 3.1 Imaging Domains for Clinical Echocardiography | ||||||||||||||||||||||||||||||||||||||||||||||||||||||||||||||||||||||||||||||||||||||||||||||||||||
|---|---|---|---|---|---|---|---|---|---|---|---|---|---|---|---|---|---|---|---|---|---|---|---|---|---|---|---|---|---|---|---|---|---|---|---|---|---|---|---|---|---|---|---|---|---|---|---|---|---|---|---|---|---|---|---|---|---|---|---|---|---|---|---|---|---|---|---|---|---|---|---|---|---|---|---|---|---|---|---|---|---|---|---|---|---|---|---|---|---|---|---|---|---|---|---|---|---|---|---|---|
| ||||||||||||||||||||||||||||||||||||||||||||||||||||||||||||||||||||||||||||||||||||||||||||||||||||
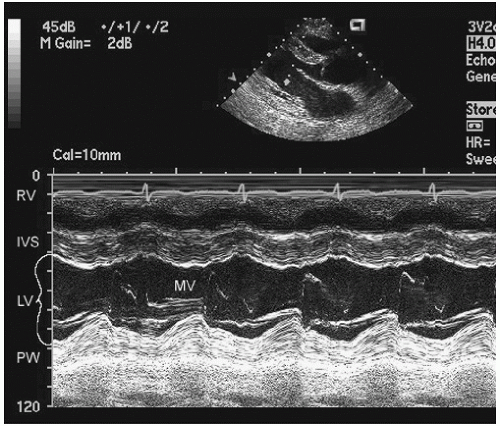 FIGURE 3.1. M-mode echocardiogram recorded through the left ventricle at the level of the mitral valve tips. IVS, interventricular septum; MV, mitral valve; PW, posterior wall. |
Two-dimensional Echocardiography
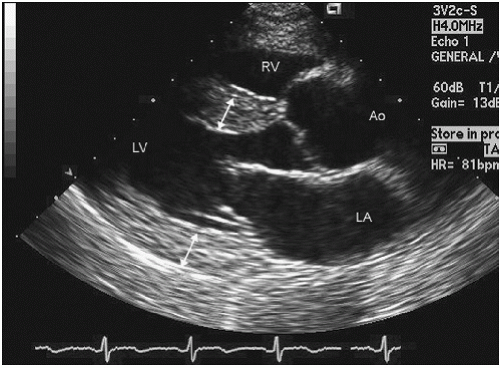
Two-dimensional echocardiography provides an expanded view of cardiac anatomy by imaging not along a single line of interrogation but along a series of lines typically spanning a 90° arc (Fig. 3.2). Any of the additional domains of imaging such as M-mode and Doppler can be simultaneously performed and superimposed on the two-dimensional image or otherwise simultaneously displayed.
Color B-Mode Scanning
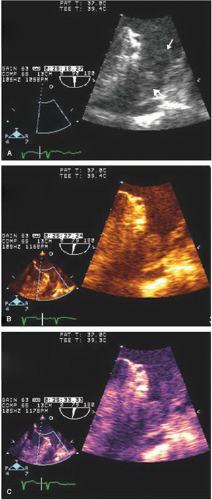
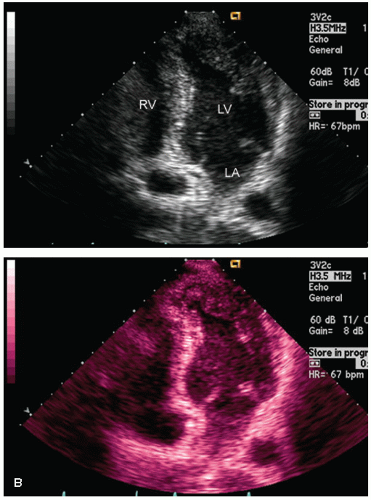
For routine two-dimensional imaging (B-mode), the image typically is displayed in gray scale. Although first-generation scanners were limited to 16 shades of gray and later scanners to 64 shades, current instruments display 256 shades of gray. This degree of gray-scale range exceeds the eye’s ability to discern differences. An alternate mode of display is to convert the gray-scale assignments to a range of color or hue within a color (color B-mode) (Figs. 3.3 and 3.4). Studies have suggested that this may enhance detection of subtle soft-tissue density targets. This display format has seen most acceptance in display of spectral Doppler signals and of three-dimensional echocardiographic images, where hue may be used to denote depth.
Doppler Interrogation
Whereas two-dimensional structural imaging relies on analysis of the time of transit and intensity of a returning ultrasound signal to identify an anatomic structure, Doppler interrogation relies on analysis of a change in the frequency of the transmitted ultrasound. Initially, this was displayed as the actual frequency shift. The magnitude of frequency shift is in the kilohertz range. This frequency shift can be converted to velocity of the interrogated target by the Doppler equation. All modern instrumentation provides this computation online, and it is the actual velocities that are displayed rather than frequency shifts. Doppler is used in multiple formats.
The first Doppler format to be used clinically was a spectral display of the returning frequency shifts, which is converted to velocity on all modern clinical scanners. This is typically displayed with reference to a zero crossing line. Any signal above that line represents motion toward the transducer, and any signal below the line represents motion away from the transducer. The magnitude of the frequency shift is related to target direction and velocity by the Doppler equation.
Any of the Doppler methodologies can be simultaneously performed with anatomic two-dimensional imaging by sharing the computational resources of the ultrasound instrument. The spectral Doppler display can then be displayed simultaneously with the two-dimensional image. Early instrumentation did not
have the computational power to perform both of these analyses simultaneously, and anatomic imaging was often suspended during Doppler interrogation. Modern instrumentation can simultaneously display real-time, two-dimensional and Doppler images (Fig. 3.5).
have the computational power to perform both of these analyses simultaneously, and anatomic imaging was often suspended during Doppler interrogation. Modern instrumentation can simultaneously display real-time, two-dimensional and Doppler images (Fig. 3.5).
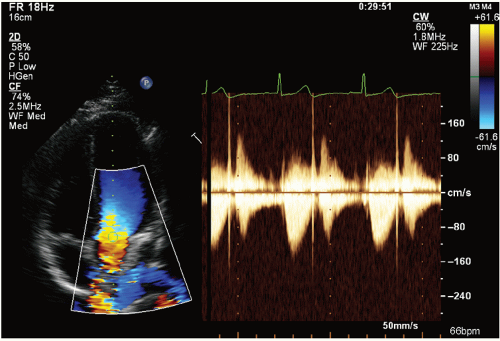 FIGURE 3.5. Continuous wave Doppler of the aortic valve recorded from an apical view with simultaneous color Doppler. |
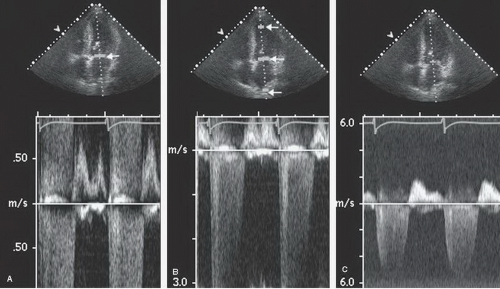
Spectral Doppler is acquired through two different methods, continuous and pulsed wave (Fig. 3.6). As the name implies, continuous wave Doppler imaging continuously transmits and receives the ultrasound signal. Because it is continuously transmitting and receiving, the ability to determine the time of transit is lost and only the frequency shift of the returning signal is calculated. This results in a phenomenon known as range ambiguity, in which the precise velocity of motion can be calculated but not the precise location at which that velocity occurred.
In contrast, pulsed wave Doppler imaging interrogates velocity of motion by way of discrete ultrasound packets sent out at a predefined rate, the pulse repetition frequency. Transmit and receipt timings are employed so that the location from which the frequency shift arises can be calculated from the time of transit. This allows the sample volume to be steered along both its longitudinal and lateral axes. Because sampling is not continuous, there are limitations on the maximal velocity that can be determined, which is related to the pulse repetition frequency. The maximal obtainable velocity is known as the Nyquist limit. Using pulsed wave Doppler imaging, one can obtain a recording of velocity at any specific point within the cardiac anatomy, but the maximal velocity that can be displayed will be limited by the Nyquist limit and defines the total velocity range that can be measured, that is, the sum of velocity in both directions.
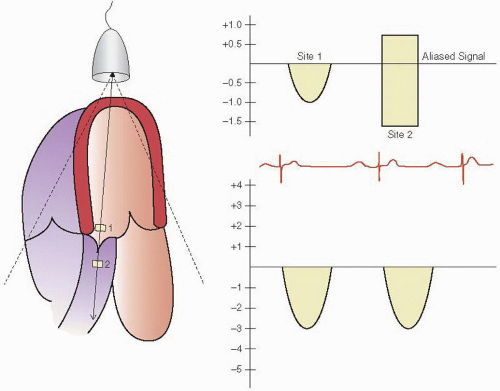
A variation on pulsed wave Doppler imaging is multigate Doppler imaging in which multiple (typically two to five) Doppler interrogation points are simultaneously opened (Fig. 3.7). Interrogation of multiple points effectively increases the pulse repetition frequency and, therefore, the Nyquist limit. It preserves much of the ability to locate the site of the maximal velocity and allows a recording of velocities approaching that seen with continuous wave Doppler imaging. Early instrumentation did not allow simultaneous continuous wave Doppler imaging and two-dimensional imaging and did not allow steering of a continuous wave interrogation beam. Multigate Doppler was initially developed as a solution to this limitation. All current-generation equipment allows simultaneous steerable continuous wave Doppler imaging, and hence the clinical utility and need for multigate Doppler have diminished substantially.
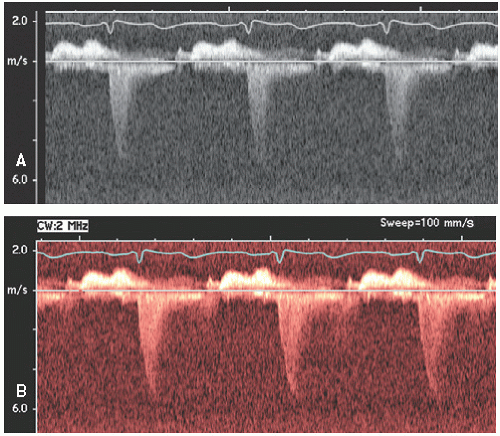
As with two-dimensional imaging, the Doppler spectral display, which is typically displayed as a gray-scale image, can be
displayed in various color hues (Fig. 3.8). This type of processing may make faint spectral signals more easily discernible.
displayed in various color hues (Fig. 3.8). This type of processing may make faint spectral signals more easily discernible.
Color Flow Doppler Imaging
Color flow imaging or color Doppler imaging is a variation of pulsed Doppler imaging and shares all its limitations. The result of this technique is to provide a colorized image representing the velocity and direction of blood flow in a region of interest, superimposed over a real-time, two-dimensional image. The technique has shown tremendous clinical utility for the evaluation of regurgitant valvular lesions and detection of intracardiac shunts. It should be remembered that this is a pulsed Doppler technique and has all the limitations of pulsed Doppler imaging including relatively limited maximal velocities due to a low Nyquist limit. Because of the tremendous number of pulsed Doppler gates that are open simultaneously, color Doppler imaging has a lower frame rate than does two-dimensional structural imaging (typically, 15-30 Hz with a region of interest typically used for mitral regurgitation).
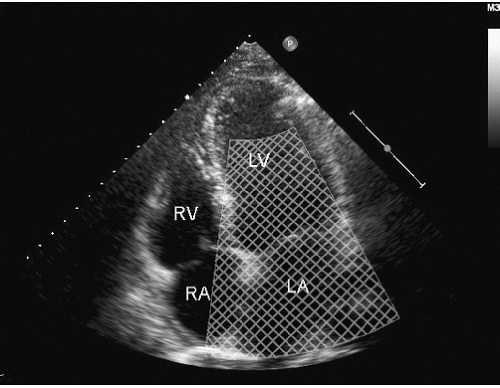
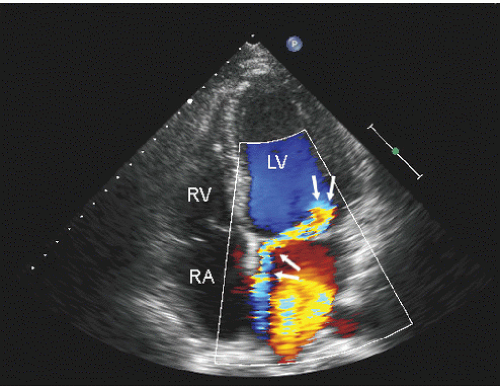
Color flow imaging is obtained by simultaneous assessment of multiple Doppler interrogation regions within an area of interest (Fig. 3.9). In modern scanners, the number of interrogation regions can range to as many as several hundred, depending on the size of the area of interrogation. At each of the interrogation sites, a pulsed Doppler interrogation is performed and analyzed. Rather than display each of these pulsed sample interrogation sites as a spectral display (which obviously is impossible when interrogating several hundred sites simultaneously), the frequency shift at each site is converted into a color and then the pixel at that interrogation site encoded with that color. Traditional color flow maps encode negative velocities (i.e., indicating flow away from the transducer) in varying shades of blue and flow toward the transducer in varying shades of red. Either the intensity or the hue of the individual color is then directly related to the magnitude of the Doppler shift, indicating velocity. Because of a relatively low Nyquist limit (typically <1.0 m/sec), even normal physiologic flow velocities frequently exceed the Nyquist limit and aliasing occurs in which flow may be encoded in its opposite color. The original method for determining the color and hue was to use a look-up table. Because the computational power required to calculate specific color hues is substantial, the computationally less intensive solution of a look-up table in which the anticipated velocities are compared with returning velocities and then matched with a predetermined color is employed. In instances in which there is a threshold level of variance from the look-up table because of mixed velocities, the color is inscribed as a variance reading, typically encoded in orange or yellow. Detection of substantial variance or variation in velocity and direction is a manifestation of turbulent flow, implying a high velocity. These colors are then superimposed over the two-dimensional image and provide a simultaneous assessment of ventricular function and blood flow within the area of interest (Fig. 3.10). There are numerous color flow maps that correspond to the different Doppler domains such as velocity, power, and energy.
Color Doppler M-Mode Imaging
Color Doppler M-mode imaging is a technique in which pulsed Doppler interrogation is done along a single line of
interrogation, analogous to M-mode echocardiography. Unlike M-mode echocardiography, in which the location and intensity of a reflective spectral signal are recorded, the Doppler velocity shift is recorded and then subsequently color encoded and superimposed on the traditional M-mode image (Fig. 3.11). This provides high temporal resolution data regarding the timing and direction of flow events. Because this is a pulsed Doppler technique, velocity resolution is limited as it is with routine color Doppler imaging; however, the single-line interrogation provides a high level of spatial and temporal resolution along the interrogation line. Figure 3.11A is an example of color Doppler M-mode imaging recorded from the apex of the left ventricle. From this imaging position, characteristics of mitral valve inflow can be evaluated. The high temporal resolution of this technique has been used to assist in determining the velocity of propagation of left ventricular inflow (Vp), a marker of diastolic function of the left ventricle. Another clinical instance in which color Doppler M-mode imaging plays a role is in the determination of the width of an aortic insufficiency jet (Fig. 3.11B) and duration of mitral regurgitation.
interrogation, analogous to M-mode echocardiography. Unlike M-mode echocardiography, in which the location and intensity of a reflective spectral signal are recorded, the Doppler velocity shift is recorded and then subsequently color encoded and superimposed on the traditional M-mode image (Fig. 3.11). This provides high temporal resolution data regarding the timing and direction of flow events. Because this is a pulsed Doppler technique, velocity resolution is limited as it is with routine color Doppler imaging; however, the single-line interrogation provides a high level of spatial and temporal resolution along the interrogation line. Figure 3.11A is an example of color Doppler M-mode imaging recorded from the apex of the left ventricle. From this imaging position, characteristics of mitral valve inflow can be evaluated. The high temporal resolution of this technique has been used to assist in determining the velocity of propagation of left ventricular inflow (Vp), a marker of diastolic function of the left ventricle. Another clinical instance in which color Doppler M-mode imaging plays a role is in the determination of the width of an aortic insufficiency jet (Fig. 3.11B) and duration of mitral regurgitation.
Doppler Tissue Imaging
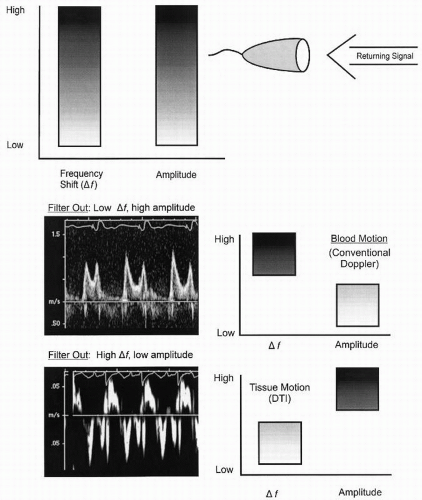
Routine Doppler imaging targets red blood cells and hence the receiver characteristics, including the frequency filters that determine the range of velocities to be interrogated, are set to maximize the shifts anticipated with moving blood and to exclude the velocity shifts that would be seen with slower moving structures. Because red blood cells are relatively weak reflectors and tissue is a fairly intense reflector, filters are also adjusted to exclude highly reflective objects and to maximize less reflective objects when using conventional Doppler (Fig. 3.12). Doppler tissue imaging uses the same principles; however, the target is tissue rather than red blood cells. For this purpose, filters are set to parameters opposite those needed to accurately detect red blood cell motion. Because tissue has a greater reflectivity and slower motion, instrumentation filters are set to exclude high velocities and low-intensity reflectors. With this technique, either the myocardium or the fibrous skeleton of the heart can be targeted and weaker reflections from the higher velocity blood cells relatively excluded.
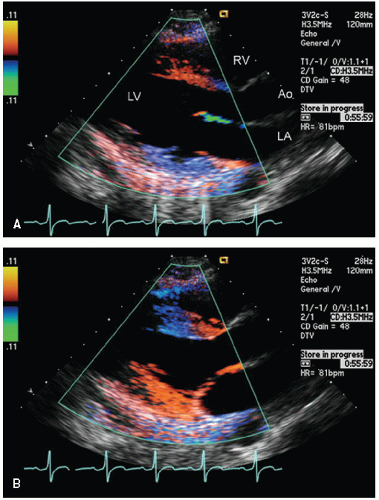
One of the initial applications of this technique was to use color flow imaging display methodology and to saturate an area of interest with Doppler interrogation. The color Doppler signal from the moving tissue was then superimposed on the twodimensional gray-scale image. An example of this use is seen in Figure 3.13. Using traditional blue-red encoding for direction of motion, this results in dissimilar color encoding even when walls are moving at a similar velocity. The normally moving ventricular septum will be encoded in blue (motion away from the transducer), and the normal anterior motion of the posterior wall will be encoded in red. This results in opposite color encoding of opposing walls, each of which has normal directional motion. The color-encoding scheme can be changed to be unidirectional, recording only velocity irrespective of direction, in the same color. This has the disadvantage of encoding a dyskinetic wall with the same color as a normally contracting wall. This technique has substantial potential in that it would allow superimposing information regarding velocity and direction of motion on the anatomic image. It is limited in its applicability by relatively low frame rates and the inability to fully saturate the signal. Other limitations include potential aliasing of the color signal with higher velocity motion and limited registration of velocity information at an angle of incidence (θ) exceeding 30°. Signal-to-noise ratios are typically relatively low, and in poorquality images, there may be substantial bleeding of the color signal from the tissue into the blood pool.
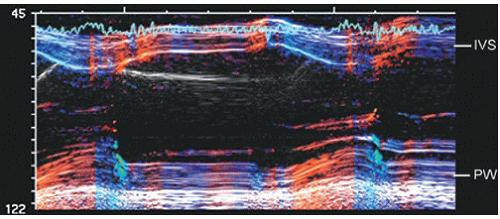
A variation on Doppler tissue imaging is to acquire color-encoded images of tissue motion along an M-mode interrogation line. This represents a combination of M-mode echocardiography, color Doppler imaging, and quantitative Doppler tissue imaging. An example of this technique is shown in Figure 3.14. Color tissue Doppler M-mode imaging is a high temporal and spatial resolution technique for investigating myocardial mechanics, and the information thus extracted can secondarily be employed for determining velocity gradients between adjacent points or more recently for strain rate imaging.
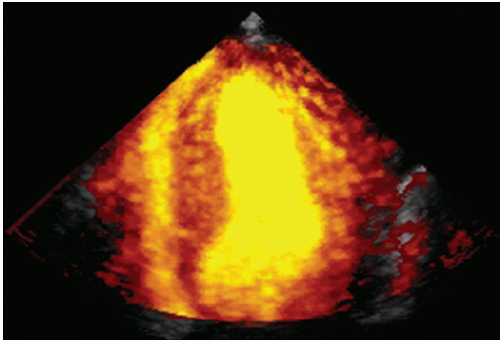
The initial attempts at color encoding and Doppler tissue imaging used standard Doppler shifts of velocity. The Doppler signal in the power or energy domain can also be encoded. The power domain refers to the registration of the intensity or amplitude of the reflected Doppler shifts rather than just their velocity (Fig. 3.15). In theory, this format may be of benefit
because of its higher signal-to-noise ratio and has been used in contrast echocardiography.
because of its higher signal-to-noise ratio and has been used in contrast echocardiography.
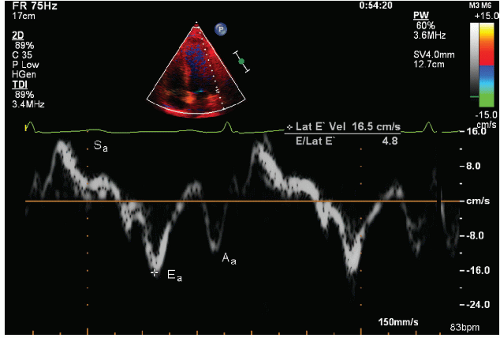
Complete saturation of the image with color signal has seen little clinical acceptance because of the limitations of frame rate and saturation with an adequate signal-to-noise ratio. It should be recognized that the original source signal is actually pulsed Doppler information, acquired from a wide area of interest and targeted to tissue motion. A greater degree of acceptance has been seen by displaying the spectral signal of velocity and extracting quantitative information from localized areas using this technique. Analogous to the use of a sample volume in blood flow imaging, a sample volume can be placed within the myocardium or mitral or tricuspid annulus and the direction and velocity of the myocardium at that point in space accurately determined (Fig. 3.16). As with all Doppler applications, determination of tissue velocity is dependent on the angle of interrogation.
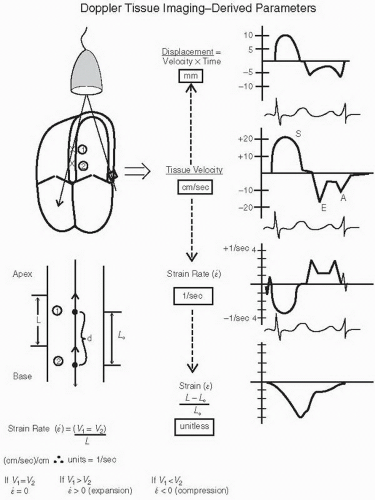
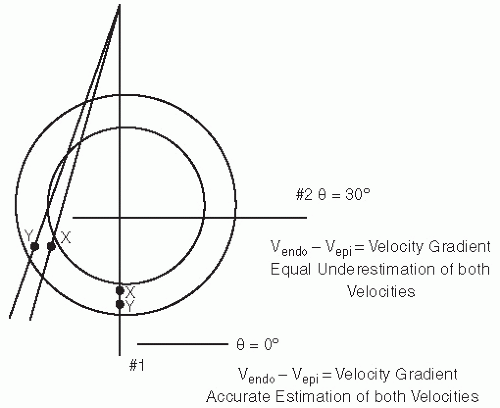
Figure 3.17 outlines the “evolution” of data, which can be derived from Doppler tissue velocities. As Doppler imaging inherently detects motion and calculates velocity, it is velocity that is the fundamental parameter available. Displacement or distance traveled by the tissue can be determined as the product of velocity and time. The simplest calculation that can be derived from two-point analysis is the absolute difference in velocities. This has had clinical applicability in determining the gradient between endocardial and epicardial velocities, which may be a more sensitive indicator of myocardial ischemia than an absolute decrease in velocity across the entire myocardial wall (Fig. 3.18).
More complex derivatives of these measurements include strain and strain rate, both of which provide a more direct assessment of intrinsic myocardial contractility than does ejection fraction or standard wall motion analysis. Because strain rate is the first derivative of motion (i.e., velocity change), it is more directly derived from Doppler tissue imaging, which inherently is a velocity calculation. As noted in Figure 3.17, strain is defined as the change in distance between two points divided by the initial length (L0). Mathematically, it is a unitless number. Strain rate is the first derivative of strain and is calculated as the change in velocity between two points divided by the distance (L) between the two points. Mathematically, the units of strain rate are 1/sec (or sec-1). Strain and strain rate are discussed further in Chapter 6, dealing with evaluation of systolic function.
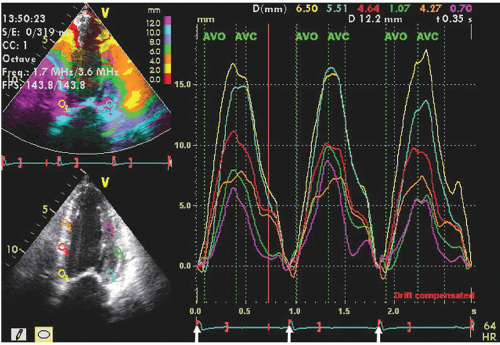
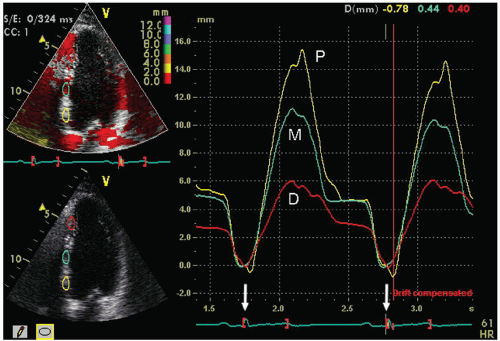
After velocity data have been acquired with Doppler tissue imaging (or tissue speckle tracking, to be discussed later), myocardial motion characteristics at any one or more points or regions can be extracted and displayed. Typically, in an apical four-chamber view, two or three equally spaced regions of interest will be defined in the septal and lateral wall from which velocity, displacement, strain, or strain rate can be displayed in a graphic format. Figures 3.19 and 3.20 depict regional displacement in normal subjects. Note the spatial gradation of both velocity and displacement with higher values toward the base
and lower values toward the apex. In these examples, the data were extracted from Doppler tissue methodology. Figures 3.21 and 3.22 are examples of strain imaging in multiple locations. Note the negative strain present in each of the interrogated segments.
and lower values toward the apex. In these examples, the data were extracted from Doppler tissue methodology. Figures 3.21 and 3.22 are examples of strain imaging in multiple locations. Note the negative strain present in each of the interrogated segments.
Figure 3.23 was recorded in an individual with a lateral wall myocardial infarction using Doppler tissue-based strain imaging. Notice the normal negative strain pattern in the apical septum and the abnormal systolic strain in the lateral wall and proximal septum.
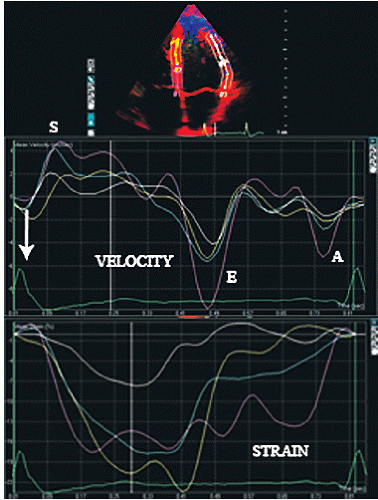 FIGURE 3.21. Doppler-based velocity and strain recordings from an apical four-chamber view in a normal individual. For this example, average velocity and strain over a segment length rather than in a discreet region of interest, as presented in previous figures, has been calculated.
Stay updated, free articles. Join our Telegram channel
Full access? Get Clinical Tree
 Get Clinical Tree app for offline access

|
