Renal Vasculature
Stefan O. Schoenberg
Henrik J. Michaely
Christoph R. Becker
Background
Spectrum and Prevalence of Diseases
The renal arteries can be affected by virtually any type of disease ranging from atherosclerotic occlusive diseases such as renal artery stenosis (RAS), dysplastic changes of the renal artery wall, aneurysmal disease, and vasculitis. The diagnostic evaluation of the renal arteries plays a pivotal role in the comprehensive clinical assessment of various systemic diseases such as hypertension. Also, a multitude of systemic diseases such as essential hypertension, rheumatologic, and infectious diseases as well as various urologic disorders can affect the kidneys with potentially life-threatening consequences such as renal failure with lifelong dialysis (1). In this context, imaging of the renal arteries represents only one facet of diagnostic requirements for detection and staging of disease. Multiple imaging techniques may need to be applied to integrate the evaluation of the renal arteries into a larger diagnostic concept also addressing the renal parenchyma in terms of malignant disease; inflammatory changes; and functioning in terms of perfusion, filtration, and excretion (2) (Fig. 20-1). In addition, morphologic and functional assessment of the urinary out-flow tract may be required.
Unique Considerations for Imaging of the Renal Vasculature
Cross-sectional imaging of the renal arteries has been challenging over the last decade and remains until today. The reason for this is threefold. First, there have been established
invasive and noninvasive imaging techniques such as intraarterial digital subtraction angiography (DSA), Doppler ultrasound (US), and scintigraphy, which have managed to maintain their role for diagnostic evaluation until today. The advantages of DSA are the high temporal and spatial resolution as well as the possibility to directly intervene in the renal artery pathology such as dilating of a RAS, coiling of a renal artery aneurysm, fenestration and renal artery dissection, or embolization of arterial segment in a trauma setting. Doppler US is a readily available, noninvasive bedside technique. In addition to the hemodynamic evaluation of the renal arteries, it also allows for an assessment of the renal parenchymal morphology and blood flow. Renal scintigraphy was the first technique that allowed semiquantitative assessment of renal function by measurements of the clearance rate including filtration and excretion kinetics. This method has been the established modality for a preinterventional assessment of renal function prior to dilatation of RAS or assessment of the contralateral kidney prior to donor or tumor nephrectomy.
invasive and noninvasive imaging techniques such as intraarterial digital subtraction angiography (DSA), Doppler ultrasound (US), and scintigraphy, which have managed to maintain their role for diagnostic evaluation until today. The advantages of DSA are the high temporal and spatial resolution as well as the possibility to directly intervene in the renal artery pathology such as dilating of a RAS, coiling of a renal artery aneurysm, fenestration and renal artery dissection, or embolization of arterial segment in a trauma setting. Doppler US is a readily available, noninvasive bedside technique. In addition to the hemodynamic evaluation of the renal arteries, it also allows for an assessment of the renal parenchymal morphology and blood flow. Renal scintigraphy was the first technique that allowed semiquantitative assessment of renal function by measurements of the clearance rate including filtration and excretion kinetics. This method has been the established modality for a preinterventional assessment of renal function prior to dilatation of RAS or assessment of the contralateral kidney prior to donor or tumor nephrectomy.
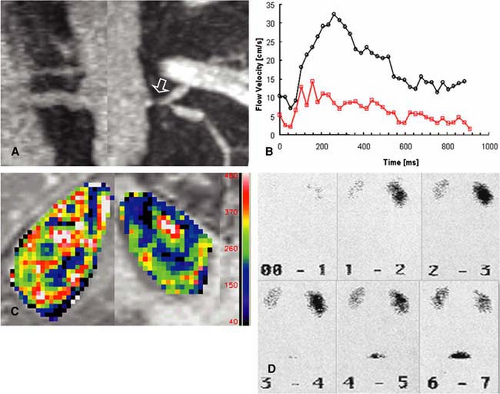 Figure 20-1 Comprehensive renal MR examination in a patient with high-grade left RAS (arrow) in the MRA (A), which was acquired in the steady state after the administration of an ultrasmall superparamagnetic iron oxide (USPIO) intravascular contrast agent (NC100150). B: The phase-contrast flow measurements revealed a normal flow of the right renal artery (black line) and a pathologic flow profile on the left side with loss of the early systolic peak and diminished flow volume (red line). C: The T2*-renal perfusion measurement during the first-pass of NC100150 shows a substantially reduced perfusion of the left kidney, as shown in this color-coded parameter map of the renal blood flow per 100 g of tissue per minute. D: This patient also underwent renal scintigraphy, which confirmed the MR findings of a delayed perfusion and decreased function of the left kidney (dorsoposterior projection). |
Compared with the diagnostic information available from the combined use of these three modalities, MR angiography initially played almost no role in the evaluation of the renal arteries. The reason for this is the particularly challenging anatomy of the renal arteries and the substantial effects of motion on this vessel territory during the cardiac and respiratory cycles. The initially available time-of-flight (TOF) techniques required scanning times of several minutes leading to substantial motion artifacts, which made a large fraction of all exams virtually uninterpretable. In addition, the tortuous course of the renal arteries resulted in artifacts from in-plane saturation of slow flow. Stenosis or focal dilatations
with acceleration or deceleration of flow resulted in severe dephasing artifacts mimicking complete occlusion of the vessel. Overall, only the proximal portions of the renal arteries were usually well seen, while the smaller intrarenal branches were not adequately displayed (4). Although functional MR techniques such as flow measurements were already available in the early days of MR imaging, the long acquisition times did not allow integration of these various techniques into a single comprehensive morphologic and function exam.
with acceleration or deceleration of flow resulted in severe dephasing artifacts mimicking complete occlusion of the vessel. Overall, only the proximal portions of the renal arteries were usually well seen, while the smaller intrarenal branches were not adequately displayed (4). Although functional MR techniques such as flow measurements were already available in the early days of MR imaging, the long acquisition times did not allow integration of these various techniques into a single comprehensive morphologic and function exam.
The spatial resolution of magnetic resonance imaging (MRI) has been about 10-fold lower than that of DSA over most of the decade, which made the grading of small pathologic changes such as wall irregularities in fibromuscular dysplasia (FMD) virtually impossible, in particular when intrarenal branches are affected. On the other hand, computed tomography angiography (CTA) immediately started off with high spatial resolution within the imaging plane of less than 0.5 mm; however, the slice thickness of the individual cross-sectional images was 3 mm for the initial spiral CT scanners. With the advent of multidetector computed tomography (MDCT) scanners, the acquisition of thinner sections has enabled the rapid acquisition of high-resolution scans (Fig. 20-2). Despite short scan times and high resolution, however, the benefits of a functional assessment of the renal arteries has limited the role of CT in the primary evaluation of some renal arterial disorders. Also, patients undergoing evaluation of the renal arteries may be azotemic, limiting the use of iodinated contrast agents in larger amounts.
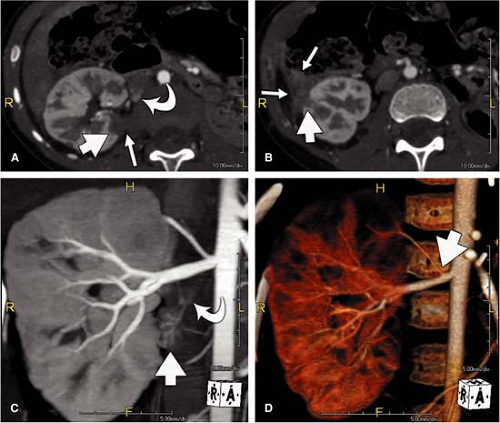 Figure 20-2 Intrarenal and intralymph node arterial visualization in a 5-year-old boy with nephroblastomatosis. A: Transverse CT section from a 4-row MDCT scan obtained with 1.25-mm section thickness demonstrates an abnormal infiltrative soft tissue density involving the posterior midzone of the right kidney (wide arrow) and abutting the right psoas muscle (small arrow). There is a hypervascular lymph node in the renal hilum (curved arrow). B: A second area of infiltrative soft tissue density involves the lateral aspect of the lower pole (wide arrow) involving the lateral conal fascia (small arrows). C: Slab MIP demonstrates the lymph node and its internal arteries (wide arrow) as well as its vascular pedicle (curved arrow). D: Volume-rendered image demonstrates prehilar branching of the right renal artery (arrow). (Figure courtesy of Pietro Sedati and Geoffrey D. Rubin.) |
Advantages of CT and MR
Despite the described challenges for cross-sectional imaging of the renal arteries due to the difficulties from the influence of vascular anatomy and physiologic effects, dramatic technical improvements within the last 5 years have led to a key role of CT and MR imaging for the assessment of renal artery disease. With the introduction of three-dimensional gadolinium-enhanced magnetic resonance angiography (3D Gd-MRA), the limitations of spatial resolution and long scan times as well as artifacts due to in-plane saturation and turbulent blood flow have diminished. Within a single breath-hold, high-resolution data sets of the renal arteries can now be acquired with isotropic spatial resolution of less than 1 mm, thereby coming close to the spatial resolution of DSA. Due to the short scan times and relatively easy set-up, 3D Gd-MRA can now be combined with other morphological and functional MR techniques within one patient examination for a comprehensive assessment of renal disease. These additional techniques include high-resolution imaging with morphologic sequences for detection and characterization of benign and malignant renal masses, phase-contrast (PC) flow measurements for detection and grading of RAS, time-resolved measurements of renal perfusion, and excretion and infiltration for detection of underlying parenchymal disease as well as high-resolution MR urography for detection and grading of urinary outflow obstruction, congenital abnormalities, or transitional cell carcinoma of the urinary tract. Due to the high gradient strength of current state-of-the-art MR scanners, as well as the introduction of parallel acquisition, all of these techniques can now be limited to exam times of a few minutes, allowing for a comprehensive assessment within less than 1 hour (5).
For CT, similar revolutionary achievements have been made within the last 10 years. These include the transition from single row to MDCT, which now allows to not only assess the territory of the renal arteries with isotropic spatial resolution of approximately 0.5 mm in all directions but also to cover a large scan volume of the human body within a short period of time (6). Thus, MDCT plays a pivotal role in the emergency evaluation of acute vascular injury, such as blunt trauma or dissection, since not only the renal arteries, but also the entire aorta can be scanned within less than 20 seconds (Fig. 20-3). CT also plays a key role when high-resolution imaging of the arterial wall or lumen is required to correctly characterize complex renal arterial abnormalities (Fig. 20-4).
CT Imaging Strategies
Within the last decade, CTA of the renal arteries improved significantly by the introduction of MDCT. With more detector rows and faster gantry rotation, these new CT scanners allow for both at the same time, faster acquisition of a certain scan volume, and higher spatial resolution. Short scan times also allow for condensed contrast bolus administration in order to improve the enhancement of the vascular structures. Both high spatial resolution and high-contrast enhancement lead to an improved visualization of even the smallest vessels in the periphery of pole arteries of the kidney. Because of the short scan time and fast contrast injection, administration of contrast media in CTA of the renal arteries with MDCT is of special concern. High-pressure contrast injectors are mandatory for MDCT and are commonly combined with a dual-syringe system for sequential injection of contrast media and a saline flush.
Reconstruction with a soft tissue kernel can lead to “blooming” of renal arterial calcium, which may hinder the detection of stenoses or tent to overestimate the degree of stenoses in particular at the origin of the renal arteries. Higher spatial resolution in MDCT and the use of sharper reconstruction kernels may help to reduce the “blooming artifact”; however, image noise increases with sharper kernels.
CTA provides detailed morphologic information of the renal arteries such as aneurysm, dissection, or thrombosis; yet, it provides little functional information beyond qualitative regional perfusion.
CT Acquisition
Nuances of Acquisition Strategies
The optimal scan range of the renal arteries begins at the level of the diaphragm and extends down to include the internal iliac arteries. This ensures that all accessory renal arteries are included in the scan volume. A precontrast low-dose scan may help to differentiate a renal hematoma or calcification of the renal arteries.
The optimal acquisition parameters for a renal CTA depend on the MDCT scanner used. The slice thickness should be in the range of 0.5 and 1.25 mm, pitch 1 and 1.5, rotation time 0.33 and 0.8 seconds. X-ray exposure parameters, kVp, and mAs, may then be adapted to patients’ habitus, body weight, and size to result in images with low image noise. Automatic attenuation adapted x-ray tube current modulation allows for constant image quality throughout different patients. To avoid the necessity to segment and cut out bowel loops for postprocessing and visualization of the renal arteries, positive oral contrast should not be given.
A delayed scan may help to assess the renal parenchyma for any infarction, tumor, or cystic lesion and also to determine the course and filling of the renal veins, renal pelvis, and ureters. Delayed scans may also help to detect contrast
media extravasation, laceration, rupture, and contusion after traumatic renal injury.
media extravasation, laceration, rupture, and contusion after traumatic renal injury.
 Figure 20-3 A 64-year-old man who presented with an acute dissection of the abdominal aorta extending to the superior mesenteric artery as well as to the left and right renal artery. Three-millimeter-thick sagittal (A) and transverse (B, C) views from a 64-row multidetector CTA with a collimation of 0.6 mm and the DSA in coronal view (D) during the intervention are shown. There is a large thrombus in the true lumen (seen en face in the DSA as an oval filling defect). MDCT clearly demonstrates the thrombus partially occluding the ostium of both renal arteries and leading to a tapering appearance of the right renal artery on DSA. Pigtail catheters have been placed into the true and the false lumen of the aorta prior to fenestration. |
 Figure 20-4 A 33-year-old male with 6-month history of refractory hypertension. An initial MRA examination (not shown) performed at 1.5T with gadolinium enhancement failed to allow prospective recognition of any renal vascular abnormality; however, irregularities in the renal parenchyma suggested a diagnosis of chronic pyelonephritis. Inconsistencies between this imaging diagnosis and the clinical presentation led to a catheter arteriogram. A: Selective left renal arterial injection demonstrates an abnormality of the distal right main renal artery (arrow). It was difficult to ascertain at the time of the examination whether this represented multiple branching structures that were overlapping or whether this represented an aneurysm with a filling defect. B: Image obtained in the early nephrographic phase of the arteriogram demonstrates poor parenchymal opacification in the lateral aspect of the upper pole extending to the midzone. Although five different projections of the renal artery were obtained during the course of the examination, greater clarity of the anatomic relationship of the renal artery abnormality could not be ascertained. The specific nature of the abnormality, which was felt to most likely represent aneurysm and the mechanism of regional renal arterial hypoperfusion, were not clear. The appearance of a weblike filling defect proximal to the aneurysmal abnormality was considered as a possible intrinsic renal lesion due to vasculitis or fibromuscular dysplasia but was only visualized on the single view (B). Finally, the relationship of the abnormality to the renal parenchyma was important to determine, as it was likely that an operation would be required to treat this lesion, and its relationship to the renal parenchyma was critical to determining whether the operation could be performed in situ or ex vivo. C: Volume rendering from a CT angiogram provides a 3D representation of the abnormality and most notably establishes its presence within the renal hilum, though external to the renal parenchyma. The color scale with purplish tones representing lower attenuation and pinker tones representing higher attenuation indicates the zone of poor renal perfusion to a much greater extent than is evident from the arteriogram. D: Three-centimeter thick-slab MIPs of the anterior and posterior halves of the kidney illustrate the complex anatomy that was difficult to separate on the projection arteriogram (A, B). The posterior half of the kidney (right) is perfused by a single branch with segmental branches reaching all posterior renal lobes. On the anterior image (left), two thin arrows indicate sequestered intrarenal branches, which are separated from the apparent apex of the aneurysm (wide arrow) by 1 to 2 cm distance. The parenchyma distal to the small intrarenal branches is hypoperfused. Note that a branch from the aneurysm to the lower pole provides adequate supply to the anterior lower pole. E: Curved coronal reformation through the left renal artery establishes that there is no filling defect within the renal artery defect proximal to the aneurysm. Most importantly, the improved soft tissue delineation available from the single voxel thick reformation illustrates thrombus at the apex of the aneurysm (wide arrow) extending to one of the small intrarenal branches (arrowheads), which in turns supplies a zone of the anterior upper pole, which is both hypoattenuative and demonstrates cortical thinning (curved arrow). These abnormalities are similarly displayed on a curved transverse reformation (F) with the additional visualization of a weblike filling defect within the aneurysm (open arrow), likely representing partial recanalization of thrombus within the aneurysm. The mechanism of hypertension is now evident, as two anterior upper polar segmental renal branches that once were in direct contiguity with the main renal artery are being supplied through intrarenal collaterals because thrombus at the apex of the aneurysm has blocked prograde flow to these branches. The resulted ischemia to the anterior upper pole is presumably the cause of hypertension. G, H: In retrospect, the two intrarenal branches can be observed (white arrows) to fill on delayed images only from the arteriogram. The patient underwent an ex vivo repair with resection of the aneurysmal segment and transplantation of the intrarenal branches with subsequent resolution of hypertension. (Images courtesy of Geoffrey D. Rubin.) |
For CTA scanning of the renal arteries in transplanted kidneys, the scan field needs to be adapted to the pelvis.
Contrast Medium
The amount of contrast media mainly depends on the scan time and contrast media flow rate. Contrast media flow rates may range between 3 and 5 mL/second depending on location and diameter of the intravenous access. The higher flow rates improve the visualization of smaller vessels by higher opacification. Highly concentrated contrast media (370 or 400 mg/mL iodine) may also improve the visualization but requires administration at body temperature because of the high viscosity of these contrast media. A saline flush may help to reduce the amount of contrast media necessary
for a CTA and improves the opacification of the renal arteries by keeping the contrast bolus compact.
for a CTA and improves the opacification of the renal arteries by keeping the contrast bolus compact.
Postprocessing
The exclusive use of transverse reconstructions for interpreting renal arterial CTA is challenging and fraught with peril (Fig. 20-5). The high-resolution data set by MDCT is ideally suited for postprocessing to improve visualization of the findings. Curved multiplanar reformation (MPR) allows one to visualize the entire course of both arteries within the same image. A disadvantage of curved MPR is the manual pathfinding process that is time consuming. In the worst case, MPR may create “pseudo-stenoses” by off-center reconstruction. Automatic pathfinding is superior in this respect and creates a stretched view of the arteries from a centerline position. The reconstruction angle can be changed to any direction to enable visualization from any perspective. This kind of reconstruction also allows for curved measurements of the degree and length of the renal artery stenoses in order to provide important information prior to an intervention. It is also important to assess the composition of the underlying atherosclerosis prior to the invasive therapy. Perpendicular MPR at the location of the stenosis may help to differentiate between eccentric and concentric manifestation of plaques in the renal artery wall, giving a hint for the differential diagnosis between atherosclerosis and vasculitis (Fig. 20-6).
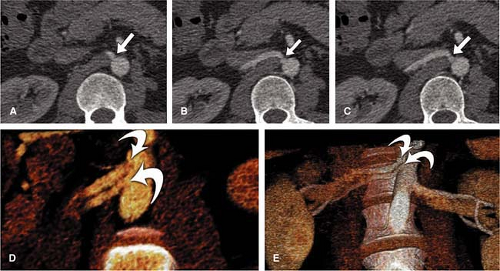 Figure 20-5 Challenging detection of accessory renal arteries using transverse sections. A–C: Multiple transverse CTA sections suggest the presence of two right renal arteries, but they are difficult to distinguish from one another in the transverse plane (small arrows). D, E: Two coronal oblique volume-rendered images with a 5-mm slab (D) and a 40-mm slab (E) clearly demonstrate two distinct right renal arteries (curved arrows). (Figure courtesy of Pietro Sedati and Geoffrey D. Rubin.) |
Maximum intensity projections (MIP) should be generated along the course and separated for both renal arteries, in left and right anterior oblique projection. MIP reconstruction will fail to visualize RAS in case of severe calcifications.
Volume rendering (VR) is primarily suited to display the anatomy of the vessels, such as in the case of complex multivessel supply and drainage of the kidney (Fig. 20-7). In particular, in renal transplants, VR is helpful and allows for easy assessment of renal artery anatomy and pathology such as kinking and stenoses. Calcifications may cause false-negative results in VR, and renal artery stenoses are commonly overestimated. Manual segmentation of the bones may become necessary to display the renal arteries from any perspective.
VR should not be used to grade stenoses, as it will not display the interface between calcium and the arterial lumen accurately and can both under- or overestimate noncalcified stenoses (Fig. 20-8). In many other pathologies (e.g. renal artery dissection and thrombosed aneurysms), however, it is essential to review the planar reformations.
Transverse sections and MPRs of the abdominal aorta allow determination of the renal arterial supply from the false or true lumen. Eccentric thrombus formation and calcifications in an aneurysm sac may be best seen in the axial slices.
Transverse sections and MPRs of the abdominal aorta allow determination of the renal arterial supply from the false or true lumen. Eccentric thrombus formation and calcifications in an aneurysm sac may be best seen in the axial slices.
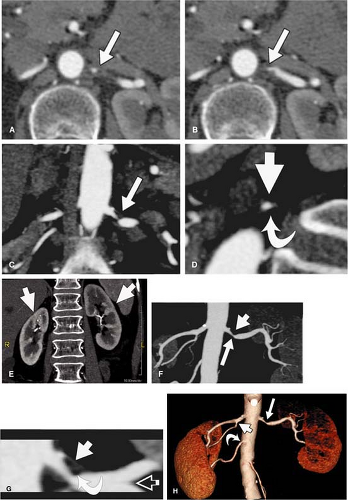 Figure 20-6 Renal artery CTA: comparison of visualization techniques. A, B: Contiguous transverse images demonstrate proximal left RAS (arrows). C: Oblique MPR parallel to the long axis of the left renal artery provides an orientation that demonstrates a greater portion of the artery in the region of the stenosis (arrow), but neither displays the entire artery nor does it document the full degree of luminal narrowing. D: Oblique MPR perpendicular to the right RAS documents the absolute luminal restriction but does not provide context for the narrowing relative to a normal segment of the artery. Both fatty and soft tissue attenuation components of the mural atheroma are visible (curved arrow). Expansion of the outer wall of the artery is a manifestation of positive remodeling (big arrow). When stenosis measurements are made relative to the outer wall, percent luminal narrowing may be overestimated relative to normal luminal dimensions. E: Coronal MPR image demonstrates less enhancement of the left renal parenchyma compared with the right (arrows). F: Coronal MIP demonstrates a portion of the atheroma (short arrow) without the possibility to evaluate the inferior margin of the plaque due to the superimposed left renal vein (long arrow). G: Curved planar reformat (CPR) demonstrates the fatty elements within the atheroma (curved arrow) and the extent of positive remodeling (big arrow). Open arrow indicates a loop artifact. H: Coronal 3D volume-rendered image demonstrates proximal left RAS (long arrow) within the context of adjacent arterial anatomy, including prehilar branching of the main right renal artery (wide arrow), and an accessory right renal artery (curved arrow). The atheroma is not visualized on the volume rendering. Note the decreased enhancement of the left kidney compared with the right. (Figure courtesy of Pietro Sedati and Geoffrey D. Rubin.) |
 Figure 20-7 Cross-fused renal ectopia. A: Transverse CT section demonstrates a malformed kidney in the right renal fossa (big arrow) and large circumiliac draining vein entering the inferior vena cava (curved arrow). B: Volume rendering documents absence of the left kidney and presence of the abnormal kidney in the right renal fossa (short arrow). There are multiple large venous channels (long arrow) draining into the inferior vena cava and one of the renal veins via the circumiliac course (curved arrow). C: Transverse volume rendering through the inferior aspect of the kidney (wide arrows) demonstrates an indentation at the level of the fusion between right and left kidneys (thin arrow). D: Coronal oblique MPR image shows the plane between the fused kidneys (arrows). E: Oblique volume rendering illustrates the complex relationships of both the arterial supply and the venous drainage (straight arrows). The curved arrow indicates the circumiliac course of the renal vein. F: There are two renal arteries (long arrows) and three renal veins (wide arrows). (Figure courtesy of Pietro Sedati and Geoffrey D. Rubin.) |
 Figure 20-8 Right RAS and calcification. A, B: Contiguous transverse sections from a CTA illustrate the challenge of detecting and characterizing RAS (curved arrow) when the artery has an oblique course. C, D: Volume renderings allow identification of the renal artery along its entire course and provide a clearer display of the stenosis (curved arrow) and associated poststenotic dilation (straight arrow). Appropriate selection of view angles allows the stenosis to be visualized free of overlying calcifications. E: MIP does not allow visualization of the stenosis through the calcification (arrow). F, G: Curved planar reformations generated 90° apart provide the best depiction of the stenosis (straight arrow) relative to the calcified and noncalcified plaques (curved arrows), while also showing the aorta and the distal renal artery. H: Oblique MPR generated perpendicular to the center line of the renal artery at the point of maximal stenosis illustrates the cross-sectional area of the residual stenosis (curved arrow), varying degrees of calcification in plaque (thin and wide arrows), and noncalcified plaque (open arrow). (Figure courtesy of Pietro Sedati and Geoffrey D. Rubin.) |
MR Imaging Strategies
MR Acquisition
Generally, it has to be stated that an optimized protocol of 3D Gd-MRA balances three factors—anatomic coverage, spatial resolution, and scan time. Current results on the accuracy for stenosis grading require a spatial resolution of less than 1 mm isotropic in all anatomic directions and breath-hold times of less than 20 seconds. For this reason, MR scanners with a high gradient strength of a minimum of 30 mT/m and a rise time of 200 μsec or less should be used in conjunction with techniques for faster k-space acquisition, such as parallel acquisition techniques, asymmetric k-space sampling, or spiral echo-planar imaging.
To fulfill the requirements of anatomic coverage and spatial resolution, 3D contrast-enhanced MRA with fast 3D gradient-echo (GRE) sequences and bolus administration of gadolinium chelates is the only technique that is reliable and accurate in clinical routine. Standard TOF techniques have virtually disappeared from clinical use due to the multitude of artifacts and long scan times. However, currently evolving free-breathing navigator-corrected steady-state free precession (SSFP) techniques might play a role in the near future for high-resolution imaging of the renal arteries without contrast agents (8). Likewise, 3D Gd-MRA can be applied in a free-breathing high-resolution mode when intravascular blood-pool contrast agents have been applied; however, none of these agents is currently approved for clinical use (9), although the strong albumin-binding Gd-chelate MS-325 is on the doorstep of clinical availability.
Breath-hold 3D Gd-MRA is usually performed with a field of view of approximately 40 cm and a thickness of the 3D slab of 8 to 10 cm to ensure complete anatomic coverage of the renal arteries, but smaller fields of view may be preferable to improve spatial resolution. A coronal orientation of this 3D slab is used since this ideally remodels the course of the abdominal aorta and the renal arteries and thus allows minimizing the acquisition volume. To further minimize the acquisition time, usually a rectangular field of view is used in the left-to-right direction, but this approach is prone to aliasing from the arms outside the field of view. Usually, this does not substantially degrade the image if the arms are only aliasing into the flanks of the abdomen lateral to the kidney margins. However, in thin individuals, those aliasing artifacts can overlay on the renal arteries themselves, thus requiring the need for a full quadratic field of view. Caution also needs to be taken when parallel acquisition techniques are used, since in that case aliasing artifacts can be propagated into the center of the image, thereby substantially limiting the evaluation of the renal arteries. For 1 mm isotropic spatial resolution, matrix sizes of at least 448 or 512 frequency and phase-encoding steps should be used. Also, acquisition time should be ideally less than 20 seconds, since it is known that even in the case of a perfect breath-holding capacity of the patient, two different physiological processes other than cardiac pulsation result in gradual motion of the vascular bed of the renal arteries. First, there is an involuntary relaxation of the diaphragm over the breath-hold period, resulting in a gradual shift of the retroperitoneum. Second, it has been shown that random involuntary motion is induced by contractions of the diaphragm, which can neither be eliminated by respiratory nor by cardiac gating (10).
In order to understand the challenges for breath-hold high-resolution MRI of the renal arteries, one needs to look into a closer detail of the 3D acquisition: With typical repetition times of 5 milliseconds for fast 3D GRE sequences, the acquisition of a full 448 matrix and an 8-cm thick 3D slab with 1 mm slice thickness would require almost 3 minutes. The recent high performance cardiovascular MR scanners now offer repetition times of 3 milliseconds, which by itself will reduce the acquisition time by about 40% to 108 seconds. In addition, asymmetric k-space sampling is now routinely used on most MR scanners in both phase-encoding directions of approximately 25% each, further reducing the acquisition time to only about 60 seconds. With the use of parallel imaging and an acceleration factor of 2, the acquisition time can be approximately reduced by about half to around 30 seconds. Using a rectangular field of view of about 75%, the acquisition then only lasts 23 seconds. This example highlights the importance of state-of-the-art equipment and new k-space acquisition techniques for renal MRA (Fig. 20-9).
In addition to parallel imaging, other authors have proposed two different strategies for reduction of the number of phase-encoding steps. One approach is to use a spiral echo-planar imaging in the left-to-right phase-encoding direction of the 3D volume with conventional cartesian phase encoding in the anterior-to-posterior direction (11). This approach reduces the acquisition time by approximately 20% to 30% due to the more efficient k-space sampling. However, it is prone to artifacts from nonlinearity of the gradients because the long spiral readout leads to higher sensitivity against B0 inhomogeneities, resulting in image blurring. This artifact can be reduced by unwrapping the phase errors in k-space, which requires knowledge of the spatial distribution of the local off-resonance frequencies or by an algorithm that estimates the offset frequencies from the blurred image itself (12).
Overall, two different approaches for arterial phase imaging of the renal arteries are used:
High Spatial Resolution Single-phase Magnetic Resonance Angiography
With this approach, one single high-resolution data set is acquired during the arterial phase of the contrast media transit for pure imaging of the renal arteries without venous overlay. This approach usually requires bolus timing by a prior injection of a small (1–2 mL) amount of contrast media for determination of the transit time (13). Alternatively, the scan can be initiated after automatic detection of the contrast media bolus arrival (14,15) or real-time visualization of the contrast media bolus arrival (16,17,18). Two acquisition concepts exist to fulfill the spatial resolution requirements within the given acquisition time. Either an ultrafast sequence with further acceleration by parallel imaging is applied to ensure adequate isotropic spatial resolution within a single breath-hold or an elliptical centric k-space acquisition approach is
applied. With elliptical centric k-space acquisition, the central portions of k-space are acquired within a very short acquisition time during the beginning of the breath-hold. The acquisition of the high spatial frequency components are carried out during the later phase of the scan (16). Elliptical centric acquisitions commonly use measurement times exceeding one breath-hold; however, due to the rapid acquisition of the central k-space components, motion artifacts are limited even if the patient gradually exhales. On the other hand, very high resolution can be obtained without venous overlay. This approach is commonly used for imaging of the carotids, but there have also been reports on the successful use of this technique for the renal arteries in a larger number of patients (19).
applied. With elliptical centric k-space acquisition, the central portions of k-space are acquired within a very short acquisition time during the beginning of the breath-hold. The acquisition of the high spatial frequency components are carried out during the later phase of the scan (16). Elliptical centric acquisitions commonly use measurement times exceeding one breath-hold; however, due to the rapid acquisition of the central k-space components, motion artifacts are limited even if the patient gradually exhales. On the other hand, very high resolution can be obtained without venous overlay. This approach is commonly used for imaging of the carotids, but there have also been reports on the successful use of this technique for the renal arteries in a larger number of patients (19).
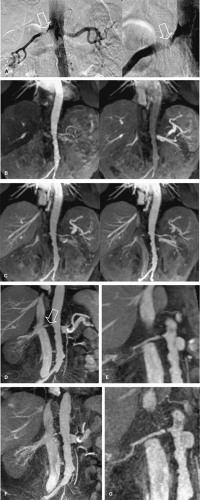 Figure 20-9 A: Intra-arterial DSA of a 73-year-old female patient who was suffering from renal hypertension due to her high-grade right-sided RAS (arrows). B: The magnified view of the stenosis reveals an eccentric narrowing of the renal artery. C: The patient then underwent dynamic renal MRA with 2 ÷ 2 mm2 in-plane resolution during the first pass of an USPIO contrast agent (SHU 555C). The stenosis can be appreciated on these dynamic images. Since 555C is an intravascular contrast agent, the signal intensity of the vessels remains high even after the first pass. D: In the high-resolution MRA with an in-plane resolution of 1.3 ÷ 1.3 mm2, the stenosis (arrow) can be clearly depicted and can be even more appreciated on the magnified view (E). Note that signal is almost exclusively from the vessels, even though this MRA has been acquired during the steady-state phase several minutes after the first injection. Since the contrast agent is cleared from the blood by phagocytosis in the reticuloendothelial system, particularly in liver and spleen, very slowly a second high-resolution MRA with an in-plane resolution of 0.9 ÷ 0.9 mm2 was acquired using parallel imaging. (F, G). The contours of these images are better defined, but there is increased image noise due to the application of parallel imaging. |
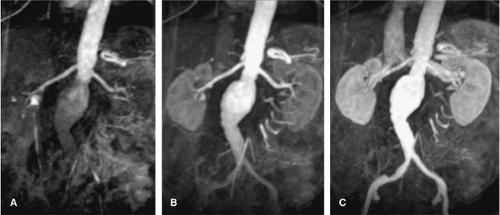 Figure 20-10 Coronal MIP views of a multiphasic MRA of a 56-year-old male patient with an abdominal aortic aneurysm. All three phases lasting 6.8 seconds each are acquired in a single breath-hold of 20.4 seconds. A: The early arterial phase shows beginning enhancement of the renal arteries. B: In the late arterial phase, there is strong arterial contrast of the abdominal vessel without venous overlay of the renal arteries. C: In the venous phase, the venous return from both renal arteries can already be appreciated, even though there is still arterial contrast. At this time, the distal end of the aortic aneurysm and the iliac arteries are now completely filled. |
Multiphasic Magnetic Resonance Angiography
Multiphasic MRA has been used in different contexts in the literature. Most commonly, the term multiphasic MRA refers to a time-resolved approach during the first pass of the contrast media. Multiple 3D Gd-MRA data sets are acquired during one single breath-hold to selectively image the early arterial phase, the late arterial phase, and early venous phase of the contrast media transit (20,21) (Fig. 20-10). This approach has three intrinsic advantages. First, no timing procedure for arrival of the contrast media bolus is required, imaging can directly start after fixed delay, and one of the subsequent data sets will display the contrast media arrival. Second, the short acquisition time of the individual data sets of less than 6 seconds allows better visualization of the segmental and intrarenal segments of the renal arteries before substantial parenchymal enhancement occurs. Third, this approach is less susceptible to involuntary motion of the renal arteries from random diaphragm contractions. Some studies have already shown the improved visualization of the distal renal segments.
On the other hand, spatial resolution is substantially lower due to the short acquisition time of each data set when cartesian k-space sampling is used. With the introduction of undersampled 3D radial imaging (3D-VIPR), time-resolved MRA is possible with isotropic 1 mm spatial resolution but at the cost of lower signal to noise (SNR) and occurrence of substantial streak artifacts at the present time (22).
Thus, time-resolved MRA is a robust technique for depiction of atherosclerotic renal artery occlusive disease, aneurysms (Fig. 20-11), or renal artery dissection; however, caution has to be taken for the evaluation of subtle irregularities of the renal arteries, such as in FMD, neurofibromatosis, or vasculitis.
The other meaning of multiphasic MRA is the acquisition of high-resolution multibreath-hold data sets during the different stages of the contrast media transit, that is, during the arterial phase, the equilibrium phase, and the excretory phase for the acquisition of an MR urography data set (Fig. 20-12).
Three-dimensional Phase Contrast Magnetic Resonance Angiography
This technique was initially developed as a competitor for TOF MR angiography of the renal arteries. While in principle this technique suffers from similar limitations as TOF MRI, such as long measurement times with motion artifacts and limited spatial resolution, it does offer some unique advantages. PC techniques are substantially more sensitive to slow flow, resulting in a better depiction of small distal vessels. The main rationale for the use of this technique, however, is the susceptibility to intravoxel dephasing in areas of accelerated flow and aliasing artifacts at areas of turbulence. While this was initially considered a limitation of the technique, it is now used by some authors
as an easy way to detect and grade hemodynamically significant RAS (23) (Fig. 20-13). In order to be sensitive enough for the renal artery flow, the strength and duration of the velocity-encoding gradient (so-called VENC) has to be adapted on a patient-by-patient basis. While in normal individuals a VENC of 50 cm/second is appropriate, the VENC should be set to 40 cm/second in older patients and 20-30 cm/second in patients with compromised renal function.
as an easy way to detect and grade hemodynamically significant RAS (23) (Fig. 20-13). In order to be sensitive enough for the renal artery flow, the strength and duration of the velocity-encoding gradient (so-called VENC) has to be adapted on a patient-by-patient basis. While in normal individuals a VENC of 50 cm/second is appropriate, the VENC should be set to 40 cm/second in older patients and 20-30 cm/second in patients with compromised renal function.
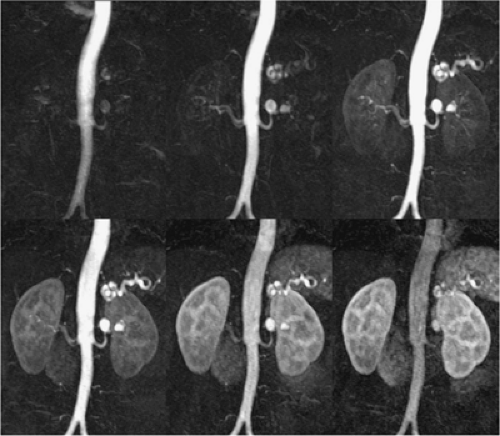 Figure 20-11 Time-resolved MRA of the renal arteries in a 52-year-old female patient with hypertension at 3.0 T. The temporal resolution of the single frames is 1.4 seconds. This 3D-MRA was acquired using a TREAT (time-resolved echo-shared angiographic technique) sequence, which combines view sharing with parallel imaging to allow high spatial (1.7 ÷ 1.2 ÷ 5.0 mm3) and a high temporal resolution (1.4 seconds/3D data set). This technique allows detailed analysis of the blood flow dynamics. In this patient with FMD, the dynamic filling process of the renal artery aneurysms can be clearly seen. TREAT also allows assessing the renal perfusion to detect decreased perfusion and delayed perfusion of a single side. (Courtesy of J. Paul Finn, M.D., University of California in Los Angeles.) |
Qualitative grading of the hemodynamic significance of RAS by means of signal loss on 3D PC MR angiography is done on a four-point scale, with no artifacts or focal tapering of the renal artery for a normal vessel or a mild RAS.
The presence of a focal tapering with some dephasing artifacts marks the presence of a hemodynamically significant stenosis greater than 50% in diameter, while a complete focal signal drop-out marks a severe stenosis exceeding 75% in diameter.
Unenhanced Time-of-flight Magnetic Resonance Angiography Techniques
TOF techniques are flow dependent, that is, they require inflow of moving blood into the vascular territory of the renal arteries. As mentioned earlier, standard TOF techniques with two-dimensional (2D) breath-hold multislice methods or 3D free-breathing acquisitions are rarely used in clinical routine due to the adverse effects of motion artifacts and signal voids due to turbulences or in-plane saturation. The introduction of SSFP techniques with navigator
correction of respiratory motion has revitalized this completely noninvasive approach.
correction of respiratory motion has revitalized this completely noninvasive approach.
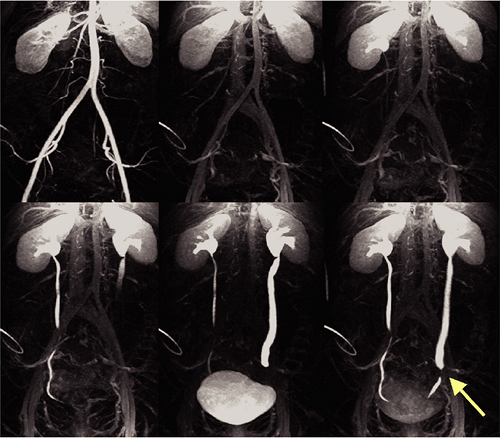 Figure 20-12 Coronal MIP view of a multibreath-hold MRA of a 29-year-old female patient with endometriosis-related stenosis of the left ureter. In this multiphasic MRA, the excretion of the kidneys can be well visualized, thereby demonstrating the stenotic segment of the left ureter (arrow). There are dilatation of the left ureter and hydronephrosis of the left kidney secondary to the ureteral stenosis. |
 Figure 20-13 A: Three-dimensional Gd-MRA of a 62-year-old female patient with a 50% proximal right-sided RAS. B: The 3D phase-contrast MRA demonstrates the entire right renal artery without dephasing. Consequently, this stenosis was not considered hemodynamically significant. |
In one study, these free-breathing renal MRA techniques with SSFP and combined with a slice-selective inversion pulse allowed for selective and high contrast visualization of the renal arteries, including the more distal branches (8). Artifacts from respiratory or cardiac motion were eliminated by cardiac triggering and respiratory gating with a navigator positioned at the diaphragm. Due to the relatively long acquisition times of around 2 minutes, a high in-plane spatial resolution of approximately 1 mm2 can be achieved with relatively thin slices of 2 mm. Scan orientation for this technique is axial. By using a slice-selective inversion prepulse with an appropriate inversion time (TI), signal of the static tissue can be suppressed depending on the specific relaxation time. On the other hand, inflowing blood, which washes into the imaging volume during the inversion time delay, maintains high signal intensity. Typical inversion times of 300 milliseconds are used. In order to suppress signal from the abdomen as well as from inflowing blood of the inferior vena cava, local presaturation bands should be placed. So far, reliable data only exists in volunteers. Here, the proximal, middle, and distal portion including the intrarenal segmental arteries were well visualized. This technique is still in its early days to estimate its performance in patients with RAS. However, it could hold great potential for patients in whom administration of MR contrast agents is contraindicated, such as in pregnant women with malignant hypertension.
Phase-contrast Magnetic Resonance Flow Measurements
MR cine PC flow measurements were introduced in the late 1990s. Their validity has been shown in comparison studies to invasive US measurements with good correlation between these two modalities (24,25,26). 2D cine PC flow measurements are based on the principle that spins moving along a gradient experience a phase shift that is proportional to their flow velocity (27). Flow measurements of the renal arteries provide a fast assessment of the hemodynamic significance of a present RAS (5,23,28). These measurements should be performed with cardiac gating using either prospective or retrospective gating. Care needs to be taken to assure that the measurement plane is perpendicular to the vessel axis. This can be easily achieved when the flow measurements are acquired after the 3D Gd-MRA scan using the subvolume maximum-intensity projection (MIP) images of the MRA data set for defining the orientation of the scan plane in multiple angles. In stenosed arteries, the scan plane needs to be positioned at least 1 cm distal or proximal to the stenosis. It is important that the averaged temporal resolution of the sequence is below 30 milliseconds in order to reliably display all characteristic components of the velocity curve. For each time frame, a flow-sensitive and a flow-compensated scan are obtained, resulting in a minimum temporal resolution of 2 times repetition time, which is typically in the order of 12 to 15 milliseconds. To acquire a 256 ÷ 256 matrix for each time frame, a total measurement time of approximately 3 to 4 minutes is required.
Currently, all scanners offer postprocessing software to analyze the series of PC data sets. Regions of interest can be manually drawn along the margins of the vessel cross section. Alternatively, automatic segmentation approaches of the vessel contour can be applied based on fitting a 3D parabolic velocity model to the actual velocity profiles (29). Velocity-time curves are then calculated from the velocity data in each time frame after applying a correction for phase noise and aliasing. Thus, each data point on the curve represents the mean velocity averaged over the vessel area for the individual time frame. It is important for the grading of hemodynamic changes that the cine PC flow curves are scaled to a maximum velocity of 35 to 40 cm/second with the velocity averaged over the vessel area (30). These characteristic changes of the velocity flow profile that correspond to certain degrees of RAS have been invasively validated in the past in animal models and clinically validated in multicenter patient trials (25,26,30). The presence or absence of the three distinct features of the PC flow curve are noted, that is, the “early systolic velocity peak,” the subsequent “incision,” and the second lower “midsystolic peak.” A renal artery without presence of a stenosis is represented by a normal velocity curve. A partial loss of the early systolic peak is an indicator of a hemodynamically nonsignificant low-grade stenosis of 50%. Almost complete loss of the early systolic peak and decrease of the midsystolic peak indicates moderate stenosis of >50%, whereas a featureless flattened flow profile with no systolic velocity components is representative for a high-grade stenosis of >75% (Fig. 20-14).
One disadvantage of standard PC flow measurement techniques using standard GRE techniques is the relatively long scan times of several minutes. This leads to motion artifacts of the PC images with the consequence of overestimation of the vessel area by about 10% to 20%, resulting in about 10% higher mean flow values. Segmented echo-planar imaging cine PC flow measurements are capable of performing cardiac-gated flow measurements in the renal artery with both high temporal and spatial resolutions (31). When eight or more interleaved echo trains are used, a temporal resolution (= repetition time) of below 31 milliseconds can be achieved, thus total imaging time is reduced to a 28-second breath-hold scan for the acquisition of a 2562 matrix at an RR-interval length of 800 milliseconds. To ensure reliable cardiac gating, an optically decoupled electrocardiogram
(ECG) device is preferable, which minimizes the influence of the gradients on the ECG registration. However, one problem of these techniques is the presence of ghosting artifacts from off-resonances around the margins of the vessel.
(ECG) device is preferable, which minimizes the influence of the gradients on the ECG registration. However, one problem of these techniques is the presence of ghosting artifacts from off-resonances around the margins of the vessel.
 Figure 20-14 PC flow measurements of the renal artery. The figure shows the characteristic changes in the flow profile with increasing RAS. A: The flow profile of a healthy renal artery with mean early systolic flow velocity peak at approximately 35 cm/second. B: Loss of the early systolic peak with otherwise normal flow indicating low-grade RAS (<50%). C: With RAS of 50% to 75%, the early systolic peak is absent, and the overall mean flow is becoming impaired. D: In the case of a high-grade RAS (>75%), no normal flow pattern can be appreciated. The flow curve appears featureless, and no differentiation of systolic and diastolic flow can be safely achieved. |
Measurements of Renal Perfusion
While flow measurements display the flow in the large feeding vessels, perfusion measurements aim at demonstrating the capillary blood flow in the renal parenchyma and, especially, in the highly vascularized renal cortex. The adjunct of renal perfusion measurements to a comprehensive morphologic and functional MR imaging protocol addresses a number of clinical questions. The effects of a chronic RAS with consecutive ischemic nephropathy can be assessed. Renoparenchymal damage independent from the presence of a RAS such as in diabetes, hypertensive nephrosclerosis, or glomerulonephritis can be detected (32,33). Focal disease within the kidney, such as in the presence of segmental RAS or regional ischemic changes in transplants, can be identified and graded by regional assessment of renal perfusion (34).
Currently, there are two main approaches to renal perfusion measurements: arterial spin labeling (ASL) techniques, which use blood as an endogenous contrast agent, and contrast-enhanced techniques, which are based on dynamic imaging of the contrast media transit through the renal parenchyma. ASL techniques are attractive in that they are noninvasive and do not require the administration of contrast agents. Different techniques have been proposed so far in the literature; however, only animal studies or volunteer studies have been performed (35,36,37,38).
The main disadvantages that limit broad clinical application are the inherent low SNR and the susceptibility for artifacts. Most ASL techniques such as flow-sensitive alternating inversion recovery (FAIR) measure the signal from arterial blood at a fixed inversion delay after magnetic labeling. As no image information is sampled during this delay, FAIR measurements are inefficient and time consuming. To avoid this problem, a Look-Locker acquisition to sample not one but a series of images after each labeling pulse has been proposed (39). This technique also overcomes the limitation of ASL sequence to yield only a single perfusion-weighted slice without the temporal perfusion information. To increase the SNR
and to decrease the susceptibility for artifacts, a True FISP-readout for ASL sequences has been proposed recently (40). In one study of ASL in 46 patients, an overall accuracy of 88% could be achieved to classify kidneys into either healthy or diseased compared with the final clinical diagnosis using a combination of mean arterial blood flow from PC flow measurements and renal perfusion from ASL. While this study was not able to differentiate between primary or secondary parenchymal disease, it showed an extremely high specificity of 99% to exclude any underlying renal disease (32). So, even though these techniques are very promising and possible applications like renal transplant surveillance are in sight, no routine clinical application has been achieved so far.
and to decrease the susceptibility for artifacts, a True FISP-readout for ASL sequences has been proposed recently (40). In one study of ASL in 46 patients, an overall accuracy of 88% could be achieved to classify kidneys into either healthy or diseased compared with the final clinical diagnosis using a combination of mean arterial blood flow from PC flow measurements and renal perfusion from ASL. While this study was not able to differentiate between primary or secondary parenchymal disease, it showed an extremely high specificity of 99% to exclude any underlying renal disease (32). So, even though these techniques are very promising and possible applications like renal transplant surveillance are in sight, no routine clinical application has been achieved so far.
In contrast to the ASL technique, contrast-enhanced MR perfusion (CE MRP) techniques do not suffer from SNR limitations. The first renal perfusion studies are reported from 1989 (41). Although the technique has evolved since then, CE MRP is not yet widely clinically applied. The basic principle of CE MRP is to administer a bolus contrast agent and to visualize the arrival of the bolus in the renal parenchyma using dynamic imaging of the kidneys with the best temporal resolution possible.
So far, absolute quantification of cortical blood flow is only reliably possible with intravascular contrast agents such as USPIO agents (SHU 555 C, Schering AG, Berlin, Germany; NC 100150, GE Healthcare, Little Chalfont, UK), strongly protein-binding contrast agents (MS-325, Epix Pharmaceuticals, Cambridge, MA, USA), or macromolecular gadolinium complexes (Gadomelitol, Vistarem, Guerbet, Paris, France; Gadomer-17, Schering AG, Berlin, Germany) (42,43). Both T2*-based as well as T1-based perfusion models are applied depending on the relaxation properties of the agent. For the first, double echo T2* sequences should be used to correct for superimposing effects of T1 shortening, while saturation recovery GRE sequences are applied for the latter to ensure a linear relationship between signal intensity and contrast media concentration for a certain range of concentrations. In both cases, the principles of indicator dilution theory can be applied. The regional renal blood volume of the renal cortex can be estimated from the magnitude of the resulting tissue response curve. Assessment of regional renal blood flow in absolute values of mL/100 g of tissue per minute requires the determination of an input function from either the aorta or preferably the renal artery itself (42). The signal of the determined tissue response curve in the cortex of the kidneys needs to be deconvoluted by the signal of the input function in order to calculate the residual function from which the mean transit time can be computed. Regional renal blood flow is calculated from regional renal blood volume divided by the mean transit time. While several of these agents (both gadolinium-chelate–based and iron-oxide–based) are currently being evaluated in phase 2 and phase 3 trials, none of them have been approved for clinical use yet outside control trials.
With the use of faster MR techniques, semiquantitative assessment of renoparenchymal perfusion with standard extracellular, nonintravascular gadolinium chelates have now become feasible (34). Whereas absolute quantification of renal perfusion is much more difficult due to the rapid excretion of the contrast agent, this type of contrast agent better resembles the sequence of perfusion, filtration, and excretion known from nuclear medicine studies. Recent publications proposed the use of a VIBE sequence for CE MRP with a 2 mL Gd-DTPA bolus and temporal resolution of 2 seconds per image (44). The higher the achievable temporal resolution, the more exact will be the calculation of the perfusion parameters. From these data, signal-intensity versus time (SIVT) curves over user-defined regions of interest (ROI), different parameters can be derived. Since Gd-DTPA behaves at the glomerulus like 99Tc-MAG3, the nuclear medicine marker for renal function, SIVT curves can be analyzed like nuclear medicine studies, which leads to the split renal function (45,46). Fitting the first pass of the SIVT curves with a Gamma variate fit delivers semiquantitative parameters such as mean transit time (MTT), time to maximal signal intensity (Tmax), the maximal upslope steepness (MUS), and the maximal signal intensity (MSI). In order to obtain absolute quantitative perfusion parameters, the renal SIVT curve has to be deconvoluted with the input function that is in the best case the SIVT curve of the renal artery. Due to practicability reasons, the SIVT curve of the aorta is commonly chosen instead. Deconvolution is a complicated mathematical process, which is probably the main obstacle for widespread use of these techniques. It can be easier calculated with intravascular contrast agents that do not leave the vessel bed immediately (33,42,43). For accurate semiquantitative perfusion measurements, sequences with a high linearity between signal intensity and contrast media dose should be applied. The most commonly used type of sequence is a saturation-recovery (SR) Turbo FLASH sequence (47) with a high temporal resolution of 4 slices per second. For the saturation recovery, a series of 90° pulses in a phase angle of 90° is applied, which minimizes inflow-effects and grants good signal linearity. The four slices assure good coverage of the renal parenchyma. The total acquisition time amounts to 5 minutes to cover the first pass as well as the filtration of the contrast agent (Fig. 20-15).
Contrast Medium
Overall, the contrast media administration for 3D Gd-MRA is relatively standardized. Contrast media dose and injection rate mainly depend on the type of contrast media that is used.
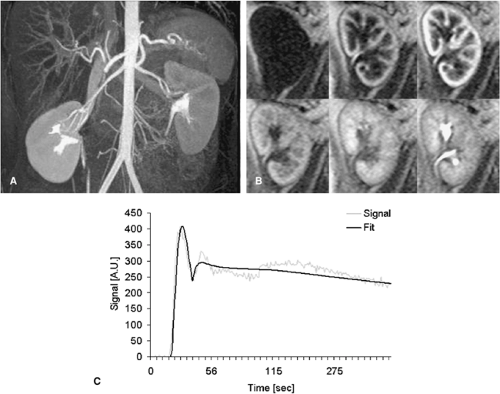 Figure 20-15 Renal MRA of a 29-year-old patient demonstrating a normal anatomy. A: The renal vessels can be seen up to the second-order branches. Due to the previous perfusion measurements and the test bolus measurement, there is already excretion of the contrast agent bilaterally. B: Exemplary images taken from the renal perfusion measurement in a healthy patient using the SR Turbo FLASH sequence with high temporal resolution. Displayed from left upper to right lower image: unenhanced scan before the arrival of the contrast agent followed by arrival of the contrast agent in the renal cortex. In the next phase, the renal medulla also is enhanced; the medullar pyramids enhance until the contrast agent is finally excreted. From this perfusion scan, a signal intensity versus time curve (C) can be derived from the renal cortex. The figure shows the actually measured points (signal) and the gamma variate fit curve (fit). The gamma variate fit of a healthy kidney shows a step upslope with a marked first-pass perfusion peak which is followed by another small peak, which represents the recirculation of the contrast agent bolus. The signal from the cortex, then, slowly decays due to filtration and excretion of the contrast agent. |
Standard Extracellular Gadolinium Chelates
Standard gadolinium chelates are typically administered at a dose of 0.2 mmol/kg BW with typical injection rates of 1 to 2 mL/second. Some authors also found sufficient image quality with 0.1 mmol/kg BW of standard gadolinium chelates (48). An injection rate of less than 1 mL/second results in a poor bolus profile with consequent poor vessel-to-background contrast. Injection rates exceeding 3 mL/second already cause saturation effects with no further increase in signal intensity but less homogenous contrast throughout the entire acquisition since the bolus travels too rapidly to match the entire 20- second-acquisition of the scan. However, faster acquisition is acceptable with time-resolved approaches, since each of the individual phases only requires a fraction of the bolus passage for optimum contrast enhancement.
Extracellular Nonintravascular Gadolinium Chelates with Special Properties
These agents have similar pharmacokinetics than the previous group; however, they are characterized by higher relaxivity for various reasons. Two of these agents are approved
in Europe for CE MRA, namely Gadobutrol (Gadovist, Schering, Germany) and Gadobenate-Dimeglumine (Multihance, Bracco, Italy). While Gadobutrol inherits higher T1-relaxivity due to a double concentration compared with the standard Gadopentetate-Dimeglumine (Magnevist), the higher relaxivity of Multihance is related to a weak protein-binding affinity to albumin (Fig. 20-16).
in Europe for CE MRA, namely Gadobutrol (Gadovist, Schering, Germany) and Gadobenate-Dimeglumine (Multihance, Bracco, Italy). While Gadobutrol inherits higher T1-relaxivity due to a double concentration compared with the standard Gadopentetate-Dimeglumine (Magnevist), the higher relaxivity of Multihance is related to a weak protein-binding affinity to albumin (Fig. 20-16).
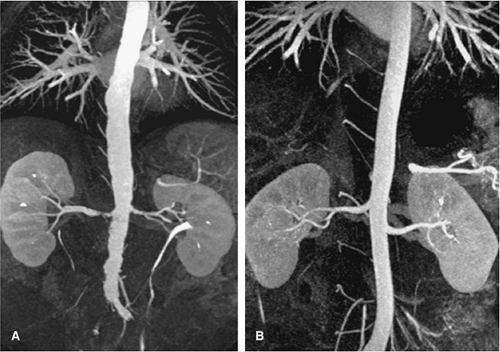 Figure 20-16 Comparison of gadobutrol- and Gd-BOPTA-enhanced MRA. A: Three-dimensional MRA of a 47-year-old male with hypertension and right-sided high-grade RAS acquired with 0.15 mmol/kg BW gadobutrol. B: MRA of a 32-year-old male patient with hypertension but no renal artery lesion. For this study, 0.15 mmol/kg BW Gd-BOPTA were administered. Both acquisitions had submillimeter spatial resolution and were acquired using parallel imaging techniques. While the former was acquired with an acceleration factor of 2, the latter was acquired with an acceleration factor of 3. |
Many trials have been performed to assess the performance of these agents in terms of dosage and vascular signal intensity. In general, half of the contrast media dose (0.1 mmol/kg BW) is sufficient to equal the results compared with standard gadolinium chelates for CE MRA of the renal arteries (49). At this time, no significant differences between Gadovist and Multihance have been found regarding image quality (49,50). However, injection becomes more difficult, as the smaller contrast media bolus has to be even better synchronized with the MR acquisition to ensure homogenous contrast media plateau during the filling of the center of the k-space. The fraction of protein-bound contrast media of Multihance increases in the equilibrium phase, preserving the arterial plateau phase to a certain extent. Thus, this agent has advantages for long high-resolution 3D acquisitions such as for elliptical centric acquisitions. On the other hand, Gadobutrol, with its very high relaxivity in the first-pass but short plateau phase, is particularly well suited for fast time-resolved acquisitions. With the advent of parallel acquisition techniques, these agents play a larger role than previously thought. With the use of an acceleration factor of 2, SNR of the acquisition is approximately reduced by a square root of 2. If the acquisition time is kept constant but spatial resolution is doubled, the SNR is again reduced by a square root of 2. Thus, with the use of parallel acquisition techniques and doubling of the spatial resolution at the same time, the SNR of the measurement drops by approximately 50%. In this setting, new gadolinium chelates such as Multihance or Gadovist are important to regain more signal due to their higher relaxivity (49). This, however, seems to require a higher dose than 0.1 mmol/kg BW at the moment to adjust for additional loss of SNR as well as the relatively long scan times of high-resolution MRA.
Intravascular Contrast Agents
The only intravascular contrast agent that is likely to be approved in the near term for CE MRA is MS-325 (Epix Pharmaceuticals, Cambridge, MA, USA). This agent has the advantage that it is both useful for first-pass dynamic CE
MRA and for high-resolution MRA in the steady state. Timing and contrast media injection for the first pass are similar to standard gadolinium chelates with injection rates of about 1 to 2 mL/second. With the advent of motion correction by navigators positioned on the diaphragm, free-breathing 3D CE MRI can now be performed in the steady state with acquisition times of several minutes and a spatial resolution of less than 0.8 mm. One problem for this steady-state high-resolution MRA is artery-vein separation, which is usually possible for the extrarenal arterial vascular tree by means of curved planar reformats. However, intrarenal separation of more distal segmental arteries and veins requires dedicated software that is not yet widely commercially available.
MRA and for high-resolution MRA in the steady state. Timing and contrast media injection for the first pass are similar to standard gadolinium chelates with injection rates of about 1 to 2 mL/second. With the advent of motion correction by navigators positioned on the diaphragm, free-breathing 3D CE MRI can now be performed in the steady state with acquisition times of several minutes and a spatial resolution of less than 0.8 mm. One problem for this steady-state high-resolution MRA is artery-vein separation, which is usually possible for the extrarenal arterial vascular tree by means of curved planar reformats. However, intrarenal separation of more distal segmental arteries and veins requires dedicated software that is not yet widely commercially available.
Integration of Renal Artery Injection Protocols into Moving Table Techniques
Frequently, the evaluation of the renal artery is integrated into moving table techniques of the peripheral arteries or into whole-body MRI protocols. For imaging of the renal arteries as part of a peripheral MRI protocol, the injection is usually carried out with biphasic injection protocol with two different injection rates to ensure a bolus travel to the periphery as slow as possible. By this, usually the first half of the dose is injected at 1 mL/second to still achieve a sufficient bolus profile for the renal arteries and then reduced to about 0.5 mL/second to ensure slow but constant flow into the periphery (51). Many other authors now, however, use the so-called hybrid techniques, in which vessel territories prone to venous overlay such as the distal calves and feet are imaged first followed by a moving table technique with imaging of the renal arteries (52). Due to better surface coils and concomitant reduction of the contrast media dose to 0.1 mmol/kg BW, it is no problem to image the renal arteries with good arterial-to-background contrast after previous injection for the calves. This technique is also applied for state-of-the-art whole-body MRI protocols with high spatial resolution in which the carotids and feet are imaged first, followed by a separate injection for the renal arteries and abdomen.
Saline Flush
The administration of contrast agent is always followed by a saline flush of 20 to 30 mL at the same injection rate as the contrast agent. The saline flush guarantees that all of the contrast agent is administered to the patient. Larger amounts of saline can be used for MR urography to enhance the renal excretion. Up to 400 mL of saline can be applied for this indication. Alternatively, 10 mg of furosemide can be intravenously delivered. Administration of contrast agent and saline are best done using an MR compatible injector pump. By this means, a constant flow and a continuous injection without interruption are guaranteed. The constant injection rate provided by the injection pump also allows for good bolus geometry without greater bolus dispersion.
Triphasic Imaging for Parenchymal Enhancement and Magnetic Resonance Urography
Since extracellular contrast agents are freely filtered by the kidneys, excretion of the contrast agent begins virtually after the first pass. To monitor the excretion of the contrast agent, heavily T1-weighted (T1W) sequences such as 3D GRE sequences (vendor acronyms: GRASS, FLASH, FAST) are suitable. Repetitive imaging of the kidneys allows monitoring the arrival of the contrast agent in the kidneys and the excretion of the contrast agent. The time intervals used for imaging depend on the clinical indication. If a dynamic urography is desired, repetitive imaging every 30 to 60 seconds can be performed. By this means, obstruction of the urinary system and their relevance for the urine flow can be obtained. Delayed phase images at least 5 minutes later are necessary to detect excretion, and even later in the kidney with heavily impaired function, which may show considerable delay of excretion.
Postprocessing
Subtraction
Subtraction is a technique that improves vessel-to-background contrast due to elimination of the background signal. This method is routinely used for the peripheral arteries. An important prerequisite for an accurate subtracted data set is that there is no motion occurring between acquisition of the mask and the contrast-enhanced data set. It is known that the depth of inspiration is not absolutely identical between multiple breath-holds. Mask subtraction, therefore, may cause inconsistencies at the margins of the vessel, which are substantial in the case of data sets with a high spatial resolution. This technique should only be reserved for visualization purposes such as MIP display, while exact grading of RAS should be performed on the unsubtracted source images (53).
Three-dimensional Postprocessing
MIP and VR should be reserved for 3D display of complex vascular anatomy. In particular, this approach is helpful to identify accessory renal arteries and renal aneurysms, to resolve the complex courses of transplant arteries and veins, and to identify atypical bypass grafts after surgery. Thick volume MIPs should not be used to grade RAS or to identify renal dissections, since this algorithm only uses the voxel with the highest signal intensity along a certain projection. Thus, other bright structures such as overlaying vessels
or aliased fat might erroneously mimic a patent renal artery on a MIP image. VR is a better algorithm, as it allows weighing the contributions from the different signal intensities. Nevertheless, this algorithm is not accurate enough for grading of RAS on MR imaging (54,55). This can be mainly explained by two facts—the typical tortuous course of the renal artery inducing geometric distortions and the eccentricity of atherosclerotic plaques (56).
or aliased fat might erroneously mimic a patent renal artery on a MIP image. VR is a better algorithm, as it allows weighing the contributions from the different signal intensities. Nevertheless, this algorithm is not accurate enough for grading of RAS on MR imaging (54,55). This can be mainly explained by two facts—the typical tortuous course of the renal artery inducing geometric distortions and the eccentricity of atherosclerotic plaques (56).
The renal arteries typically take an oblique course in all three dimensions after originating from the ostium with an initial anterior curve followed by a more cranial and posterior direction. Atherosclerotic changes tend to occur in the proximal segment, predominantly in the anterior or posterior wall, usually resulting in a more oval or irregular shape of the stenosis rather than a round residual lumen (56). Therefore, image reconstruction of the 3D Gd-MRA data sets usually consists of thin, 5 to 10 mm subvolume MIPs based on MPR along the vessel axis. The entire course of the vessel should be displayed in both the axial and coronal view. Due to the isotropic spatial resolution, cross-sectional reformats are then performed perpendicular to the vessel axis in order to assess the reduction of the vessel area at the site of the stenosis or to detect a membrane in case of renal artery dissection.
Image Analysis for Grading of Renal Artery Stenosis
Grading of RAS has to be carried out particularly carefully to obtain accurate and reproducible results. The methods for stenosis grading have evolved over time along with the improvements of spatial resolution.
Image analysis usually includes the grading of the degree of stenosis as well as the assessment of vessel visibility. Before the observer turns to the stenosis grading, he should assess the entire renal artery with respect to its visibility. Vessel visibility is usually scored for the ostium of the renal artery as well as the proximal, distal, hilar, and intrarenal segments. A three-point ordinal scale scoring the visibility as either “not identified,” “identified but poorly defined,” or “clearly defined with definite evaluation of patency” helps to communicate if this particular vessel segment can at all be evaluated for the presence or absence of a RAS (30).
Absolute measurements of the degree of stenosis can be difficult because of limited spatial resolution. Therefore, a modified grading schema with a five-point ordinal scale has usually been applied grading the stenosis as either “not present,” “less than 50%,” “equal to or greater than 50%,” “greater than 75%” or “occlusion.”
Current high spatial resolution 3D data sets allow measurement of the degree of RAS both in the in-plane view along the vessel axis as well as on the cross-sectional images. Based on the North American Symptomatic Carotid Endarterectomy Trial (NASCET) criteria, the maximal stenosis is then defined as the ratio between the narrowest diameter within the stenosis and the diameter of the nearest normal segment of the main renal artery downstream (1 – [narrowest renal artery diameter/diameter normal distal main renal artery]) ÷ 100%).
In addition, the presence and number of accessory renal arteries should be assessed. Due to the limited spatial resolution of 3D Gd-MRA, stenosis grading is difficult and can usually only be performed on a two-point scale as either “absent/low grade” or “high-grade.”
Anatomy
Normal Anatomy
Normal Arterial Anatomy
Main Renal Arteries
In around 75% of individuals, the renal arteries arise from the aorta immediately below the superior mesenteric artery at the level of the L1-L2 intervertebral disk space, while in the remainder, they may originate anywhere between the lower margins of T12 and L2. Their position is lower in older individuals. Usually, the renal artery ostium is located in the lateral or ventrolateral aspect of the aortic wall, and the renal artery then turns posteriorly in an obtuse angle.
The right renal artery originates closer to the ventral surface in more than 50% of the cases and the left in around 25% of individuals. Location of the orifice in the posterior lateral aortic wall is infrequent and usually involves the left renal artery. The right renal artery passes behind the inferior vena cava, renal vein, duodenum, and pancreatic head.
The left renal artery also lies behind the pancreatic body and renal and splenic veins. In around 60% of individuals, the renal artery divides at the renal hilus, whereas in approximately 15% of the cases an early bifurcation is present (Fig. 20-17).
Intrarenal Branches
It is important to note that the kidney is divided into five vascular segments, which are separately supplied by segmental renal arteries. These segments are called apical upper, middle, posterior, and lower segments. The posterior segment comprises the majority of the posterior surface of the kidney, whereas the upper and middle segments are only contributing to the anterior surface. The apical and lower segments have both an anterior and a posterior surface
component. At the hilus, the renal artery divides into anterior and posterior divisions. Usually, the anterior division supplies the apical, upper, middle, and lower segments and the posterior division supplies the posterior segment. The latter artery courses behind the renal pelvis.
component. At the hilus, the renal artery divides into anterior and posterior divisions. Usually, the anterior division supplies the apical, upper, middle, and lower segments and the posterior division supplies the posterior segment. The latter artery courses behind the renal pelvis.
 Figure 20-17 Coronal MIP view of the abdominal vessels in a 62-year-old male patient with hypertension. There is early (prehilar) branching immediately at the origin of the right renal artery (arrow). There is also low-grade stenosis of the left proximal renal artery. |
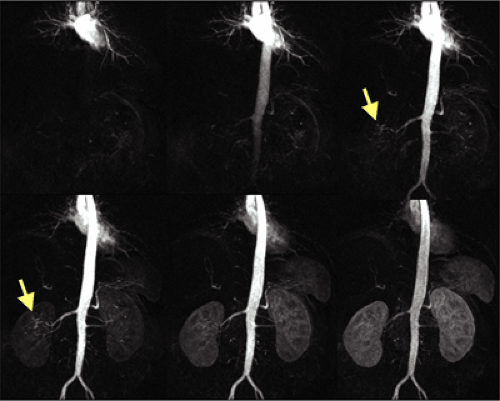 Figure 20-18 Coronal MIP view of a TREAT MRA acquired at 3.0 T with a temporal resolution of 1.4 second/3D data set. The high temporal resolution allows to depict the intrarenal branches of the renal arteries (arrows). (Courtesy of J. Paul Finn, M.D., University of California in Los Angeles.) |
The segmental artery divides into lobar arteries, which further subdivide into two or three interlobar arteries that are located between the renal pyramids. For visualization on MRA or CTA, it is important to note that the proximal interlobar arteries are extraparenchymal and therefore can be seen on time-resolved MRA and CTA. At the corticomedullar junction, a dichotomous branching into arcuate arteries occurs.
The arcuate arteries essentially are end arteries that do not anastomose with each other but subdivide into interlobular arteries, which themselves subdivide and give rise to the afferent glomerular arterioles. Some interlobar arteries penetrate the renal surface as so-called perforating arteries.
On high-resolution CE MRA, usually only the extrarenal segments as well as the anterior and posterior divisions and the proximal aspects of the segmental renal arteries are well seen. The distal segmental arteries are already in close relationship to the renal parenchyma and thus are usually overlaid by enhancement of the latter on single-phase examinations. On time-resolved multiphase MRA, a better visualization of the anterior and posterior divisions as well as the segmental renal arteries has been achieved particularly for the upper and middle segmental artery. The interlobar arteries can be just identified in the proximal parts but cannot be further followed to their subsequent branches due to the small vessel caliber of less than 1 mm in size and the embedding into the renal parenchyma (Fig. 20-18).
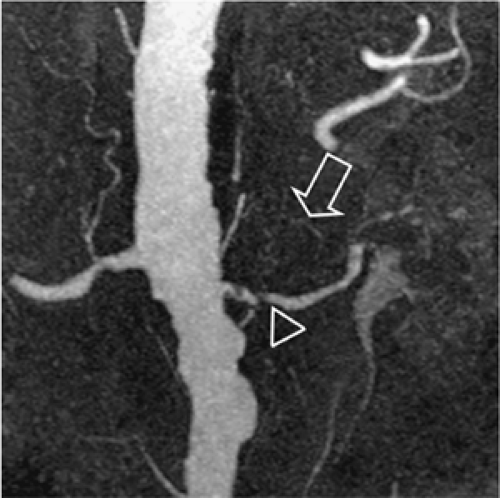 Figure 20-19 Coronal MIP view of the MRA of an 82-year-old male patient with chronic occlusion of the left renal artery (arrowhead). However, the perfusion of the left kidney is preserved by multiple thin retroperitoneal vessels (one of which is marked by the arrow). |
Extrarenal Branches
During the extrarenal course, the renal artery gives off several branches, which are only inconsistently seen on CE MRA due to their small caliber. These include the inferior adrenal arteries, which may be solitary or may consist of several arteries. In addition, branches to the perinephric tissues and renal pelvis as well as the proximal ureter arise. Also, the gonadal arteries to the ovaries and testes can arise from the renal arteries.
Capsular Arteries
Capsular arteries usually play no substantial role for the angiographic evaluation of the kidney. However, they can be of high importance in cases of renal artery occlusion or RAS (Fig. 20-19). The three capsular arteries arise from a capsular network that anastomoses freely with perforating arteries and other retroperitoneal arteries, especially lumbar, but also with internal iliac, intercostal, and mesenteric arteries. Thus, these capsular arteries may supply the kidney completely in cases of RAS or occlusion. The capsular arteries either arise from the main renal artery (middle capsular artery) or from other branches such as those of the inferior adrenal artery (superior capsular artery) or the gonadal artery (inferior capsular artery).
Vascular Supply to the Pelvis and Ureters
The renal pelvis is supplied by short branches arising directly from the interlobar and arcuate arteries and occasionally the main renal artery. These branches anastomose with each other and with ureteral branches, thus forming an important intrarenal collateral pathway. The ureters are supplied by small ureteral branches from the renal artery, directly from the aorta, and from the gonadal arteries. The lower ureter receives blood supply from branches of the common and internal iliac arteries. Longitudinal anastomoses are present along the ureteral wall and provide a collateral pathway.
Perforating Vessels
The perforating vessels are an important collateral pathway to the kidney in the presence of main renal artery obstruction. The perforating arteries may arise from the interlobar, arcuate, or lobar arteries and are accompanied by a vein. As previously mentioned, they anastomose with the capsular arteries and other retroperitoneal arteries.
Normal Venous Anatomy
The intrarenal veins usually accompany the same-named arteries but are usually larger. The arcuate veins join to form the larger vein spot, which do not have a lobar organization, and three to five of those veins form the main renal vein. The right renal vein is 2 to 4 cm in length and joins the inferior vena cava at the same level of the lower third of L1. The left renal vein is 4 to 11 cm in length with a relatively horizontal course in most individuals. It frequently joins the inferior vena cava at a slightly higher lever than the right renal vein.
Asymptomatic Variant Anatomy
Variant Arterial Anatomy
Overall, the renal arteries show a high incidence of variant anatomy (about 40% of the general population), including multiple arteries and early division. Renal arteries can arise anywhere from the proximal abdominal aorta to the iliac arteries, depending on additional variants of the kidney. Thus, imaging must extend from the celiac origin through the bifurcation of the common iliac arteries.
Stay updated, free articles. Join our Telegram channel

Full access? Get Clinical Tree


