12
Quantitative and Semiquantitative Echocardiography
Ventricular and Valvular Physiology
 Introduction
After a slow start following its introduction in the 1970s, 1 transesophageal echocardiography (TEE) gradually joined mainstream echocardiography and became a staple in cardiac surgical operating rooms from the early 1990s onward.2,3 With rapid developments in TEE over the last decade, it has become an indispensable intraoperative imaging tool. Its anatomic proximity to the heart and high-frequency transducer enable high-quality images and make TEE ideal for assessment of cardiac function. With the chest usually unavailable for scanning in the surgical setting, TEE becomes the imaging modality of choice. Both ventricles are well visualized in multiple views in the midesophageal (ME) and transgastric (TG) positions, allowing for a comprehensive assessment of structure and function in a quantitative and qualitative manner.
 Ventricular Function in Systole and Diastole
Background
Optimal myocardial performance includes the capacity of the ventricle to appropriately contract in systole and relax during diastole. At the molecular level, ventricular systolic contraction is initiated by an increase in the cytosolic levels of calcium and enhanced interaction between calcium ions and the contractile proteins actin and myosin. 4 During the diastolic period, levels of cytosolic calcium must fall, leading to the relaxation phase. A schematic view of the cardiac cycle is shown in Figure 12-1.
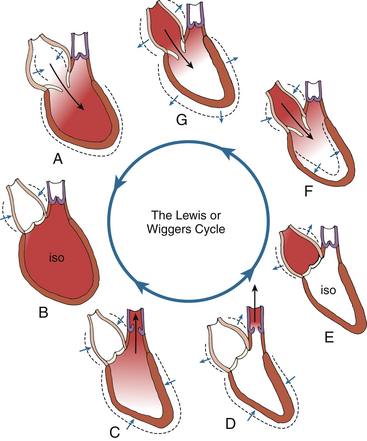
Figure 12-1 Visual phases of cardiac cycle. iso, Isovolumic. (Adapted from Shepherd JT, Vanhoutte PM. The Human Cardiovascular System. New York: Raven Press; 1979:68.)
Numerous factors determine left ventricular (LV) myocardial performance. These include loading conditions, the contractile state, and the heart rate. Preload reflects the venous filling pressure that fills the left atrium (LA) and subsequently the LV. In response to an increase in the preload, the LV volume increases, stretching the ventricular myocardium, which leads to an increase in the force of contraction (Frank-Starling mechanism) with a resultant increase in stroke volume. 5 An increase in atrial volume stimulates the atrial mechanoreceptors, causing an increase in heart rate and cardiac output.
Interdependence of the LV and right ventricle (RV) is an important phenomenon that also influences myocardial function during the cardiac cycle. 6 Distention of one ventricle owing to increased filling pressures can directly limit diastolic filling of the other ventricle, partly because of pericardial restraint. This eventually results in impaired relaxation of the other ventricle.
Left Ventricular Systolic Function
Contraction Patterns and Pressure-Volume Relationships
Evaluation of systolic function is one of the most frequently performed indications for echocardiography. It is an important component of information gathered by the echocardiographer during the initial TEE examination in the perioperative period. Therefore, an understanding of the physiology of the cardiac cycle, especially pressure-volume relationships, is crucial when utilizing the different methods of assessing global ventricular function. The relationship between LA and LV pressure during each phase of the cardiac cycle is shown in Figure 12-2.
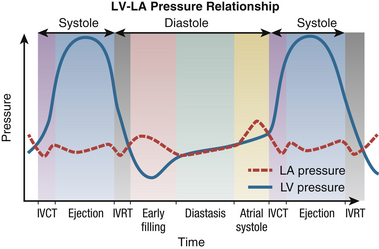
Figure 12-2 Relationship between left atrium and left ventricle throughout various phases of cardiac cycle. IVCT, Isovolumic contraction time; IVRT, isovolumic relaxation time; LA, left atrium; LV, left ventricle.
During LV ejection, the intraventricular pressure rises to a peak and then starts to decline. This decline is a result of the decrease in the cytosolic calcium ion concentration due to uptake of calcium into the sarcoplasmic reticulum. 4 Therefore, an increasing number of myofibers enter a state of relaxation, with a consequent decrease in the rate of ejection of blood from the LV. At the end of LV ejection, the LV pressure falls below the aortic pressure, leading to aortic valve closure and the start of diastole.
The subsequent phases correspond to mitral valve opening and early LV filling. As pressure in the atrium and ventricle equilibrates, LV filling ceases. Further filling of the LV is provided by contraction of the LA. At the end of atrial systole, mechanical events outlined previously lead to an increase in LV pressure that result in mitral valve closure and subsequent IVCT.
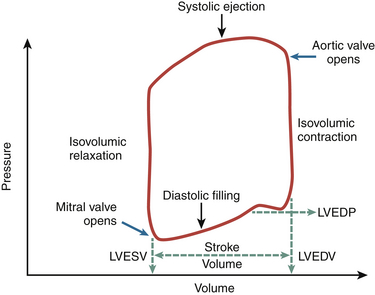
The pressure changes in the LA and LV profoundly affect the amount of volume the LV can accept in diastole and then eject in systole. Impairment of diastolic function can lead to a requirement of higher filling pressures to maintain a given volume of ejection. Similarly, impairment in systolic function directly affects the resulting stroke volume. The pressure-volume relationship of the LV is shown in Figure 12-3.
Chamber Dimensions
LV wall thickness can be quantified by obtaining linear measurements of the septal wall thickness (SWT) and posterior wall thickness (PWT) at end-diastole. 7 With TEE, these measurements may be made using M-mode or 2D imaging. The advantage of M-mode is its high temporal resolution, which helps distinctly identify end-diastole, whereas 2D imaging with its lower frame rate may miss the exact end-diastolic time point. However, this “inaccuracy” may be clinically insignificant. Conversely, accuracy in M-mode imaging can be limited by a tendency for the cursor to be misaligned with the correct axis of the ventricle, whereas 2D imaging overcomes the angle limitation. By convention, SWT and PWT are measured using the parasternal long-axis view in transthoracic imaging, which is suitable for both M-mode and 2D linear measurements ( Fig. 12-4, A). With TEE, however, the TG mid–short-axis view enables SWT measurement at the midseptum and PWT at the inferolateral segment. 7 Neither positions in TEE imaging allow M-mode imaging to be used for accurate measurement ( Fig. 12-4, B). It is important to exclude the papillary muscle in this view when measuring wall thickness.
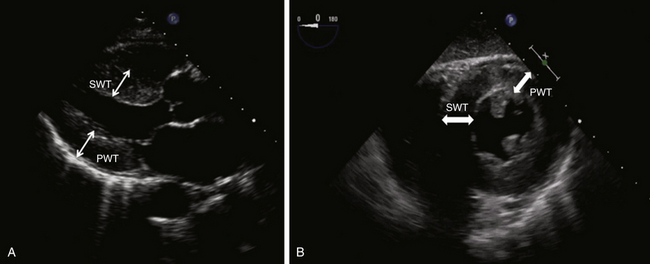
Figure 12-4 Measurement of left ventricular wall thickness with transthoracic (A) and transesophageal (B) echocardiography. See text for details. PWT, Posterior wall thickness; SWT, septal wall thickness.
Internal dimensions of the LV can be obtained from ME two-chamber and TG two-chamber views ( Fig. 12-5). The internal LV diameter is measured from the anterior wall to the inferior wall at the junction of the basal and middle thirds of the long axis of the LV. Care must be taken to ensure that foreshortening of the LV is avoided in these views and the maximum obtainable diameter is measured.
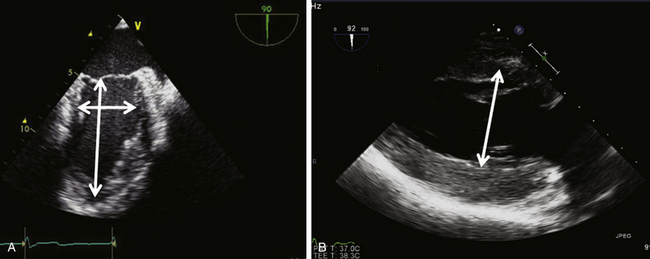
Figure 12-5 Measurement of left ventricular internal dimensions in (A) midesophageal two-chamber view and (B) transgastric two-chamber view.
Estimation of LV mass is less commonly used in clinical practice and more commonly with transthoracic echocardiography (TTE) in population studies that examine trends and cardiovascular responses to antihypertensive therapies. The formula for estimating LV mass is based on the prolate ellipsoid model and is the method recommended by the American Society of Echocardiography (ASE): 7
where 1.04 is the specific density of the myocardium, LVID is left ventricular internal diameter, PWT is posterior wall thickness, and IVST is interventricular septal thickness. The numbers 0.8 and 0.6 are correction factors.
As can be seen in this formula, errors in measurement have profound effects on the calculated LV mass, since critical measured values are cubed.
Volumetric Parameters
To obtain volumetric measurements, the most important views for 2D quantitation are the midpapillary short-axis view and the apical four- and two-chamber views. Volumetric measurements require manual tracing of the endocardial border. Accurate measurements require optimal visualization of the endocardial border to minimize the need for extrapolation. It is recommended that the basal border of the LV cavity area be delineated by a straight line connecting the mitral valve insertions at the lateral and septal borders of the annulus on the four-chamber view and the anterior and inferior annular borders on the two-chamber view. 7
Simpson Method
One of the most commonly used methods for LV volume estimation is the biplane method of disks that follows the modified Simpson rule. While it makes some geometric assumptions about the shape of the LV, it remains the method of choice recommended by the ASE. 7
The Simpson rule states that volume can be calculated by dividing a 3D object into slices of known thickness and surface area. The volume of the object is equal to the sum of the volumes of each slice. It divides the ventricular cavity into multiple cylindrical slices (disks) of known volume, with the sum representing LV volume. The height of each disk is calculated as a fraction (usually 1/20) of the LV long axis based on the longer of the two lengths from the two- and four-chamber views. The cross-sectional area of the disk is based on the two diameters obtained from the two- and four-chamber views:
where D1 and D2 are orthogonal diameters of the cylinder and H is the longer of the two lengths from the two- and four-chamber views. The volume of the cylinders are calculated and summed to estimate ventricular volume. Most new models of echocardiography machines calculate the end-diastolic and end-systolic volumes and ejection fraction automatically after the echocardiographer traces the endocardium in specified views ( Fig. 12-6, Video 12-1).
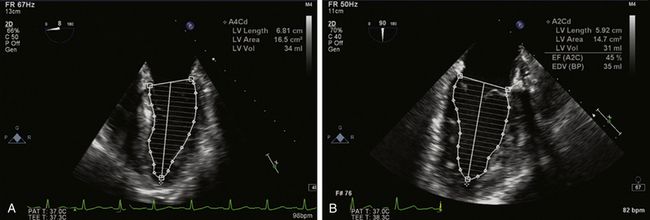
Figure 12-6 Assessment of left ventricular (LV) volume using the Simpson method of disks. A, LV endocardium traced in end-diastole in midesophageal (ME) four-chamber view. LV area, length, and volume are automated calculations. B, Similar tracing in ME two-chamber view. These measurements are repeated in each view in end-systolic frames (not shown). End-diastolic and end-systolic volumes are averaged from both views and ejection fraction automatically calculated.
Area-Length Method
where V is the volume and area and length are as defined in the text.
As in the Simpson method of disks, papillary muscles should be excluded in the linear measurements. While reasonably accurate, there are certain limitations. The method assumes that the LV is elliptical in shape. Therefore, it should not be the method of choice in conditions where the shape of the LV is distorted, such as asymmetric septal hypertrophy, LV aneurysm, and dilated cardiomyopathy. 7
Three-Dimensional Assessment
Although the concept of 3D echocardiography was first introduced in the early 1970s, its utility in the perioperative environment has only recently acquired appropriate recognition. With the availability of RT-3D TEE, volumetric assessment of the LV can be done relatively quickly, with accuracy comparable to the best quantification techniques available. 8
The ability to track the endocardium in three dimensions rather than two (as in the Simpson method of disks) makes 3D more suitable when geometric assumptions of LV shape cannot be met, as in LV aneurysms, regional infarction, and dilated cardiomyopathies. The rotate and crop features of 3D imaging without any directional restriction enables an infinite number of viewing perspectives of cardiac infrastructure and is a significant advantage over 2D imaging ( Fig. 12-7). 8
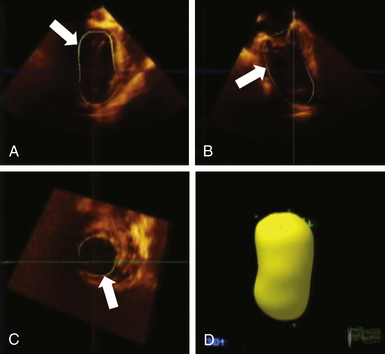
Figure 12-7 Assessment of left ventricular volumes using three-dimensional echocardiography. Following acquisition of full-volume dataset, specific endocardial points are marked on end-systolic and end-diastolic frames, and software automatically tracks endocardial borders on each frame through one cardiac cycle. Borders can be manually adjusted and can be verified in each orthogonal plane (arrows in A, B, and C). Developed volumetric model is shown in D.
There is considerable enthusiasm pertaining to the utility of 3D TEE technology, but it is important to emphasize that currently, full ventricular volumes are too large to be captured in truly real-time display with the appropriate frame rate or temporal resolution. 8 It requires some degree of reconstruction from sequentially acquired smaller “live” datasets. This technology still relies on stable cardiac rhythms and respiratory and electrocardiographic gating to avoid “stitch” artifacts ( Fig. 12-8, Video 12-2). Additionally, the time and expertise required for full-volume acquisition, reconstruction, and “editing” may be challenging in the perioperative setting. 9
Ejection Phase Parameters
Initial attempts to assess LV systolic function involved only linear measurements, such as the LV internal dimension in diastole and systole, from which parameters such as fractional shortening and velocity of circumferential shortening could be derived. In the presence of normal ventricular geometry and symmetric function, linear measurements from M-mode and 2D images provide reasonable assessment of ventricular function. They have also proven to be fairly reproducible, with low intraobserver and interobserver variability.10–12 However, linear measurements have the disadvantage of being able to determine ventricular function only along a single interrogation line.
Fractional Shortening
Although linear measures of LV function are considered inaccurate in the presence of regional abnormalities, patients with uncomplicated hypertension, obesity, or valvular diseases, rarely show regional variation in the absence of clinically recognized infarction. Therefore, fractional shortening (FS) and its relationship to end-systolic stress often provides useful information in the clinical setting. The lower limit of normal is 25% in men and 27% in women. 7
The formula for fractional shortening is based on M-mode measurements:
where LVIDd is left ventricular internal dimension in diastole and LVIDs is left ventricular internal dimension in systole.
Velocity of Circumferential Fiber Shortening
The formula for velocity of circumferential fiber shortening (VCFS) is:
Fractional Area Change
Fractional area change (FAC) is frequently used as a surrogate for LV ejection fraction. It measures the percentage of change in area of the ventricular dimension as an estimate of LV contractile performance. The FAC is usually obtained in the TG midpapillary view. Several studies have shown good correlation of FAC and other methods of quantifying ejection fraction, such as angiography and scintigraphy.13,14 However, it is also limited in accuracy in the presence of regional wall motion abnormalities and is more sensitive to changes in afterload than preload.
The formula for fractional area change (FAC) is:
where LVEDA is left ventricular area at end-diastole and LVESA is left ventricular area at end-systole.
Ejection Fraction
The formula for ejection fraction (EF) is:
where LVEDV is left ventricular volume at end-diastole and LVSDV is left ventricular volume at end-systole.
Three-dimensional echocardiography is now also widely used for volumetric assessment of the LV. As mentioned previously, acquisition of a full-volume dataset allows the system to use semiautomated methods to track the endocardial border throughout a single cardiac cycle and calculate dynamic volume changes in systole and diastole. This technique does not require geometric assumptions and is sensitive to regional abnormalities in wall motion or asymmetric contraction. However, acquisition of a satisfactory full-volume dataset is also dependent on a stable heart rhythm and absence of translational motion over a sequence of several cardiac cycles (see Video 12-3). 8
Assessment of Contractility
Isovolumetric Indicators
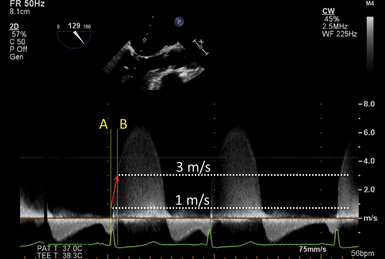
The rate of rise in ventricular pressure during systole that begins in the isovolumetric contraction phase is a more load-independent indicator of LV systolic function. This parameter is better known as dP/dt, and Doppler-derived measurements correlate well with catheter-based invasive measurements. With echocardiography, the measurement of dP/dt is dependent on a mitral regurgitation (MR) jet. The contour of the MR jet reflects the rate of rise of LV systolic pressure until its eventual peak velocity. The time the jet velocity takes to rise from 1 m/s to 3 m/s is considered to indicate the dP/dt ( Fig. 12-9). Since it is dependent on an MR jet and the stroke volume, this parameter is also preload sensitive. The corresponding pressure gradient at 1 and 3 m/s is 4 mmHg and 36 mmHg, calculated by the simplified Bernoulli equation [pressure gradient = 4 × (peak velocity) 2]. Therefore, the time taken for the pressure gradient to rise by 32 mmHg reflects the dP/dt according to the formula:
Normal values for this parameter are 1610 ± 290 mmHg/s. 15
Wall Stress
Ventricular wall stress is another parameter used to assess LV function. Unlike other clinical parameters, such as stroke volume and ejection fraction, wall stress is an index of LV performance that is considered afterload independent, since it accounts for both wall thickness and pressure generation. Wall stress can be calculated either regionally or globally using one of three methods: meridional (longitudinal), circumferential, or radial. In the perioperative period, calculation of stress, either regional or global, has had little utility and acceptance. Calculation of stress indexed to ventricular volume has been used as an index of ventricular performance in valvular heart disease and cardiomyopathy. 16
Tissue Characterization
For several years, 2D imaging and spectral Doppler analysis were the only methods available for quantification of LV function. More recently, advances in ultrasound technology have enabled more objective and accurate quantification of global and regional ventricular function. Improvements in temporal and spatial resolution allow examination of myocardial structure almost at the level of individual fibers and have provided new insights into the organization and function of the ventricle. 17 While these techniques have been developed and more extensively studied in TTE, increasing use of these tools in TEE is being reported.18,19
Tissue Velocity
Tissue velocity information can provide early clues to alterations in regional and global LV contractility. 20 Unlike conventional Doppler flow signals that are characterized by high velocity and low amplitude, myocardial motion signals are described as relatively low velocity and high amplitude. Tissue Doppler imaging (TDI) is now available on most ultrasound systems and can be used with TEE imaging as well (see Video 12-3). Current systems that feature TDI have built-in settings for the proper velocity scale and Doppler settings to selectively display the tissue velocities and filter flow signals.
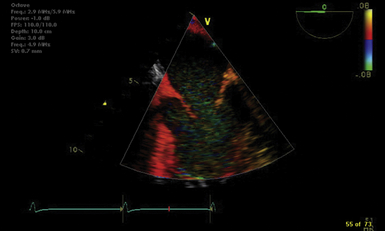
According to the Doppler principle, tissue velocities moving toward the transducer are positive, whereas velocities moving away from the transducer are negative ( Fig. 12-10). Three distinct velocity signals can be appreciated: peak systolic (S′), peak early diastolic (E′), and late diastolic (A′). The S′ velocity is a quick and reasonable means of estimating LV ejection fraction, and several studies have closely related S′ and LV ejection fraction. However, there are limited data in patients undergoing general anesthesia. Another modality of tissue Doppler is color TDI, where red encodes wall motion toward the transducer (positive velocities), and blue encodes wall motion away from the transducer (negative velocities). On either side of the scale, the brightest shades correspond to the highest velocities ( Fig. 12-11).
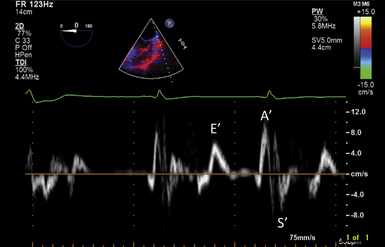
Figure 12-10 Tissue velocities at lateral mitral annulus measured using tissue Doppler imaging. E′ wave indicates tissue motion in early diastole; A′ wave corresponds to atrial contraction; S′ indicates systolic descent of annulus.
Ventricular Strain
Ventricular strain refers to the degree of deformation of a segment of myocardium as a result of its pattern of contraction. It is a dimensionless index and is measured according to a formula that accounts for the distance between two specified points in the myocardium and the change in their relative distance from each other through a single cardiac cycle ( Fig. 12-12). 21 Ventricular strain is defined by the formula:
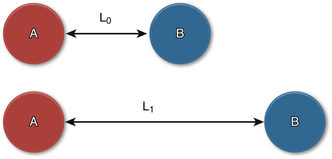
Figure 12-12 Ventricular strain. Points A and B are shown with relative distances between them before (at rest) and at peak systole. L0, Initial distance; L1, final distance.
where L0 is initial length (distance) and L1 is final length (distance). Therefore, lengthening is defined as a negative strain, whereas shortening is defined as a positive strain. The rate of change in strain is the strain rate, or:
Another technique for strain measurements that overcomes the angle limitations of Doppler strain is 2D strain. Points in the myocardium are identified by their unique signatures as ultrasound reflectors. The received signal is assigned a property by which the point (or speckle) can be tracked throughout the cardiac cycle until its return to baseline position (or coordinates). Tracking these speckles in real time can simultaneously reveal distance and velocity information along several points in the myocardium. It overcomes Doppler limitations and is the preferred technique for strain measurements ( Fig. 12-13, Video 12-5). 21
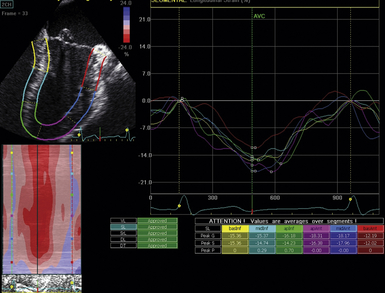
Figure 12-13 Ventricular strain measured using two-dimensional strain. Once myocardium is identified, automated algorithm tracks motion of myocardial reflectors throughout cardiac cycle and calculates strain in various dimensions. Calculation of longitudinal strain is shown here in midesophageal two-chamber view.

