13
Myocardial Ischemia and Aortic Atherosclerosis
Transesophageal echocardiography (TEE) has become a powerful diagnostic tool in the perioperative period. A recent updated report of practice guidelines for perioperative TEE by the American Society of Anesthesiologists (ASA) and the Society of Cardiovascular Anesthesiologists (SCA) recommends its use in all open heart surgeries and thoracic aortic procedures, and that its use be considered in coronary artery bypass grafting (CABG) surgeries. 1 This chapter will focus on TEE’s uses in the evaluation of perioperative myocardial ischemia, complications of coronary artery disease, and assessment of aortic atherosclerosis.
 Coronary Anatomy and Myocardial Function
The coronary arteries provide blood flow to the myocardium. They originate from the sinuses of Valsalva. The left main coronary artery gives rise to the left anterior descending coronary artery (LAD) and to the circumflex coronary artery from the left sinus of Valsalva. The LAD descends to the left ventricular (LV) apex in the anterior ventricular groove and gives diagonal and septal branches. The circumflex coronary artery courses laterally in the left atrioventricular groove, dividing into obtuse marginal branches. The right coronary artery (RCA) originates in the right sinus of Valsalva and descends medially in the right atrioventricular groove. The left main coronary and the right coronary arteries can sometimes be visualized at their origin in the sinuses of Valsalva in the midesophageal long-axis view and in the midesophageal short-axis view of the aortic valve ( Fig. 13-1).
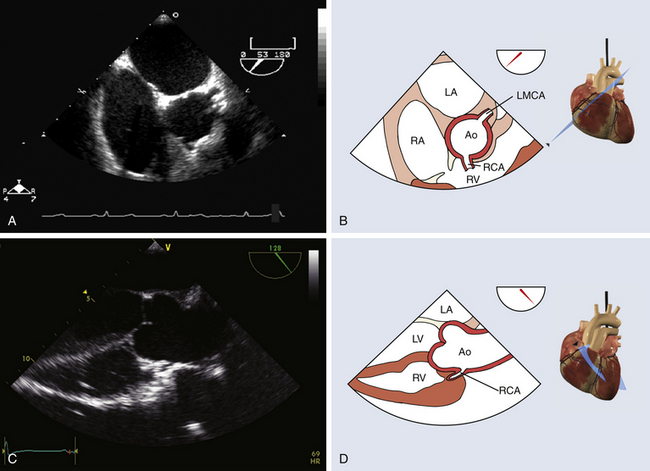
Figure 13-1 Coronary ostia. A and B, Midesophageal short-axis view of ascending aorta, with both coronary ostia visualized above aortic valve. C and D, Midesophageal long-axis view with proximal ascending aorta showing right coronary artery ostium. Ao, Aorta; LA, left atrium; LMCA, left main coronary artery; LV, left ventricle; RA, right atrium; RCA, right coronary artery; RV, right ventricle. (From Denault AY, Couture P, Vegas A, Buithieu J, Tardif J-C. Transesophageal Echocardiography Multimedia Manual. 2nd ed. New York: Informa Healthcare; 2011, with permission.)
Studies correlating coronary angiography and echocardiography have described the specific coronary perfusion of each LV segment. 2 The LAD supplies blood to the anterior segments of the interventricular septum (IVS), to the anterior LV free wall, and to the septal and anterior segments of the apex. The circumflex artery provides blood to the inferolateral and anterolateral LV segments as well as to the lateral apex. The RCA provides blood to the right ventricle, the LV inferior free wall, the inferior half of the septum, and the inferior apex. Given the coronary distribution, ischemic lesions will translate into regional wall motion abnormalities (WMAs) that can identify the coronary culprit ( Fig. 13-2).
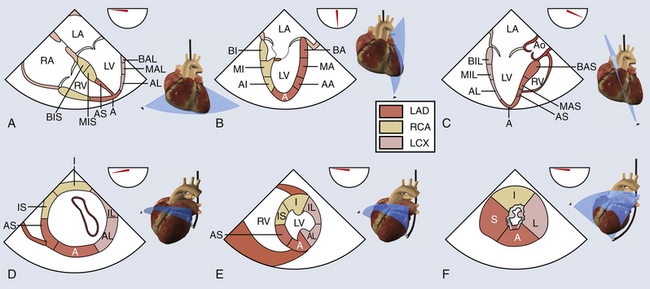
Figure 13-2 Left ventricular (LV) function. A, B, and C, Midesophageal views to evaluate right ventricular and LV function: four-chamber, two-chamber, and long-axis views. A, Apex; AA, apical anterior; AI, apical inferior; AL, apical lateral; Ao, aorta; AS, apical septal; BA, basal anterior; BAL, basal anterolateral; BAS, basal anteroseptal; BI, basal inferior; BIL, basal inferolateral; BIS, basal inferoseptal; LA, left atrium; LAD, left anterior descending; LCX, left circumflex artery; LV, left ventricle; MA, mid-anterior; MAL, mid-anterolateral; MAS, mid-anteroseptal; MI, mid-inferior; MIL, mid-inferolateral; MIS, mid-inferoseptal; RA, right atrium; RCA, right coronary artery; RV, right ventricle. D, E, and F, Basal, mid-, and apical transgastric short-axis views. A, Anterior; AL, anterolateral; AS, anteroseptal; I, inferior; IL, inferolateral; IS, inferoseptal; L, lateral; LAD, left anterior descending; LCX, left circumflex artery; LV, left ventricle; RCA, right coronary artery; RV, right ventricle; S, septal. (Adapted from Denault AY, Couture P, Vegas A, Buithieu J, Tardif J-C. Transesophageal Echocardiography Multimedia Manual. 2nd ed. New York: Informa Healthcare; 2011, with permission.)
 Myocardial Segments
The American Heart Association (AHA) recommends the use of the 17-segment model, 2 whereas the American Society of Echocardiography (ASE) recommends the use of the 16-segment model ( Fig. 13-3). 3 In both models, the LV is divided from its base to the apex into different levels or imaging planes: basal, midpapillary, apical and, in the AHA model, an apical cap that corresponds to the 17th segment. The levels correspond to the proximal, middle, and apical territories of the coronary arteries. The basal and midpapillary levels each have six segments (anteroseptal, anterior, anterolateral, inferoseptal, inferior, and inferolateral), whereas there are four apical segments (septal, anterior, lateral, and inferior). Confusion can arise with the segment numbering adopted by the AHA and the ASE. In the AHA 17-segment model, starting with the basal anterior segment, each segment is numbered in a clockwise fashion (see Fig. 13-3, A), whereas in the ASE 16-segment model, starting with the basal anteroseptal segment, each segment is numbered in a counterclockwise fashion (see Fig. 13-3, B). Most TEE views allow identification of some of the LV segments, and WMAs can be correlated with the coronary artery perfusion territory, helping identify the stenotic/problematic vessel.
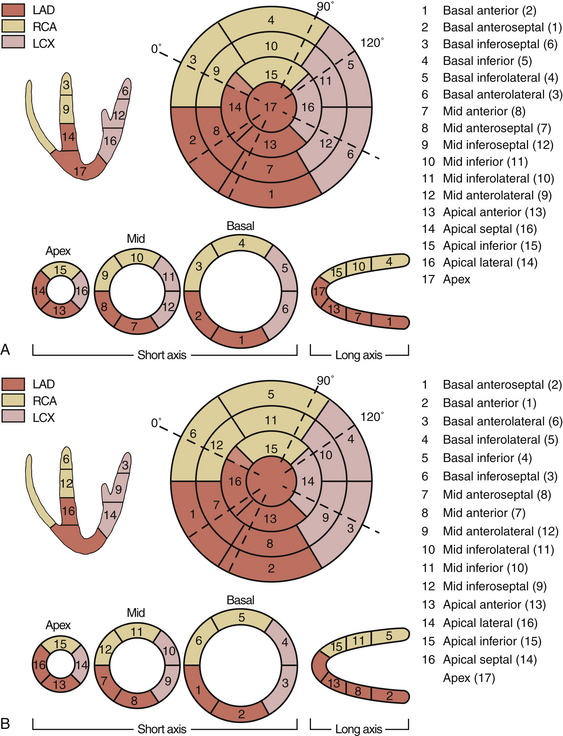
Figure 13-3 A, Segmental model of left ventricle. Transesophageal echocardiographic correlation of coronary artery distribution with American Heart Association 17-segment model is shown. B, Segmental model of left ventricle. Transesophageal echocardiographic correlation of coronary artery distribution with American Society of Echocardiography 16-segment model is shown. LAD, Left anterior descending; LCX, left circumflex artery; RCA, right coronary artery. (From Denault AY, Couture P, Vegas A, Buithieu J, Tardif J-C. Transesophageal Echocardiography Multimedia Manual. 2nd ed. New York: Informa Healthcare; 2011, with permission.)
 Normal Segmental Function
As the LV contracts, its endocardial border moves toward the center of the ventricular cavity (endocardial excursion or radial shortening), resulting in LV myocardium thickening and reduced LV cavity area. Normal LV radial shortening and myocardial thickening is greater than 30%. 4 The regional wall motion scoring index provides a subjective yet effective means to assess LV function and detect and quantify acute myocardial ischemia ( Table 13-1). However, heterogeneity of normal segmental wall motion, left bundle branch block, right ventricular volume overload, constrictive pericarditis, pacemaker rhythm, and post–cardiac surgery period must all be taken into account, since these elements can alter interventricular septal wall motion.
TABLE 13-1
| Movement | Radial Displacement | Thickening |
| Normal or hyperkinesis = 1 | >30% | Normal |
| Hypokinesis = 2 | 0-30% | Decreased |
| Akinesis = 3 | 0% | Negligible |
| Dyskinesis = 4 | Systolic lengthening | Paradoxical systolic motion |
| Aneurysmal = 5 | Paradoxical displacement | Diastolic deformation |
Data from Lang RM, Bierig M, Devereux RB, et al. Recommendations for chamber quantification: a report from the American Society of Echocardiography’s Guidelines and Standards Committee and the Chamber Quantification Writing Group, developed in conjunction with the European Association of Echocardiography, a branch of the European Society of Cardiology. J Am Soc Echocardiogr. 2005;18:1440-1463.
Evaluation of WMA has many limitations, including important regional differences in normal myocardial contractility. 5 In fact, a reduced myocardial thickening is more specific than WMA for identifying ischemia. 6 Furthermore, movements of the ventricular segments are affected by the rotation and translation of the heart, so a floating frame should be used ( Fig. 13-4). These movements can also be subject to tethering of the adjacent myocardium. This can result in overestimation of the ischemic area. The transgastric (TG) midpapillary short-axis view is often used to detect ischemia. However, in this view, only 6 segments (7, 8, 9, 10, 11, and 12) are evaluated. One study 7 found that the midpapillary short-axis view allowed detection of only 17% of new WMAs, whereas an additional 48% of WMAs were detected by the concomitant evaluation of other short-axis planes and an additional 35% of new WMAs in the long-axis views alone. This emphasizes the importance of carrying out the analysis of WMA in more than one plane and, ideally, in all 17 segments. Finally, intraoperative regional WMAs are diagnosed on real-time TEE (on-line), and some ischemic episodes may be missed. 8
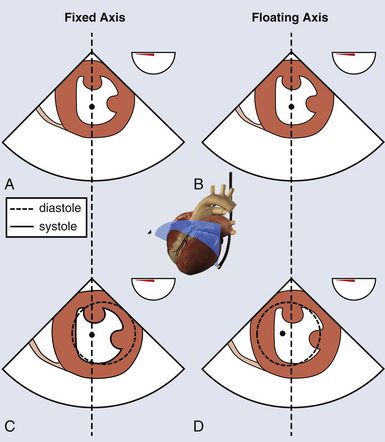
Figure 13-4 Abnormal septal motion. Transgastric mid–short-axis view using a fixed axis (A, C) or a floating axis (B, D). In a patient with left bundle branch block, with a fixed axis, abnormal septal motion is identified without rotational artifact. With a floating axis, center of image is displaced to the left, but normal segment appears hypokinetic. (Adapted from Denault AY, Couture P, Vegas A, Buithieu J, Tardif J-C. Transesophageal Echocardiography Multimedia Manual. 2nd ed. New York: Informa Healthcare; 2011, with permission.)
 Segmental Wall Motion Analysis
Segmental WMAs take place in the myocardium seconds after myocardial blood flow to the affected segment is interrupted, long before electrocardiographic (ECG) changes and angina occur. WMAs are classified as hypokinetic when ventricular contraction is reduced in magnitude, akinetic when it is absent, and dyskinetic in the presence of paradoxical systolic motion (see Table 13-1). The observation of new WMAs is a more sensitive tool to detect acute ischemia than ECG or invasive hemodynamic monitoring and has been found to be predictive of adverse outcomes after cardiac surgery.4,9,10 However, the intraoperative detection of new regional WMAs after cardiopulmonary bypass in patients undergoing CABG may not be as reliable to predict acute postoperative graft failure. 11
Quantitative evaluation of regional LV systolic function requires high-quality images with good endocardial resolution. The centerline method is a quantitative approach for assessing regional ventricular function, which first involves construction of a line located halfway between the end-diastolic and end-systolic endocardial perimeters. 12 The endocardial excursion is determined along 100 equally spaced chords perpendicular to the centerline. Motion is then normalized for heart size by dividing it by the length of the end-diastolic perimeter. The normalized length of each line is then converted into units of standard deviation (SD) from the mean excursion along a given chord. This method allows the regional heterogeneity of ventricular contraction to be taken into account ( Fig. 13-5). By convention, negative and positive values indicate hypokinetic and hyperkinetic chords, respectively. The extent of abnormal wall motion is calculated as the number of hypokinetic chords equal to or more severe than two SDs. The severity of WMAs is calculated as the area under the curve below the zero SD line.
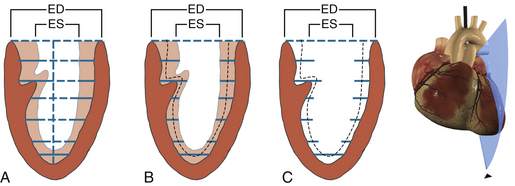
Figure 13-5 Centroid reference systems. A, Parallel chords drawn from centroid (long axis) trace endocardial border during end-systole (ES) and end-diastole (ED) in this midesophageal two-chamber view. B and C, Centerline method traces ED and ES endocardial borders, and computer draws a centerline midway between these endocardial borders. Note slightly greater systolic thickening in anterior wall. (Adapted from Denault AY, Couture P, Vegas A, Buithieu J, Tardif J-C. Transesophageal Echocardiography Multimedia Manual. 2nd ed. New York: Informa Healthcare; 2011, with permission.)
 Wall Motion Score Index
The Wall Motion Score Index (WMSI) is a semiquantitative assessment of regional LV contraction. Each of the 17 segments is given a score on a scale of 1 to 5. A score of 1 is given to normally contracting or hyperkinetic segments (>30% thickening), 2 for hypokinetic segments (10%-30% thickening), 3 for akinetic segments (<10% thickening), 4 for dyskinetic segments (paradoxical systolic motion), and 5 for aneurysmal (diastolic deformation) segments (see Table 13-1). 13 The WMSI is equal to the sum of the regional scores divided by the number of evaluable segments. It ranges from 1.0 in the normal heart to 3.9 in severe systolic dysfunction. The WMSI has been shown to have prognostic value in clinical studies. Berning et al. 14 found that patients in acute myocardial infarction with a higher (i.e., worse) WMSI had a higher cardiovascular mortality at 1 year (51%) than patients with a lower (i.e., better) WMSI (cardiovascular death at 1 year of 8%). Kan et al. 15 observed similar results and found a mortality rate of 61% in patients with a higher WMSI by comparison to 3% in patients with a lower WMSI.
 Tissue Doppler Imaging
Tissue Doppler imaging (TDI) filters out the high-velocity signals from blood to isolate the low-velocity, high-amplitude signals of movement of the myocardium. Combined with pulsed wave (PW) Doppler, it allows for the analysis of direction and velocity of individual segments of myocardium to quantify regional wall motion ( Fig. 13-6). 16 Mean values of 5.5 cm/s and maximum velocities below 7.5 cm/s are indicative of myocardial failure. Decreases in regional myocardial velocities during ischemia have been observed in clinical studies.17–19 However, the simultaneous analysis of multiple segments is only possible off-line, even though this can be done intraoperatively. Furthermore, because they are based on the Doppler equation, measured velocities will be inaccurate if the Doppler beam is not parallel to the movement of the interrogated segment. Finally, akinetic segments tethered by the adjacent contracting myocardium will have near-normal velocities, and because of poor spatial resolution, the differentiation between subendocardium and subepicardium is not possible.
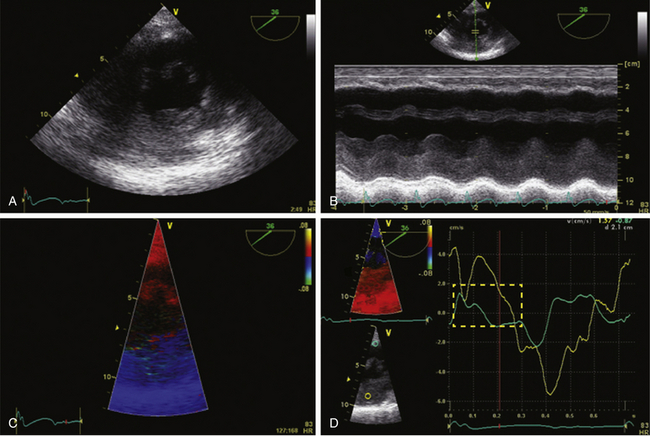
Figure 13-6 Tissue Doppler imaging (TDI) with inferior hypokinesis. A, Midpapillary transgastric view of a 77-year-old man with a previous inferior wall myocardial infarction. Corresponding M-mode is shown. Note reduced excursion of inferior wall (B). C, TDI on same region. TD velocities are obtained on anterior wall (yellow) and inferior wall (blue). Note abnormal systolic excursion of inferior wall (D) indicated in dotted red square. TD velocities are characteristic of regional dyskinesia.
 Color Tissue Doppler Imaging
Color TDI superimposes color-coded tissue velocity onto a real-time live two-dimensional (2D) image. Color TDI evaluates mean velocities from each pixel so that the velocity is lower than that of PW spectral TDI, which measures peak velocities at the sample volume. Compared to pulsed TDI, color TDI has superior spatial resolution, which enables simultaneous evaluation of multiple segments. It can be displayed in different formats as velocity against time for each segment or as a curved M-mode (see Fig. 13-6).
 Strain and Strain Rate
In systole, the myocardium shortens its length, while it elongates during diastole. Strain is used to measure this deformation during the cardiac cycle. It is defined as the change in myocardial length in relation to myocardial initial length divided by the initial length. The rate of myocardial deformation is called strain rate (SR) ( Fig. 13-7). Myocardial ischemia translates into a decreased deformation and causes reductions in systolic strain and SR. By convention, myocardial shortening has a negative SR, while myocardial lengthening has a positive strain. Radial strain is measured in the TG midpapillary short-axis (SAX) view and will be positive during systole ( Fig. 13-8). Longitudinal strain is measured in midesophageal views and is positive during diastole.
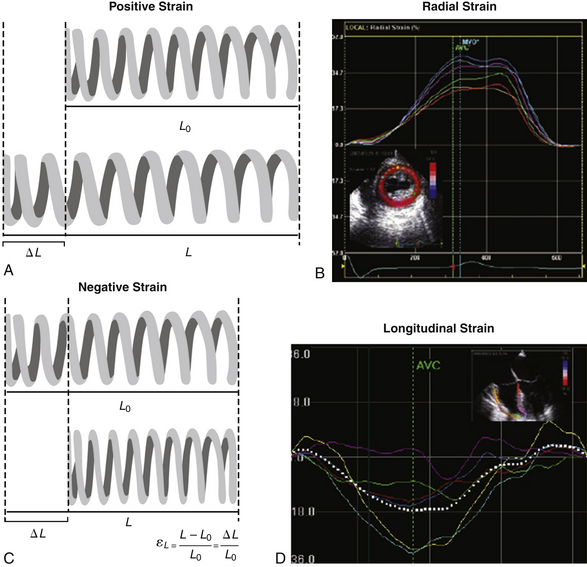
Figure 13-7 Strain (ε), or deformation concept. A and B, When strain is positive, initial length value (L0) is smaller than the final one (L). For instance, in transgastric mid–short-axis view, myocardial thickness increases during radial shortening. The radial strain obtained from this view will be positive (thickening). C and D, The opposite applies for a negative strain. Typically the longitudinal contraction of left ventricle obtained from a midesophageal four-chamber view has a negative systolic strain. (From Denault AY, Couture P, Vegas A, Buithieu J, Tardif J-C. Transesophageal Echocardiography Multimedia Manual. 2nd ed. New York: Informa Healthcare; 2011, with permission.)
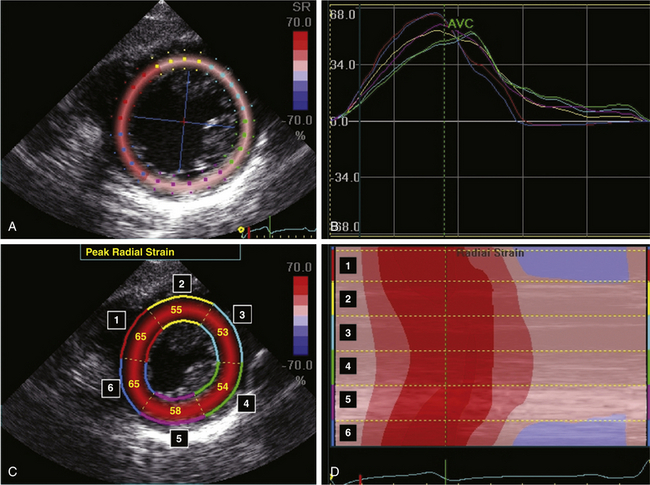
Figure 13-8 Radial strain by two-dimensional speckle tracking in a normal patient. A and C, Transgastric mid–short-axis view with radial strain overlay. Peak radial strain has a positive value for all left ventricular (LV) segments because of myocardial thickening during systole. B and D, The change in peak radial strain of each LV segment can be displayed as individual tracings over time (B) or as a curved M-mode map over time (D). (From Denault AY, Couture P, Vegas A, Buithieu J, Tardif J-C. Transesophageal Echocardiography Multimedia Manual. 2nd ed. New York: Informa Healthcare; 2011, with permission.)
Strain is an off-line measure obtained from saved TDI loops or using 2D speckle tracking technology. It corresponds to the integration of SR over time. Strain and SR can be displayed as a function of time or as curved anatomic M-mode images. Radial and segmental strain and SR will have different values depending on the interrogated myocardial segment ( Table 13-2). 20
Stay updated, free articles. Join our Telegram channel

Full access? Get Clinical Tree


