Quantifying Coronary Artery Calcium
Michael A. Brooks
J. Jeffrey Carr
Coronary artery calcified plaque (CACP), a component of coronary atheroma that can be measured with cardiac-gated computed tomography (CT), indicates the presence of advanced atherosclerotic lesions in the coronary arteries and identifies individuals at elevated risk for myocardial infarction and cardiovascular death independent of traditional cardiovascular risk factors. In this chapter, we will explain how calcified plaque is a metabolically active process and has a significant genetic component. We will detail the technical aspects of performing cardiac-gated CT without contrast and for measuring CACP after image acquisition. Finally, we will review the current status of CACP as a clinical tool and indicate how it could be integrated into a cardiovascular disease prevention program.
Atherosclerosis is derived from the Greek words “athera,” translated as “gruel” or “porridge,” and “sklerosis,” meaning “hardening.” Thus, from its first description, atherosclerosis was seen as a disease incorporating calcification. Atherogenesis begins in late childhood with the development of fatty streaks, and microcalcifications can be identified in fatty streaks in young individuals in their teens and twenties (1,2,3). The calcified plaques are located in the intimal layer of the coronary arteries (4) (Fig. 13-1). As atheromata become larger and more complex, the amount of calcified plaque increases. Once the calcified plaque reaches a certain size, it can be imaged by various in vivo modalities, ranging from chest radiographs to cardiac CT, with the threshold for detection dependent on the capability of the imaging devices. Over the years, various imaging modalities, including conventional chest radiography, fluoroscopy, cine fluoroscopy, electron beam computed tomography (EBCT), and more recently, multidetector computed tomography (MDCT) have been used to identify and quantify the amount of CACP.
CACPs are not simply dystrophic calcifications. The existence and maintenance of CACP is a regulated and metabolically active process, which shares a number of similarities with bone formation. Calcified atherosclerotic plaques can recapitulate trabecular bone and marrow elements—osteocytes, chondrocytes, osteoclasts, lymphocytes, mast cells, monocytes, and capillaries have all been identified within calcified coronary plaques (5,6,7,8). It is known that proteins found in developing bone are expressed within areas of atherosclerotic plaque undergoing calcification (9,10,11,12). There are several proposed models that relate the regulation and homeostasis of atherosclerotic calcification to similar processes involved in bone formation (13).
As further evidence of a connection between atherosclerotic calcification and bone metabolism, it has been known for some time that there is a relationship between atherosclerotic calcification and osteoporosis in humans.
Calcified plaque burden in the aorta has been shown to be a predictor both of bone mineral loss and of osteoporotic fracture (14,15,16). Bone mineral density has also been shown to be inversely correlated with arterial stiffness in dialysis patients (17) and inversely correlated with the presence of echogenic carotid plaque (18). New developments and better understanding of the relationship between atherosclerotic calcification, bone formation and resorption, and inflammation may lead to new therapeutic targets for the prevention and treatment of atherosclerosis.
Calcified plaque burden in the aorta has been shown to be a predictor both of bone mineral loss and of osteoporotic fracture (14,15,16). Bone mineral density has also been shown to be inversely correlated with arterial stiffness in dialysis patients (17) and inversely correlated with the presence of echogenic carotid plaque (18). New developments and better understanding of the relationship between atherosclerotic calcification, bone formation and resorption, and inflammation may lead to new therapeutic targets for the prevention and treatment of atherosclerosis.
 Figure 13-1 Ex-vivo specimen CT and histology (H & E section) demonstrating a calcified plaque within the intima of an artery. |
The presence and extent of atherosclerotic calcification has a significant genetic component that appears to be at least as strong as the known combined environmental risk factors such as smoking and elevated serum cholesterol (19,20). Important ethnic differences in the prevalence and extent of coronary artery calcification exist (21). While the presence of coronary arterial calcification and the presence of atherosclerotic disease are closely correlated (22,23,24), there are genetic determinants of calcification independent of the genetic determinants of atherosclerotic disease (25,26), indicating that the genetics of CACP are complex and remain to be fully elucidated. At least ten genes are currently implicated in the development of CACP (27).
The American Heart Association and American College of Cardiology have issued several consensus statements which address CACP (28,29,30,31). These consensus statements and extensive reviews of the previously published literature are clear in indicating that the presence of coronary artery calcium indicates the presence of coronary artery atherosclerosis, and that increasing amounts of CACP indicate increasing burden of both calcified and noncalcified coronary atheroscerosis. More recently, the data has emerged that CACP predicts cardiovascular events and adds significantly to risk models using traditional cardiovascular risk factors such as the Framingham Risk Score. Autopsy studies have demonstrated a high correlation between the amount of CACP as quantitated by EBCT and the total area of coronary atherosclerotic plaque as determined histologically (32,33). Several studies also demonstrate that CACP predicts and localizes coronary atherosclerotic plaque as depicted by intravascular ultrasound (34,35).
CACP is an indicator of plaque composition and functions as a measure of the total burden of atherosclerotic coronary artery disease. The presence of calcium is seen in atherosclerotic plaques histologically classified as type Vb, according to the American Heart Association (36). Most cases of acute myocardial infarction are precipitated by plaque rupture, and the plaques that rupture and are rupture-prone (the “vulnerable plaque”) tend to be lesions that do not contain large amounts of calcium (23,37). However, patterns of calcified plaque may provide insight into segments of the coronary arteries at risk for future events. In a study of patients with acute myocardial infarction, unstable angina pectoris, and stable angina pectoris using intracoronary ultrasound, a “spotty pattern” of calcification was the most highly associated feature with the culprit lesion of acute myocardial infarction (38). CACP has a number of attractive features that make it an excellent marker for use in primary prevention of coronary artery disease. CACP identifies subclinical coronary atherosclerosis, provides a good measure of the total coronary atherosclerosis, can be detected years prior to clinical events, can be measured quantitatively with a standardized protocol, and most importantly predicts future cardiovascular disease (CVD) events, as will be discussed later in this chapter.
Measurement of Coronary Artery Calcified Plaque by CT
Cardiac CT allows the standardized measurement of CACP in less than 10 minutes, with little preparation on the part
of the patient and no significant risk of complications. It is defined as a CT system that provides for subsecond temporal resolution as well as provides a method for compensation for cardiac motion, most commonly electrocardiogram (ECG) gating. Cardiac CT was initially developed with EBCT in the 1980s. This device could image the heart with 100 ms temporal resolution when performing calcium scoring. More recently, spiral CT and multidetector CT have been utilized. The rapid evolution of MDCT to gantry rotation speeds of 0.3 seconds provides direct temporal resolution of 200 ms. The production of EBCT systems was stopped in 2005, although systems remain operational across the country. The vast majority of cardiac CT, now and in the future, will be performed on MDCT systems designed for cardiac imaging.
of the patient and no significant risk of complications. It is defined as a CT system that provides for subsecond temporal resolution as well as provides a method for compensation for cardiac motion, most commonly electrocardiogram (ECG) gating. Cardiac CT was initially developed with EBCT in the 1980s. This device could image the heart with 100 ms temporal resolution when performing calcium scoring. More recently, spiral CT and multidetector CT have been utilized. The rapid evolution of MDCT to gantry rotation speeds of 0.3 seconds provides direct temporal resolution of 200 ms. The production of EBCT systems was stopped in 2005, although systems remain operational across the country. The vast majority of cardiac CT, now and in the future, will be performed on MDCT systems designed for cardiac imaging.
Performing CT Scans for Measuring Coronary Artery Calcified Plaque
The basic protocol for measuring coronary calcified plaque was developed in clinical practice and then evolved and has been implemented in several large population-based studies funded by the National Heart, Lung, and Blood Institute (NHLBI) and others. This standardized protocol is being utilized in the Multi-Ethnic Study of Atherosclerosis (MESA) and Coronary Artery Risk Development in Young Adults (CARDIA), two large cohort studies following over 10,000 individuals for cardiovascular outcomes. This protocol is based on using an axial, also termed a sequential or cine, CT acquisition, coupled with prospective ECG gating. With current MDCT systems, the breath-hold time for the patient is less than 15 seconds, during which time the x-ray tube is activated for less than 2 seconds. This allows an extremely low radiation exposure exam to be performed, typically with an effective dose of between 1 to 1.8 mSv, depending on the technique and specific characteristics of the MDCT system. In essence, the ECG tracing triggers the CT scanner to acquire a block of images at a preset window within the cardiac cycle based on the location of the QRS complex. This window has been typically set to late diastole, 70% to 80% of the temporal distance between two R waves. Several alternative approaches to cardiac triggering using an earlier diastolic phase, such as 50% of the R-R interval, have also been successfully used. In setting the R to R offset, it is important to remember that various vendors may define this offset at either the beginning of image acquisition or the temporal center of acquisition, and it is necessary to know the strategy employed by your equipment manufacturer.
To provide a more concrete explanation, we will detail the protocol as implemented on a General Electric Healthcare Lightspeed 16 Pro. On this CT system, there is a 20-mm wide detector array. For measuring calcified plaque, the standard slice collimation employed is between 2.5 and 3 mm. The GE system uses detector elements of 2.5 mm, and thus an axial scan in which eight 2.5 mm slices are reconstructed utilizes the entire 20 mm detector width (i.e., 8 ÷ 2.5 mm = 20 mm), resulting in the greatest dose efficiency. So, for each heartbeat, the x-ray tube is activated at the appropriate trigger point, and a block of eight slices of 2.5-mm thickness is obtained. Once this acquisition is completed, the CT couch moves to the next level during the subsequent heartbeat. The second scan acquisition is then obtained, and this sequence is repeated until the entire scan volume is covered. For the typical heart, 100 to 120 mm along the z-axis (head-to-foot) is required to scan the heart, resulting in five to six acquisitions. For an individual with a heart rate of 60 beats per minute, each R to R interval occupies one second. Therefore, six cardiac cycles for imaging and five for table movement are needed. This results in a total breath-hold time of 11 seconds.
The LightSpeed Pro 16 has a maximum gantry rotation speed of 0.4 seconds. The cardiac scan mode as previously discussed is in the axial or cine mode. In addition, as detailed in the technical chapter related to CT, a partial or segmental image reconstruction is utilized to maximize temporal resolution. This results in the effective temporal resolution of each image being approximately one half to two thirds the gantry rotation speed, depending on how close one is to the center of the image. In this example, the temporal resolution ranges from .2 to .25 seconds. The exposure useful for calculating mAs is the larger of these. The actual tube-on time for the entire scan acquisition can be estimated by the longer of these values. If six blocks of slices are obtained and the exposure time is approximately 0.25 seconds per exposure, the total tube-on time is equal to 1.5 seconds. Thus, for a breath-hold time of 11 seconds, the participant is only receiving radiation during 1.5 seconds. Gantry speeds slower than 0.5 seconds per rotation are suboptimal for imaging the heart and are not recommended for performing cardiac CT. Ideally, systems capable of gantry speeds between 0.35 and 0.4 seconds (or faster) should be used for cardiac applications.
Preparing and scanning individuals for measuring CACP is straightforward. Prior to the cardiac CT exam, we recommend that subjects avoid caffeine and other stimulants for 12 hours preceding the exam to decrease the incidence of tachycardia. The coronary calcium measurement is relatively tolerant to motion, and therefore administration of oral or IV beta blockade to lower the heart rate is not employed or recommended. The individual is placed on the CT couch; this could be either head or feet first depending on local practice and the manufacturer’s recommendations. ECG
electrodes are applied to the thorax to provide the necessary gating. A scout tomogram is obtained. The technologist then prescribes the start and stop location based on the frontal scout. The start location is just below the carina, which is generally evident on the scout image. This will place the initial slice generally at the level of the left pulmonary artery and cephalad to the left anterior descending coronary artery. The stop location should be below the diaphragmatic aspect of the heart (Fig. 13-2).
electrodes are applied to the thorax to provide the necessary gating. A scout tomogram is obtained. The technologist then prescribes the start and stop location based on the frontal scout. The start location is just below the carina, which is generally evident on the scout image. This will place the initial slice generally at the level of the left pulmonary artery and cephalad to the left anterior descending coronary artery. The stop location should be below the diaphragmatic aspect of the heart (Fig. 13-2).
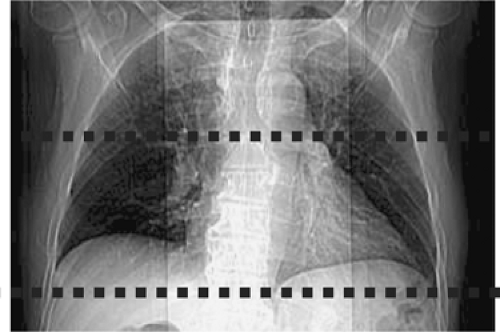 Figure 13-2 Scout topogram or scanogram demonstrating the start and end locations for prescribing a noncontrast cardiac CT. The dashed lines indicate superior and inferior extent of the scanning range. The start location should be just below the carina, and the end location should be inferior to the diaphragmatic aspect of the heart. It is important that the individual understand and execute the breathing instructions. Cardiac position varies with respiration, and it is important to the same level of inspiration for both the scout and subsequent cardiac CT acquisition. |
The specific technical factors needed for coronary calcium scanning are CT system specific. There has, however, been work on developing a consensus across vendors toward a standardized protocol. Specific technical factors are kV of 120, slice thickness of between 2.5 and 3 mm, mAs of between 50 and 120 (based on body size considerations to maintain adequate signal-to-noise ratio), reconstruction into a 26-cm field of view centered on the heart, reconstruction using the partial or segmental algorithm, and a medium or standard reconstruction kernel that is vendor specific. Given the low radiation exposure of the prospectively triggered ECG-gated scan, and the improved spatial resolution of current MDCT systems, an adequate mAs should be used to maintain image quality. Various groups have differed on the appropriate mAs value, with suggested values ranging from 50 to 150. It is clear that the size of the individual being scanned is a critical factor in determining the appropriate mAs (Fig. 13-3). In addition, design features of the various CT scanners directly impact the level of noise at a given mAs. Currently, automated exposure techniques are not available for use when cardiac gating is employed on most CT systems. On CT scanners without an automated exposure control, a tiered system of mAs based on an individual’s weight is recommended. A weight threshold of 100 kg (220 lb) was selected for use in the MESA and CARDIA studies. Individuals weighing 100 kg or less received the standard mAs value, and those weighing greater than 100 kg received a 25% increase in mAs. To determine the standard mAs value, the specific imaging characteristics of your cardiac CT system need to be understood. Image noise is dependent on several parameters related to the design of the CT scanner and the kernel used for reconstructing the images. One should implement a technique that provides a level of image noise of approximately 18 to 20 CT units. The noise in a given image can be approximated by measuring the standard deviation of a region of interest in the ascending aorta. Once you have determined your base mAs settings, this value can be increased by 25% for individuals greater than 100 kg in weight. If the base mAs for an individual weighing less than 220 lb/100 kg is 100 mAs, the mAs for individuals greater than 100 kg (220 lb) would be 125 mAs.
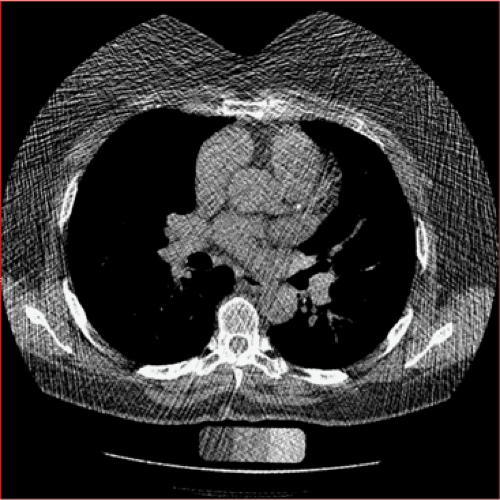 Figure 13-3 Patient size and image noise. As the size of the individual within the scan gantry increases, fewer x-ray photons make it through the individual to the detectors. This increased beam attenuation results in an increased signal-to-noise (SNR) ratio. This is manifest in the image as increased “black and white pixels” (image noise) and makes it more difficult to distinguish calcified plaque (or other structures) from noise. In this case, a small calcified plaque in the left anterior descending coronary artery is present and can be distinguished from the surrounding image noise in this large individual. |
The nominal slice thickness implemented on the EBCT systems is 3 mm. MDCT systems provide either 2.5 or 3 mm. On the 16-channel and greater MDCT systems, reconstruction of thinner slices at either millimeter or submillimeter slice thickness is possible. Currently, there is little data to support an advantage in measuring calcified plaque with thinner slice thicknesses, although it is clear that the improved spatial resolution in the z-axis reduces partial volume averaging of small plaques. In the prospective studies demonstrating the risk assessment benefits of CACP scoring, 2.5- to 3-mm slice thicknesses have been used. Whether thinner slice collimation has a significant role in risk prediction remains to be determined.
Quantifying Coronary Artery Calcified Plaque on a Computer Workstation
Stay updated, free articles. Join our Telegram channel

Full access? Get Clinical Tree


