Pulmonary Vasculature
U. Joseph Schoepf
James F. M. Meaney
Spectrum and Prevalence of Diseases
Pulmonary vascular conditions span the gamut from common, everyday disorders to rare but important medical problems. By far and away, the clinical suspicion of pulmonary embolism (PE) drives the most diagnostic concern for imaging the pulmonary vasculature. Indeed, the mortality rate associated with PE exceeds 15% in the first 3 months after diagnosis and brings one of the most common medical problems in the Western world (1,2).
However, other pulmonary vascular disorders are increasingly recognized, such as pulmonary hypertension (PH) with a wide array of etiologies, ranging from idiopathic to chronic thromboembolic PH (3), various types of arteritis (4), large vessel arteritis such as Takayasu disease (4), and pulmonary arteriovenous malformations (5) (often in the context of systemic disorders such as polyarteritis nodosa, Churg-Strauss syndrome, and Wegener’s disease) and a host of other less common vascular pathologies. Furthermore, some vascular assessment may be required prior to novel interventional therapy, such as radio frequency ablation for heart rhythm disorders or its complications. (6,7)
Global View of Unique Aspects and Considerations of Imaging of This Organ System
The pulmonary vasculature has a wide range of vessel caliber; a complex, multiplanar course; and is impacted by respiratory and cardiac motion. In contradiction to most vascular beds in which atherosclerotic disease predominates, the pulmonary vessels are dominated by embolic disease.
What Do Computed Tomography and Magnetic Resonance Bring over Other Imaging and Nonimaging Diagnostic Testing?
The maturation of computed tomography (CT) and magnetic resonance (MR) technology has dramatically modified the evaluation of pulmonary arteries in routine clinical practice. Prior to imaging of the pulmonary vasculature with these approaches being the routine, an assessment of pulmonary vascular disorders was based either on a noninvasive, indirect method: ventilation-perfusion scintigraphy; or on an invasive and sparingly used study, that is, pulmonary angiography.
The cross-sectional information available from CT and MR provides direct visualization of the vasculature and parenchyma, improving greatly on the informational content from nuclear medicine with newer CT and MR techniques capturing pulmonary perfusion (8,9,10,11,12,13). Furthermore, CT and MR present a minimal risk to patients when compared with that associated with conventional pulmonary angiography.
Imaging Strategies
Advantages of Computed Tomography for Pulmonary Vasculature Imaging
There are several inherent advantages that made CT the preferred modality for imaging the pulmonary vasculature. First and foremost, the ability to directly visualize thrombus with cross-sectional technique in a rapid manner is the attribute that has propelled its widespread use in patients who are suspected of having PE. In addition to the direct visualization of thrombus (Fig. 16-1), both mediastinal and parenchymal structures are well evaluated. Furthermore, other manifestations of PE can readily be visualized with spiral CT, including parenchymal infarction (Fig. 16-2), pleural effusion, vascular remodeling (dilation, pouches, thrombotic wall thickening), and oligemia.
Alternative diagnoses, some potentially life-threatening, such as aortic dissection, pneumonia, lung cancer, and pneumothorax, are readily established with CT (14,15,16).
Multidetector-row spiral CT offers fast and high-resolution imaging and, at the time of this writing, close to 4,000 units are installed in the United States. With current generation of 4-slice, 16-slice, and 64-slice multidetector-row
spiral CT scanners, the entire chest can be imaged with 1-mm or submillimeter resolution within a short single breath-hold; in the case of 64-slice CT, that breath-hold can be less than 5 seconds (Table 16-1).
spiral CT scanners, the entire chest can be imaged with 1-mm or submillimeter resolution within a short single breath-hold; in the case of 64-slice CT, that breath-hold can be less than 5 seconds (Table 16-1).
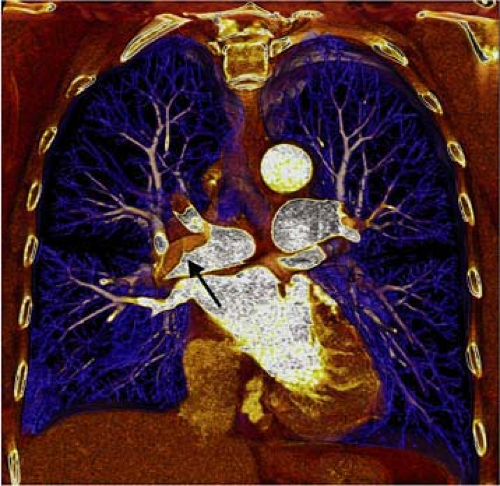 Figure 16-1 Contrast-enhanced (CE) multidetector-row CT scan in a 54-year-old woman presenting to the emergency department with acute chest pain. Volume rendering seen from an anterior coronal perspective shows extensive acute PE (arrow) in the right main pulmonary artery. |
 Figure 16-2 Patient status postacute PE. A wedge-shaped area of consolidation (arrows) in the epidiaphragmal portion of the lower lobe of the left lung represents infarction of the lung parenchyma secondary to acute PE. CE multidetector-row CT examination shown as axial section (A), multiplanar reformatted mid-coronal (B), and left-sagittal (C) plane. (Reprinted with permission from Schoepf UJ, Goldhaber SZ, Costello P. Spiral computed tomography for acute pulmonary embolism. Circulation. 2004;109:2160–2167.) |
Shorter breath-hold times benefit patients with underlying lung disease and reduce the percentage of nondiagnostic CT scans (17). High-resolution multidetector-row spiral CT data can be transformed easily for two-dimensional (2D) and three-dimensional (3D) visualization. This may, in some instances, improve diagnosis but is generally of greater importance for conveying information on localization and extent of disease in a more intuitive display format.
Technical Considerations, Problems, and Limitations of Computed Tomography
Contrast Media Injection and Artifacts
Despite advances in CT technology, there are still several factors that can render CT pulmonary angiography inconclusive. The most common reasons for nondiagnostic CT studies are poor contrast opacification of pulmonary vessels, patient motion, and increased image noise due to excessive patient obesity.
The advent of multidetector-row CT necessitates an extensive revision of contrast material injection protocols. Faster acquisition times allow scanning during maximal
contrast opacification of the pulmonary vessels but pose an increased challenge for precise timing of the contrast bolus.
contrast opacification of the pulmonary vessels but pose an increased challenge for precise timing of the contrast bolus.
Table 16-1 Comparison of Acquisition Parameters for Computed Tomographic Pulmonary Angiography Using Different Scanners | ||||||||||||||||||||||||||||||||||||||||||||||||
|---|---|---|---|---|---|---|---|---|---|---|---|---|---|---|---|---|---|---|---|---|---|---|---|---|---|---|---|---|---|---|---|---|---|---|---|---|---|---|---|---|---|---|---|---|---|---|---|---|
| ||||||||||||||||||||||||||||||||||||||||||||||||
Strategies that have the potential to improve the delivery of contrast media for high and consistent vascular enhancement during CT pulmonary angiography currently include use of a test bolus or automated bolus triggering techniques (18,19). Saline flushing has been used for effective utilization of contrast media and for reduction of streak artifacts arising from dense contrast material in the superior vena cava. Multiphasic injection protocols have proved beneficial for general CT angiography (CTA) (19) but have not been scientifically evaluated for the pulmonary circulation.
Motion artifacts due to patient respiration or transmitted cardiac pulsation can adversely impact diagnostic outcome. The shorter breath-holds feasible with multidetector-row CT reduce respiratory motion artifacts and facilitate investigation of dyspneic patients (20). Similarly, artifacts arising from transmitted cardiac pulsation appear amenable to improved temporal resolution with fast CT acquisition techniques (19).
Electrocardiogram (ECG) synchronization of CT scan acquisition effectively reduces cardiac pulsation artifacts. Thus, the evaluation of cardiac structures, the thoracic aorta, and pulmonary structures is improved. With retrospective ECG-gating and the previous generation of 4-slice multidetector-row CT scanners, the relatively long scan duration inherent to data oversampling limited the achievable spatial resolution. Thus, high-resolution acquisition could only be achieved for relatively small volumes (e.g., the coronary arterial tree) but not for extended coverage of the entire chest.
However, with 16-slice multidetector-row CT, the entire thorax can be covered with submillimeter resolution in a single breath-hold while using retrospective ECG-gating. In this manner, potential diagnostic pitfalls arising from cardiac motion can be avoided. It still remains to be seen whether this technology increases the accuracy of CT for detecting small emboli in the vicinity of the heart, as would be predicted.
Radiation Dose
When high-quality multidetector computed tomography (MDCT) establishes an unequivocal diagnosis, the overall radiation burden to patients can be reduced by eliminating the need for further workup with other ionizing radiation tests. However, it is important to consider the impact of MDCT on radiation exposure.
As an example, if a 4-slice multidetector-row CT protocol with 4÷1-mm collimation is chosen to replace a single-detector CT protocol based on a 1÷5-mm collimation, the increase in radiation dose ranges between 30% and 100%. Similar increases in radiation dose, however, are not to be expected with 16-slice multidetector-CT technology and submillimeter resolution capabilities. The addition of
detector elements should improve tube output utilization compared with current 4-slice CT scanners and reduce the ratio of excess radiation dose that does not contribute to actual image generation.
detector elements should improve tube output utilization compared with current 4-slice CT scanners and reduce the ratio of excess radiation dose that does not contribute to actual image generation.
Technologies that modulate and adapt tube output relative to the geometry and x-ray attenuation of the scanned object, that is, the patient, can substantially reduce the dose without compromising diagnostic quality. However, the effect of such devices on the diagnostic performance has not been scientifically evaluated in some specific scenarios (21).
A critical factor for ensuring responsible utilization of MDCT is the increased awareness of the protocols that can be used by technologists and radiologists. For example, it has been shown that diagnostic quality of chest CT is not compromised if tube output is adjusted to the body type of the individual patient. Furthermore, when the concept of volume imaging is applied to MDCT, an effective trade-off between increased spatial resolution and image noise can result.
Given the great flexibility and diagnostic benefit that a high-resolution, near-isotropic multidetector-row CT data set provides, radiologists are increasingly willing to compromise on the degree of image noise in an individual axial thin-section image in order to keep radiation dose within reasonable limits.
Data Management
Although multidetector-row CT increases diagnostic capabilities, the massive amount of data generated by this technique creates significant strain on image analysis and archiving systems. A high-resolution 16-slice multidetector-row CT study in a patient with suspected PE, for instance, routinely results in 500 to 600 individual axial images from which the diagnosis is most commonly established.
Interpretation of such large volume studies is only feasible by use of digital workstations that allow viewing in “scroll-through” or “cine” mode. Large and accessible storage capacities are an essential requirement for successful routine performance of multidetector-row CT in a busy clinical environment. In the future, development of dedicated computer-aided detection algorithms may be helpful for the identification of PE in large volume multidetector-row CT data sets (Fig. 16-3).
However, extensive or isolated abnormal findings as well as normal pulmonary vasculature can be visualized in an alluring, comprehensive manner by means of 3D reconstructions generated from high-resolution multidetector-row CT.
3D visualization of multidetector-row CT data may aid diagnosis in some instances and help to avoid diagnostic pitfalls (e.g., for the correct interpretation of hilar lymphatic tissue adjacent to central pulmonary arteries in patients suspected of having PE). Furthermore, focal lung disease can be accurately diagnosed by use of MIP reconstructions that beneficially “condense” large volume multidetector-row CT data sets.
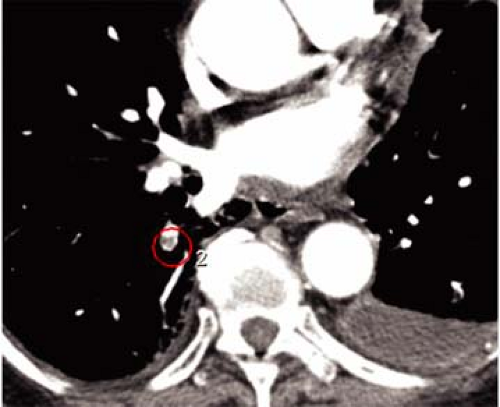 Figure 16-3 Prototype software platform for the automated detection of embolic filling defects at CT pulmonary angiography. An isolated peripheral filling defect in the right lower lobe of a patient with acute PE is automatically detected by the computer software (marked by a red circle). |
Magnetic Resonance Imaging and Magnetic Resonance Angiography
At the time when the early experience with CT was showing great promise for vascular assessment, there was widespread pessimism regarding the use of noncontrast magnetic resonance imaging (MRI) and magnetic resonance angiography (MRA) (22,23,24,25,26,27). Diaphragmatic and cardiac motion artifacts, long scan times, susceptibility artifacts at air-tissue interfaces, and poor contrast between flowing blood and emboli limited these early approaches.
The introduction of contrast-enhanced (CE) MR techniques circumvented many of those limitations, enabling high-quality diagnostic images of the pulmonary arteries to be generated during one breath-hold (28,29,30) (Fig. 16-4).
Initial studies reported good success for detection of PE compared with catheter angiography to the segmental level, but in common with early CTA, spatial resolution was suboptimal and detection of PE in smaller subsegmental arteries was limited (28,29,30).
Recent improvements in gradient technology, introduction of parallel imaging techniques, and use of optimized imaging protocols have generated a technique that now matches the spatial and temporal resolution of MDCT (Fig. 16-5) but that still lags behind that of digital subtraction angiography (DSA) (30).
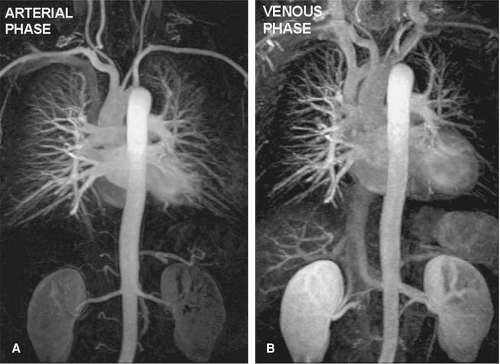 Figure 16-4 CE MRA/venography. A,B: Because of the short transit time from pulmonary artery to pulmonary vein, both arteries and veins are typically depicted on 3D data sets unless a time-resolved approach is employed. Therefore, even on CE MRA examinations “timed” to the pulmonary arteries (A), the pulmonary veins are also well depicted as demonstrated, as they are also on the “venous” phase (B). |
Acquisition parameters for pulmonary MRA and MR perfusion imaging are different among institutions and depend on the clinical scenario and scanner capabilities. Nevertheless, some sequences constitute the basis of the most widely accepted protocols. A flow rate of 2 mL/second is generally used to ensure a longer imaging time and more homogeneous contrast enhancement. First, a test-bolus sequence takes place to determine the exact circulation time of the contrast material bolus from the injection site to the region of interest. Then, breath-hold pre- and postcontrast 3D fast MR imaging is performed in the preferred orientation (in most cases, in the coronal or oblique sagittal plane) by using parallel imaging techniques whenever possible.
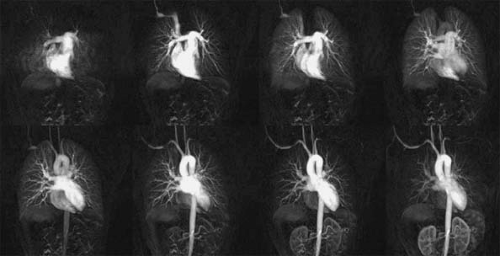 Figure 16-5 Coronal MIP images from 3D time-resolved MRA at 3T (2/0.84; flip angle, 17°), with a sample interval of 1.5 seconds show sequential filling of pulmonary arteries, pulmonary parenchyma, and systemic arteries. (Reprinted with permission from Nael K, Michaely HJ, Kramer U, et al. Pulmonary circulation: Contrast-enhanced 3.0T MR angiography-initial results. Radiology 2006;240:858–868.) |
Table 16-2 Example of Acquisition Parameters for Pulmonary Magnetic Resonance Angiography and Magnetic Resonance Perfusion Imaging | ||||||||||||||||||||||||||||||||||||
|---|---|---|---|---|---|---|---|---|---|---|---|---|---|---|---|---|---|---|---|---|---|---|---|---|---|---|---|---|---|---|---|---|---|---|---|---|
| ||||||||||||||||||||||||||||||||||||
Fast imaging is essentially accomplished with short repetition time (TR) (typically ≤5 msec) and short echo time (TE) (typically ≤2 msec) 3D sequences. With strong gradients, extremely short TR/TE combinations can be achieved (e.g., 2.9/1.2 msec, respectively). Generally speaking, a flip angle of 15 to 25 degrees will be satisfactory for these sequences. Table 16-2 presents further details of acquisition parameters proposed by Nikolaou et al. (31) for patients suspected of having pulmonary arterial hypertension.
Acquisition time for one 3D data set is usually in the range of 15 to 30 seconds. The data set is acquired during breath-hold (inspiration), and the k-space readout scheme is usually centrically reordered. Because of the asymmetric sequential k-space readout scheme, image acquisition should begin a few seconds before the estimated arrival of the contrast material bolus. Precontrast MR angiograms, acquired before the administration of the larger amount of contrast material, are then subtracted from the postcontrast images, and for image analysis, multiplanar reformation (MPR) and maximum-intensity projection (MIP) reconstructions of the complete data are obtained.
Other Magnetic Resonance Imaging Techniques for Pulmonary Vasculature Assessment
Initial attempts with MR imaging to evaluate the pulmonary arteries solely focused on “first-pass” data with an injection of an extra-cellular contrast agent. More recently, investigators have reported several other techniques as follows:
Perfusion imaging
Time-resolved MRA
Blood-pool contrast agents
True fast imaging with steady-state precession (FISP) MRA
Direct thrombus imaging
Perfusion Imaging and Ventilation
Phase-contrast techniques (8) have given way to CE acquisitions (9,10,32,33) and potentially to new techniques such as arterial spin labeling (11). Despite the fact that perfusion imaging with isotope scintigraphy is limited for the diagnosis of PE, perfusion imaging with MRI offers substantial benefit in terms of spatial and temporal resolution (Fig. 16-6). Several studies compare scintigraphic and MR pulmonary perfusion in a variety of disorders. Although results with both techniques are similar, reproducibility is significantly greater with MR. Differential lung perfusion, which may be of value in assessing patients with chronic obstructive pulmonary disease prior to and after lung volume reduction surgery, is also well demonstrated with MR lung perfusion (12,34,35,36,37).
Time-resolved Magnetic Resonance Angiography
Because of the short transit time from pulmonary artery to pulmonary vein, some researchers have implemented extremely rapid imaging of the pulmonary vasculature, in an effort to capture an arterial phase (38,39) (Fig. 16-7). In order to achieve this goal, however, images must be acquired in 4 seconds or less per scan, thus requiring lower resolution than might otherwise have been employed. With this approach, a “clean” arterial phase is acquired in favor of a higher resolution scan that can depict subsegmental arteries. Often, in-plane resolution is sacrificed to achieve a sufficient combination of in-plane spatial resolution and rapid temporal resolution. That will limit the number of useful projections that can be generated.
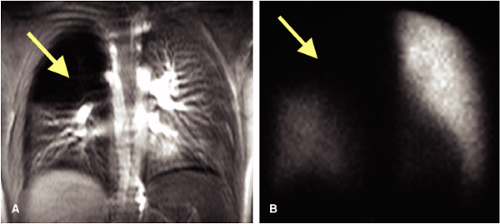 Figure 16-6 A 65-year-old male patient with upper right lobe PE. A: Gadolinium-enhanced MR imaging shows perfusion defect (arrow) involving the upper lobe of the right lung. B: The same perfusion defect (arrow) is confirmed by Tc 99m-macroaggregated albumin scan. (Courtesy of Qun Chen, PhD, New York University Medical Center.) |
 Figure 16-7 Time-resolved CE MR of the pulmonary vasculature, each acquisition acquired in under 4 seconds. Note sequential enhancement of the pulmonary arteries and veins during a single breath-hold or several shorter breath-holds. There is a perfusional deficit in the lower right and upper left pulmonary lobes (arrowheads in A) secondary to PE (arrows in B and C). (Courtesy of S. Schoenberg, MD, Munich, Germany.) |
Blood-pool Imaging
Currently, no blood-pool contrast agent has been released commercially within the United States, but in 2006, MS-325 received a license for vascular use in Europe (40,41,42). Blood-pool agents offer a promising role in pulmonary vascular diagnosis, especially in situations where higher resolution is required. To date, no prospective comparative study of blood-pool agent compared with DSA has been performed. Because of their long vascular persistence time, repeated breath-hold studies targeted to a suspected abnormal area can be performed at higher resolution after an initial screening examination performed at lower resolution (40,41,42). Alternatively, high-resolution breath-hold images of the entire pulmonary vasculature can be performed in multiple acquisitions tailored to the breath-hold capability of the patient. Another possibility that is attractive for patients with severe respiratory compromise is the use of navigator-echo techniques to eliminate the need for breath-holding. The long vascular persistence of blood-pool agents offers the potential to detect clots within the lower extremities (43) in patients with suspected PE.
True-FISP Imaging
True-FISP imaging is a “balanced” technique that depicts vessels as bright structures and shows promise for diagnosis of both deep venous thrombosis (DVT) and PE. Kluge et al. recently reported promise for detection of PE with True-FISP MRA (44). Images can be acquired in any plane, and although breath-holding is essential, small imaging volumes tailored to the breath-hold capability can be acquired. However, a recent article suggests that some clots may go undetected with True-FISP imaging (45).
Direct Thrombus Imaging
Direct thrombus imaging, based on the principle that changes in MR signal intensity occur due to reproducible changes in blood clots over time, offers a whole new vista for noninvasive diagnosis of PE (46,47,48,49,50,51). One of the intermediate products of this process is methemoglobin, which has a characteristic appearance on MRI due to a significant reduction in T1 values that can be highlighted with a heavily T1-weighted sequence (48,50). This truly noninvasive technique (does not require injection of contrast material) holds promise for the detection of both DVT and PE. Also, as time-dependent changes in MR appearance reflect evolution of the clot, high signal is seen in new clots only (46,47,48,49). Further advantages include the ability to scan in the coronal plane, thus allowing time-efficient coverage of the lower extremity veins with two coronally overlapping acquisitions in a relatively short scan time.
Normal Anatomy: Pulmonary Arteries
The pulmonary arteries, one on each side, arise from the bifurcation of the pulmonary trunk (1,2,3). The left main pulmonary artery is a direct posterior continuation of the pulmonary trunk and describes a course from anteroinferior to posterosuperior as it arches over the left main bronchus before diving into upper and lower trunks. The right main pulmonary artery, longer than the left, forms a graceful sweep toward the right lung from its point of origin from the pulmonary trunk and follows a horizontal or slightly inferior course passing under the concavity of the aortic arch before dividing into a smaller upper and a larger lower trunk (Figs. 16-8, 16-9).
The subsequent branching pattern of the pulmonary arteries then mirrors that of the segmental bronchi. The right gives rise to the apicoposterior, anterior, and posterior segmental arteries that feed the right upper lobe, a middle lobe artery that immediately divides into medial and lateral segmental arteries, and five segmental arteries to the right lower lobe (apical, anterior, posterior, medial, and lateral).
On the left side, the arrangement is analogous with the following variations—the lingular artery, a branch of the left upper lobe pulmonary artery, divides into superior and inferior branches. The apical and posterior arteries are shared on the left (the apicoposterior segmental artery) as are the medial and posterior segmental arteries on the left (the mesiobasal segmental artery), thus giving a total of 10 segmental arteries on the right but only 8 on the left.
The segmental arrangement of the pulmonary arteries is important and impacts the original research evaluating the role of CTA and MRA for PE—only the segmental arteries and larger were evaluated while ignoring the subsegmental arteries. This was appropriate for the time, considering first the (now largely irrelevant) spatial resolution limitations of both CT and MR and second the fact that the importance of isolated subsegmental embolism remains unknown.
A nomenclature of the pulmonary arteries respecting the distance from the right ventricle is widely used as follows: first order branch, the pulmonary trunk; second order, the left and right main pulmonary arteries; third order, the upper and lower trunks and “lobar” arteries; fourth order, all 10 segmental arteries; fifth order, subsegmental arteries arising directly from a segmental artery; sixth order, arteries arising directly from the first division of a subsegmental artery; and so on.
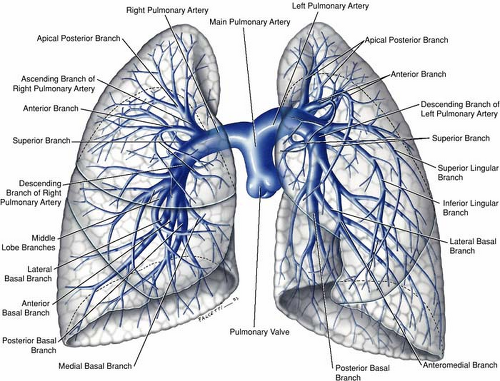 Figure 16-8 Diagram of the distribution of the pulmonary arteries in both lungs. (Reprinted with permission from Uflacker R. Pulmonary arterial circulation. In: Uflacker R, ed. Atlas of Vascular Anatomy: An Angiographic Approach. 2nd ed. Philadephia: Lippincott Williams & Wilkins; 2007:234.) |
Bronchial Artery Anatomy
Although bronchial artery anatomy is extremely variable, most (>70%) originate from the descending thoracic aorta close but usually slightly below the carina (T5-T6 level). Anomalous bronchial arteries are defined as bronchial arteries that originate outside the T5-T6 range. Bronchial arteries typically run parallel to the bronchovascular axes (Fig. 16-10).
The largest published anatomic series, based on the assessment of cadaveric specimens, described four classical branching patterns, as follows (52) (Fig. 16-11):
(40.6%) Two arteries on the left and one on the right that arises as an intercostobronchial trunk (ICBT)
(21.3%) One artery on the left and one ICBT on the right
(20.6%) Two on the left and two on the right, one of which is an ICBT
(9.7%) One on the left and two on the right, one of which is an ICBT
Variant Anatomy: Arteries
Transposition of the great arteries is a condition where the pulmonary trunk arises from the left ventricle and the aorta from the right ventricle. Despite the abnormal arrangement, the arteries otherwise appear normal (3,4).
Anomalous origin of the left pulmonary artery (“pulmonary sling”) is usually diagnosed in infancy because of the effect of the aberrant artery on the airway and because of the frequent association of tracheal or bronchial stenosis due to complete cartilage rings (5). This can result in obstruction, feeding problems, and respiratory tract infections. Occasionally, the abnormality may be detected as an incidental finding in an asymptomatic adult or in the adult with respiratory complaints.
 Figure 16-9 CE MRA in a 69-year-old male patient depicts the normal pulmonary arteries. Oblique axial (A), coronal (B), and sagittal (C) subvolume MIPs demonstrate the pulmonary branches and their branches. Volume rendering reformat (D) also allows a good demonstration of these structures and their interrelation. (T, pulmonary trunk; R, right pulmonary artery; L, left pulmonary artery; RU, right upper trunk; RL, right lower trunk; LU, left upper trunk; LL, left lower trunk; RA, right atrium.) (Courtesy of Neil M. Rofsky, MD, Beth Israel Deaconess Medical Center, Boston.) |
The aberrant left pulmonary artery originates from the right pulmonary artery and travels across the midline posterior to the distal trachea or right main bronchus, where it turns abruptly to the left, passing between the esophagus and trachea to its destination in the left hilum (Fig. 16-12). CT and MRA with 3D visualization of complicated vascular anatomy are vital prerequisites for appropriate surgical planning of this and similar congenital disorders (5) (Fig. 16-13).
Systemic Arterial Supply to the Lung
A pulmonary sequestration consists of nonfunctioning lung tissue that is not in normal continuity with the tracheobronchial tree; it derives its blood supply from systemic vessels (Figs. 16-14, 16-15). Depending on the pleural coverage, the condition is described as “intralobar” or “extralobar.” Intralobar sequestrations account for 75% of all pulmonary sequestrations. An intralobar sequestration consists of an abnormal segment of lung tissue that shares
the visceral pleural covering of an otherwise normal pulmonary lobe and that lacks a normal communication to the tracheobronchial tree.
the visceral pleural covering of an otherwise normal pulmonary lobe and that lacks a normal communication to the tracheobronchial tree.
 Figure 16-10 Images from a thoracic CT angiographic study performed with a 16-detector-row scanner. A: Axial 1-mm-thick CT scan obtained just below the aortic arch (window center, 50 HU; window width, 350 HU) shows enlarged bronchial arteries (arrow) manifesting as avidly enhancing nodules in the paratracheal and retrobronchial regions of the mediastinum. These findings represent the typical appearance of enlarged bronchial arteries on axial images. Although the origins of the bronchial arteries are well depicted on axial images, their further course is very tortuous, and the intrapulmonary direction of the artery can be difficult to ascertain. B: Coronal thin-section MIP image clearly demonstrates an enlarged intercostobronchial artery (arrows) coursing into the pulmonary parenchyma parallel to the bronchial airways. C: Coronal thin-section MIP image obtained in a different patient provides a detailed analysis of the entire intrapulmonary course of an intercostobronchial artery (arrows). (☆, intracavitary mycetoma.) D: Reformatted image demonstrates how CTA can provide anatomic information that is useful for planning subsequent bronchial artery embolization. (Reprinted with permission from Bruzzi JF, Remy-Jardin M, Delhaye D, et al. Multi-detector row CT of hemoptysis. Radiographics. 2006;26:3–22.) |
Extralobar sequestrations are a completely distinct entity and constitute 25% of all pulmonary sequestrations (Fig. 16-16). The malformation is typically found during the patients’ first days to weeks of life and less frequently in late infancy or early childhood. An extralobar sequestration consists of a discrete, accessory lobe of nonaerated lung tissue that is invested in its own pleural envelope (53,54,55).
Disorders of the systemic arterial supply to the lung are an infrequent cause of massive hemoptysis that can lead to death, mainly by asphyxiation. Systemic arterialization of the lung parenchyma is most often congenital, in which case an aberrant systemic artery supplies the parenchyma involved in congenital pulmonary venolobar syndrome or bronchopulmonary sequestration (56). Often, these congenital conditions go unnoticed until hemoptysis occurs, leading to diagnostic workup and detection of the disorder.
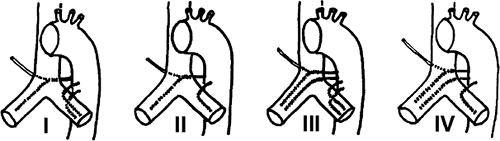 Figure 16-11 Diagrams illustrating the types of bronchial arterial supply. Type I, two bronchial arteries on the left and one on the right that manifests as an ICBT (40.6% of cases); Type II, one on the left and one ICBT on the right (21.3%); Type III, two on the left and two on the right (one ICBT and one bronchial artery) (20.6%); and Type IV, one on the left and two on the right (one ICBT and one bronchial artery) (9.7%). (Adapted with permission from Yoon W, Kim JK, Kim YH, et al. Bronchial and nonbronchial systemic artery embolization for life-threatening hemoptysis: a comprehensive review. Radiographics. 2002;22:1395–1409.) |
Pulmonary Veins: Normal Anatomy
Pulmonary venous anatomy does not mirror pulmonary artery anatomy. Four pulmonary veins drain typically into the left atrium (Figs. 16-17, 16-18). Normally, the right and left upper lobe pulmonary veins drain the right upper and middle lobe, and the left upper lobe and lingula, respectively (Fig. 16-19). The lower lobe pulmonary veins drain their corresponding lower lobe (57,58,59).
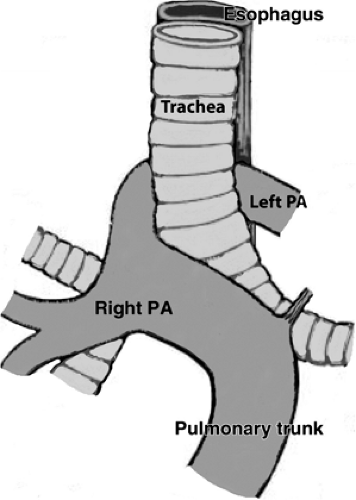 Figure 16-12 Diagram shows an anterior view of the anomalous origin of a left pulmonary artery (PA) that arises from the posterior aspect of the right pulmonary artery and reaches the left hilum by passing between the trachea and the esophagus. (Reprinted with permission from Castaner E, Gallardo X, Rimola J, et al. Congenital and acquired pulmonary artery anomalies in the adult: radiologic overview. Radiographics. 2006;26:349–371.) |
The course of the pulmonary veins is quite different from that of the pulmonary arteries. The upper lobe (superior) pulmonary veins course downward, posteriorly and medially, the left superior pulmonary vein lies in the angle between the left main pulmonary artery and the left upper lobe pulmonary artery. On the right side, the upper pulmonary vein lies adjacent and lateral to the superior vena cava, and medial to the right upper lobe pulmonary artery (Fig. 16-18).
The middle lobe pulmonary vein, which is considerably smaller that the other main pulmonary veins, normally empties into the right superior pulmonary vein just before it empties into the left atrium (Figs. 16-17, 16-19). The lingular pulmonary vein almost always empties into the left superior pulmonary vein and only rarely empties directly into the left atrium.
Unlike the superior pulmonary veins, the inferior pulmonary veins describe a horizontal course for several centimeters prior to emptying into the left atrium. Also, the plane of the inferior pulmonary veins is substantially more posterior to that of the superior pulmonary veins. The pulmonary vein trunk, defined as the distance from the ostium to the first tributary, is usually longer for the upper lobe than the lower lobe pulmonary veins.
Pulmonary Vein Mapping Prior to Radio Frequency Ablation for Atrial Fibrillation
An increased interest in the assessment of the anatomic configuration and size of the pulmonary veins is the result of new therapies for treatment of atrial fibrillation with radio frequency ablation. Arrythmogenic foci are commonly located at the ostium of the pulmonary veins, and they are an important source of ectopic atrial electrical activity (60,61,62). Selective radio frequency ablation of arrythmogenic foci in the pulmonary veins is increasingly being performed to treat patients with
refractory atrial fibrillation (63). The size and shape of the pulmonary venous ostium is an important consideration in selection of the optimal diameter of the radio frequency catheter.
refractory atrial fibrillation (63). The size and shape of the pulmonary venous ostium is an important consideration in selection of the optimal diameter of the radio frequency catheter.
 Figure 16-13 Anomalous origin of the left pulmonary artery from the right (“pulmonary sling”) in a dyspneic child. CT scan displayed as transverse MIP shows the course of an anomalous left pulmonary artery (arrow in A). Originating from the posterior surface of the right pulmonary artery, it passes posteriorly adjacent to the trachea (T) and turns to the left to enter the left hilum. Volume-rendered display viewed posteriorly (B) shows the relation of the left pulmonary artery (L) with abnormal origin (*) to other anatomical structures within the thorax and shows mild aortic coarctation (arrow in B) as an additional finding. Volume-rendered display of the airways (C) shows compression of the trachea (arrow in C). (Courtesy of Roman Fischbach, MD, Muenster, Germany.) |
CE CT (64) and gadolinium-enhanced MR imaging (65) provide accurate demonstration of pulmonary vein location, number, ostial size, branching pattern, and length of the pulmonary vein trunk prior to ablation being performed and additionally offer an ideal method for detection of procedure-related complications such as pulmonary vein stenosis (61,62) (Fig. 16-20) and occlusion (Fig. 16-21). In addition, atrial or atrial appendage thrombus, an absolute contraindication to the procedure, can be excluded. A reduction in pulmonary vein diameter, circumference, and cross-sectional area can occur as a result of radio frequency ablation therapy for atrial fibrillation (66), and it is more pronounced with increasing number of therapeutic radio frequency ablations (67). The left inferior pulmonary vein normally narrows as it enters the left atrium, and therefore, diagnosis of stenosis in this vessel should be made with caution (64).
Gadolinium-enhanced MRI provides a detailed examination of the pulmonary vasculature and possible collateral pathways in the chest in a single breath-hold, without using ionizing radiation or iodinated contrast. There is excellent correlation between the MR findings and those at cardiac catheterization, echocardiogram, and intraoperative findings. MR provides additional information regarding the
anatomy of the pulmonary veins (number and size), presence of stenosis, or aneurysmal dilatation as well as presence of additional vascular anomalies (68).
anatomy of the pulmonary veins (number and size), presence of stenosis, or aneurysmal dilatation as well as presence of additional vascular anomalies (68).
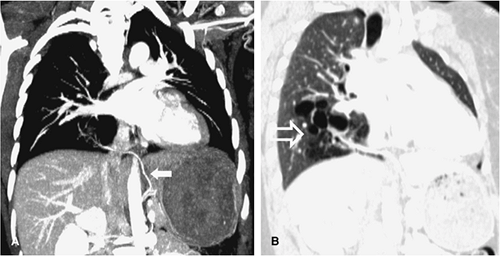 Figure 16-14 High-resolution CE multidetector-row CT. A: A coronal MIP, which allows for visualization of an aberrant vessel (arrow) of the abdominal aorta supplying a bronchopulmonary sequestration. B: Lung window settings enable evaluation of the sequestration (arrow) with cystic components from the same scan. (Courtesy of James Ravenel, MD, Charleston, SC.) |
2D cine steady-state free precession pulse sequences demonstrate significant changes in the location and size of the pulmonary vein ostium that occur during the cardiac cycle (69,70). A comparison between 2D cine sequences and a 3D gadolinium-enhanced MR approach showed an increased sharpness of the pulmonary vein borders with cine sequences. In addition, cine images can resolve differences in diameter across the cardiac cycle.
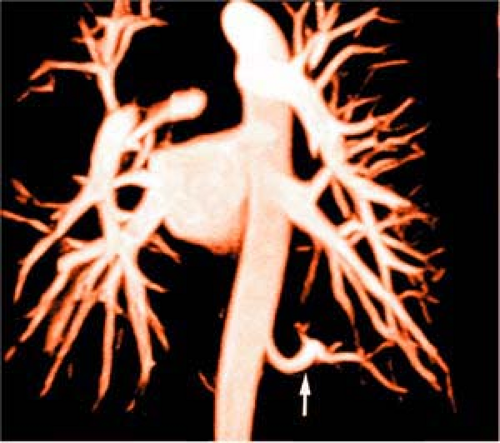 Figure 16-15 Pulmonary sequestration. Subvolume MIP from 3D CE MRA shows a feeding vessel (arrow) from the aorta to a pulmonary sequestration. |
3D gadolinium-enhanced MR images tend to overestimate the size of the ostium and suffer from blurriness at the edges of the pulmonary veins due to pulsatile motion. Nevertheless, 3D gadolinium-enhanced MRI provides a comprehensive display of the pulmonary vein anatomy that simplifies understanding of the anatomy, particularly in patients with complex anatomic variants. Furthermore, 3D acquisitions are significantly faster than 2D cine acquisitions for the same anatomic coverage (71).
Since many of these patients have an implanted pacemaker or defibrillator, CT plays an important role. CT of the pulmonary veins can be performed without gating. Retrospectively gated images can compensate for cardiac motion and do produce sharper images. Whether or not the uncertain clinical benefit of these sharper images offsets the increased radiation dose and contrast load remains to be determined. A bolus tracking cursor is placed in the left atrium. A craniocaudal field from the aortic arch to the diaphragm is prescribed. The amount of contrast needed is determined by the product of the injection rate (usually 4 to 5 mL/second) and the scan duration; 10 mL can be added to offset the small pause between the detection of the bolus and the initiation of scanning. A saline flush is used. It is recommended for scanning to occur from inferior to superior to minimize artifacts from the superior vena cava.
 Figure 16-16 Extralobar sequestration with CTA. Axial and coronal thin-volume MIP (A and B,respectively) and 3D volume rendering (C) showing the sequestration (* in A), the arterial feeding vessel (red arrows) arising from the descending thoracic aorta, and an aberrant vein connecting with the brachiocephalic vein (blue arrows). (Courtesy of Stanford Cardiovascular Imaging.) |
Variant Anatomy: Veins
Developmental anomalies of the pulmonary veins are common (60,61,62) (Fig. 16-22). A common pulmonary vein on one side (representing conjoined upper and lower pulmonary veins) occurs in up to 25% of individuals; however, in clinical practice, a single common vein on the left is quite common whereas a common right pulmonary vein is extremely uncommon. As expected, a common pulmonary vein trunk has a significantly larger diameter (Fig. 16-23B) than individual upper or lower lobe pulmonary veins. The middle lobe pulmonary vein usually drains into the upper lobe pulmonary vein proximal to the left atrium but drains separately into the left atrium in 19% of patients (Fig. 16-23A), shares a common ostium to the proximal part of the right superior pulmonary vein in 69% of patients, and joins with the right inferior pulmonary vein in 8% of cases (61).
Anomalous Pulmonary Venous Drainage
The term anomalous pulmonary venous drainage describes the condition where part or all of the venous drainage of one or both lungs drains into the right atrium or its tributaries (72,73). Several anomalous pulmonary and systemic connections exist. These anomalous drainages can be partial or total.
Abnormalities can be classified into four categories: supracardiac, cardiac, infracardiac, and mixed. The
supracardiac drains to the superior vena cava or azygous vein; the cardiac type drains to the coronary sinus or right atrium; the infracardiac type drains to the portal vein, ductus venosus, or the inferior vena cava; and mixed type (∼5%) represents some combination of two or more of the above anomalies.
supracardiac drains to the superior vena cava or azygous vein; the cardiac type drains to the coronary sinus or right atrium; the infracardiac type drains to the portal vein, ductus venosus, or the inferior vena cava; and mixed type (∼5%) represents some combination of two or more of the above anomalies.
 Figure 16-17 CE ECG-gated cardiac CT displayed as volume rendering seen from posterior shows normal configuration of the pulmonary venous return to the left atrium with the left upper lobe vein (LULV) and the left lower lobe vein (LLLV) draining the left lung and the right upper lobe vein (RULV) and the right lower lobe vein (RLLV) draining the right lung. |
Totally Anomalous Pulmonary Venous Drainage
In totally anomalous pulmonary venous drainage (TAPVD), there is complete failure of the pulmonary veins to reach the left atrium. Instead, the pulmonary veins coalesce into a common pulmonary vein behind the heart.
Onward drainage is then via one of three routes—(a) a vertical vein that ultimately empties into the right atrium via the left brachiocephalic vein and SVC (supracardiac type, Fig. 16-24), (b) direct drainage into the right atrium or coronary sinus (intracardiac type), or (c) via a vertically draining inferior vein that passes through the diaphragm and enters into the portal vein or ductus venosus (infracardiac type).
In all such cases, survival depends on an obligatory right-to-left shunt. Associated anomalies such as atrial septal defect (ASD), ventricular septal defect (VSD), aortic coarctation, or interrupted arch are present in up to 30% of cases. Patients with asplenia syndrome always have associated TAPVD (60).
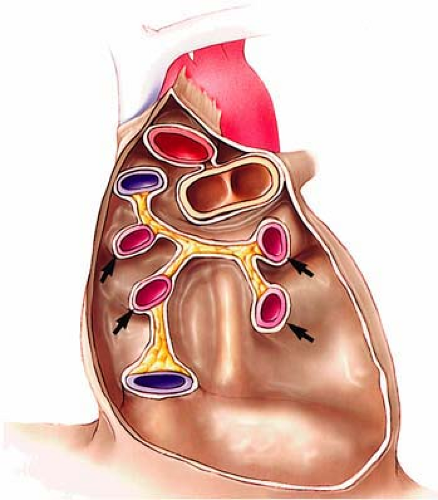 Figure 16-18 Drawing of the pulmonary veins as they reach the left atrium. The heart has been removed, and the relationship of the four pulmonary veins can be appreciated (arrows). (Reprinted with permission from Lawler LP, Corl FM, Fishman EK. Multi-detector row and volume-rendered CT of the normal and accessory flow pathways of the thoracic systemic and pulmonary veins. Radiographics. 2002;22:S45–S60.) |
Partially Anomalous Pulmonary Venous Drainage
In most instances, the anomalous veins follow a normal course within the lung; it is only the “termination” of the vein that is anomalous (74). Physiologically, an extracardiac physiologic left-to-right shunt ensues but is commonly asymptomatic. Clinical presentation is similar to individuals with an ASD.
Examples include partially anomalous pulmonary venous drainage (PAPVD), where an upper lobe pulmonary vein drains into the superior vena cava, azygous vein, right atrium, left-sided SVC, left brachiocephalic vein (Fig. 16-25), or coronary sinus. This anomaly is frequently associated with an atrial septal defect (74).
Scimitar Syndrome
The hypogenetic lung (or Scimitar) syndrome is an example of PAPVD in which the right lung, usually in its entirety (although occasionally only the right middle or lower lobe) drains via a large vein (the so-called “scimitar” vein because of its shape) that parallels the right cardiac
border to the inferior cava, just above the diaphragm (72,73) (Fig. 16-26).
border to the inferior cava, just above the diaphragm (72,73) (Fig. 16-26).
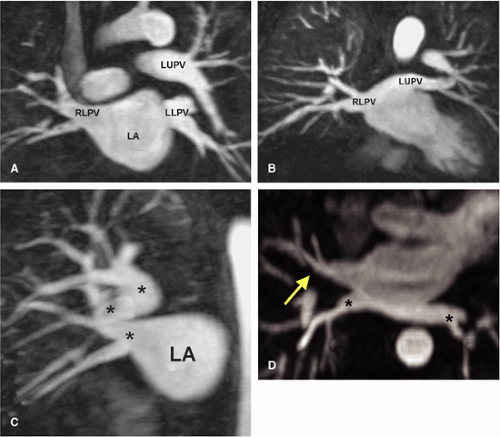 Figure 16-19 CE MRA/venography. A: Coronal reformat through the left atrium (LA) demonstrates the left upper and left and right lower pulmonary veins (LUPV, LLPV, and RLPV, respectively). B: At a slightly different level the left upper (LUPV) and right lower pulmonary veins (RLPV) are optimally demonstrated. C: Sagittal oblique image demonstrates the right upper pulmonary vein (*) as it enters the left atrium (LA). D: Axial reformat demonstrates the typical orientation of the lower pulmonary veins (*) as they course anteriorly and medially to the left atrium. Also, note the two tributaries from the middle lobe (arrow) that join together to form a common trunk, which usually joins with the right upper pulmonary vein just before emptying into the left atrium. |
This condition is usually discovered incidentally on imaging studies of the thorax. With the Scimitar syndrome, a proportion of oxygenated blood passes around in an “endless” loop from pulmonary vasculature to right atrium to pulmonary vasculature, an extracardiac left-to-right shunt. This condition may assume clinical relevance in patients with abnormal lung function or in patients in whom resection of another lobe or lobes might result in cardiorespiratory compromise.
Clinical Applications
Acute Pulmonary Embolism
Background
PE has a suspected incidence of three cases in 1,000 persons per year in Western society and an estimated 600,000 cases per year in the United States (75,76,77,78,79). Unsuspected PE is the cause of death in 5% of unselected autopsies, and PE contributes to the cause of death in another 10% (79,80,81).
PE is said to be the cause of death in 15% of inpatients (79), although this figure is disputed (80). Additionally, in those patients shown at autopsy to have died of unsuspected massive PE, it has been estimated that 21% would have had a favorable prognosis had the diagnosis been established, while the remainder were split evenly between those in whom establishing a diagnosis would not have made a difference due to severe associated comorbid conditions and those who would have a favorable prognosis in any case (80,81,82,83,84).
PE is said to be the cause of death in 15% of inpatients (79), although this figure is disputed (80). Additionally, in those patients shown at autopsy to have died of unsuspected massive PE, it has been estimated that 21% would have had a favorable prognosis had the diagnosis been established, while the remainder were split evenly between those in whom establishing a diagnosis would not have made a difference due to severe associated comorbid conditions and those who would have a favorable prognosis in any case (80,81,82,83,84).
 Figure 16-20 Postablation pulmonary vein stenosis. This oblique reformatted image from a CE MRA exam reveals a stenosed left inferior pulmonary vein (arrow) following ablation therapy for atrial fibrillation. (Courtesy of Thomas Hauser, MD, and Warren Manning, MD, Beth Israel Deaconess Medical Center, Boston, MA.) |
The importance of establishing a diagnosis of PE is paramount, owing to a 10-fold difference in mortality between untreated PE (30%) and treated PE (3%) (75,78,82,83,84). However, the imperative to treat PE must be tempered by the fact that PE is infrequently present even in patients with a high clinical suspicion (most studies report a prevalence of 20% to 40%) (79), and treatment must be withheld in patients without PE due to a high prevalence of (potentially fatal) hemorrhagic complications in patients undergoing anticoagulation (85,86).
Because the definitive diagnostic test, catheter angiography, is invasive and has an attendant but rare fatal complication risk (87,88,89,90), diagnostic strategies for PE are often complex and focus initially on determining whether a PE might be present without recourse to imaging the pulmonary arteries (15,91,92,93,94,95,96,97,98).
Strategies aimed at eliminating the need for catheter angiography include ventilation-perfusion lung scanning (94,98), estimation of blood D-dimer levels (15,91,95,96


Stay updated, free articles. Join our Telegram channel
Full access? Get Clinical Tree
