Principles of Magnetic Resonance Angiography
Frank R. Korosec
Magnetic resonance imaging (MRI) is a versatile and useful imaging modality that provides a wealth of diagnostic information. It is able to demonstrate, with striking contrast, differences in signal intensities among different soft tissues. A host of MR imaging parameters can be modified to exploit any one of a number of tissue-specific properties to manipulate image contrast. MRI derives signal using a magnetic field and radiofrequency energy, not ionizing radiation or radioactive materials like other medical imaging systems. Also, MRI is capable of providing tomographic images of any plane without requiring movement of the patient or any of the equipment.
MRI was introduced clinically in the early 1980s, and its applications have grown rapidly and immensely since. A subset of MR techniques, referred to as magnetic resonance angiography (MRA) methods, is described in this chapter. The chapter begins with an overview of the principles of MRI. This is followed by a description of some phenomena that negatively affect all MRA techniques. Finally, the physical principles, benefits, and limitations of specific MRA techniques are discussed. Additional overviews of MRA techniques may be found in References 1 through 5.
Magnetic Resonance Imaging—Overview
MRI may be used to image nuclei of atoms containing an odd number of protons and/or neutrons. The nucleus of the hydrogen atom on the water molecule satisfies this criterion, as it is composed of a single proton. Because of its abundance in the body, the hydrogen nucleus on the water molecule is imaged in MRI.
The hydrogen nucleus possesses a magnetic dipole moment and will interact with a magnetic field as if it were a tiny bar magnet. The magnetic dipole moment of a hydrogen nucleus can either align or antialign with the strong magnetic field of the MRI scanner. In an ensemble of hydrogen nuclei, the majority will align because it requires less energy than antialigning. The net sum of the magnetic dipole moments from an ensemble of nuclei will yield a bulk magnetization that is aligned with the applied magnetic field. It is this bulk magnetization that is considered in discussions regarding MRI.
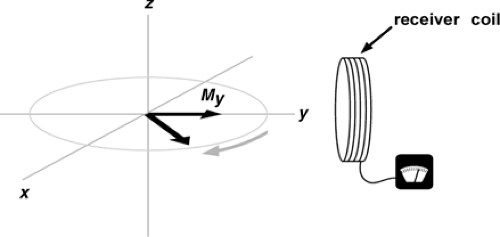
In MRI, signal is generated when the bulk magnetization is tipped out of alignment with the applied magnetic field. The maximum signal is generated when the aligned (longitudinal) magnetization is tipped 90 degrees so that it is perpendicular (transverse) to the direction of the applied magnetic field. A pulse of radio frequency (RF) energy is used to tip the longitudinal magnetization transverse. When the magnetization is transverse, it rotates, or precesses, around as shown in Figure 2-1. A receiver coil is placed perpendicular to the direction of the applied magnetic field to detect the oscillating signal that is generated by the precessing bulk magnetization. The precessional rate (and the frequency of the generated signal) is proportional to the strength of the applied magnetic field.
Magnetic field gradients that vary linearly with position are superimposed on the spatially uniform magnetic field during imaging. The resulting spatially varying magnetic fields cause the bulk magnetization at different locations to precess at different rates. Thus, transverse magnetization at different locations will produce signals with different frequencies. During image reconstruction, the detected signals are mapped to the proper positions based on their frequencies. Magnetic field gradients are strategically applied on each of the cartesian axes during imaging to map signal to position in all three dimensions.
Signal intensity in MR depends on a number of factors, and there are a host of parameters in MR imaging protocols that can be modified to accentuate the influence of these factors. One factor that influences signal intensity is the magnitude of the transverse magnetization. The transverse component of magnetization diminishes, or decays, exponentially with time. The rate of decay is characterized by a time constant called T2. The decay rate depends on the microstructure of the tissue surrounding the magnetic dipole moments that make up the bulk magnetization. Since different tissues have dissimilar microstructures, they have distinct T2 decay times. So, as time elapses, the transverse magnetization from different tissues decays by different amounts. Tissues with short T2 decay times lose transverse magnetization quickly, whereas tissues with long T2 decay times lose it more slowly. Thus, allowing time to elapse between tipping the magnetization transverse and detecting it allows achievement of signal differences from tissues with distinct T2 decay times. The time from when the magnetization is tipped transverse until the signal is detected is controlled by the MR imaging parameter TE (echo time). Because scans with longer echo times accentuate signal differences based on variations in T2 decay times, they are referred to as T2 weighted.
Another factor that affects signal intensity in MRI is the amplitude of the longitudinal magnetization. After the bulk magnetization is tipped transverse, the longitudinal component begins to regrow exponentially. This rate of regrowth is characterized by a time constant called T1. The regrowth rate depends on the microstructure of the tissue surrounding the magnetic dipole moments that make up the bulk magnetization. Since different tissues have dissimilar microstructures, they have distinct T1 regrowth times. In MR, the longitudinal magnetization must be tipped many times in order to encode enough information to map the signals to the proper locations in the image. If only a short time elapses between application of one tipping pulse and the next, the longitudinal magnetization does not fully regrow. Furthermore, the longitudinal magnetization from short T1 tissues regrows more than the longitudinal magnetization from long T1 tissues. Thus, allowing only a short amount of time to elapse between tipping pulses ensures different amounts of magnetization are tipped transverse. This leads to generation of distinct signals from different tissues based on variations in T1 regrowth times. The time between tipping pulses is controlled by the MR imaging parameter TR (repetition time). Since scans with shorter repetition times accentuate signal differences based on variations in T1 regrowth times, they are referred to as T1 weighted. In order to minimize T2 weighting in these scans, the shortest possible echo time is used. In order to minimize T1 weighting in T2-weighted scans, a long TR is used.
When a long TR and a short TE are used, the signal is not dependent on T1 or T2 differences. In this case, the signal intensity depends on the density of hydrogen nuclei (on the water molecule) in each tissue. Since the hydrogen nucleus consists of a single proton, these scans are referred to as proton density weighted.
In addition to being influenced by T2, T1, and proton density, the signal in MRI is influenced by diffusion, temperature, magnetic field strength, motion, injection of a T1-shortening contrast material, and many other factors. MRA techniques achieve contrast by harnessing the effects of motion (phase contrast and time-of-flight MRA) and injection of a T1-shortening contrast material (contrast-enhanced MRA).
Magnetic Resonance Angiography—Limitations
Shortly after the introduction of MRI, it was realized that this modality could be used to obtain images of the blood vessels. Since then, numerous magnetic resonance angiography methods have been developed for non- or minimally invasive assessment of vascular disease. MRA has many desirable attributes. For example, it can be used to demonstrate
vascular information in three dimensions, provide information regarding the velocity and volume flow rate of blood, and produce angiograms without the use of an iodinated contrast material or ionizing radiation. In addition, MR permits soft tissues to be imaged. Therefore, in a single exam, both vascular pathology and its effect on the target tissues may be assessed. In the context of neuroimaging, MR also may be used to gather information regarding diffusion, perfusion (cerebral blood volume, cerebral blood flow, and mean transit time), brain function, and relative metabolite concentration, permitting a comprehensive evaluation using a single modality.
vascular information in three dimensions, provide information regarding the velocity and volume flow rate of blood, and produce angiograms without the use of an iodinated contrast material or ionizing radiation. In addition, MR permits soft tissues to be imaged. Therefore, in a single exam, both vascular pathology and its effect on the target tissues may be assessed. In the context of neuroimaging, MR also may be used to gather information regarding diffusion, perfusion (cerebral blood volume, cerebral blood flow, and mean transit time), brain function, and relative metabolite concentration, permitting a comprehensive evaluation using a single modality.
MRA, however, is not without its limitations. All MRA techniques are susceptible to phenomena that cause image degradation. Fortunately, an understanding of these phenomena permits wise selection of imaging parameters and image-enhancing options that lead to minimization of the adverse effects resulting from these phenomena, allowing consistent acquisition of high-quality MR angiograms. Three phenomena that cause image degradation in all MRA techniques are intravoxel dephasing, signal saturation, and signal ghosting. Because they affect all MRA techniques, they are described early in this chapter. The sensitivities of each of the MRA techniques to these phenomena are described later in the chapter.
In MR, the largest signal is produced when the transverse components of the magnetization from all of the nuclei within a voxel are aligned with one another. When they are aligned and rotating in synchronization, all of the signals from the magnetization add constructively to produce a large net signal. If for some reason the transverse components of the magnetization from the nuclei within a voxel start to rotate at different rates, the synchronized condition will decay. The signals from these different nuclei will then begin to destructively interfere with each other, leading to a diminished net signal from that voxel. This phenomenon is referred to as intravoxel dephasing, or phase dispersion. In MRI, intravoxel dephasing causes signal loss in regions of magnetic field inhomogeneity and at interfaces of tissues having different magnetic susceptibilities.
In MRA, signal loss due to intravoxel dephasing also occurs when nuclei having different velocities are present in the same voxel. This can be explained in the following way. In MRI, nuclei rotate at different rates depending on the magnetic field strength that they experience. If nuclei in a voxel have different velocities, they have traveled different distances to reach that voxel (from the time the magnetization is tipped transverse until the time the signal is detected). This means they have experienced different magnetic field strengths as they traveled to that voxel (due to the application of the spatially varying magnetic field gradients that are used for imaging). This leads to varied amounts of phase accumulation for the magnetization from the different nuclei, resulting in some element of destructive interference, in turn affecting the signals received from them. To the extent that protons are out of phase at the time of the echo measurement, signal is lost.
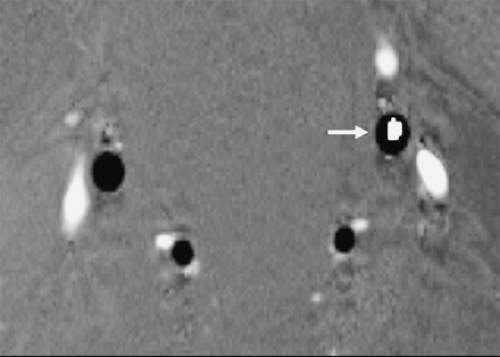
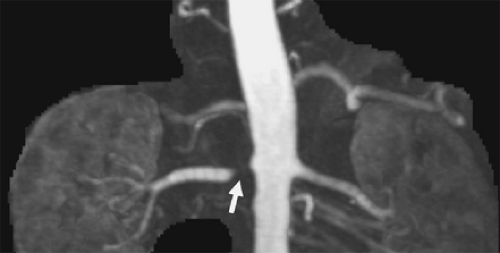 Figure 2-2 In regions of complex flow, intravoxel dephasing can lead to complete signal loss as is demonstrated here in this coronal image showing a tight stenosis of the right renal artery (arrow). |
Certain types of vascular pathology, including stenoses, generate complex patterns of flow, which causes blood at various locations to travel at different velocities. Thus, blood flowing in the vicinity of stenoses often suffers from signal loss. In the vicinity of very tight or irregularly shaped stenoses, complete signal loss may result, as is shown in Figure 2-2. In these situations, it can be inferred that pathology is present, but details regarding the pathology cannot be determined.
Blood flows at varying velocities as it accelerates around corners; thus, there can be signal loss in regions where vessels turn sharply. These losses in signal can mimic those caused by tight stenoses, which is an important consideration when interpreting images.
Intravascular signal loss can also occur due to susceptibility-induced intravoxel dephasing. In the MR scanner, different amounts of magnetization are induced in tissues with different magnetic susceptibilities. As blood flows past these different tissues, it is influenced by different magnetic fields. High fields cause the magnetization in blood to precess quickly, and lower fields cause magnetization in the blood to precess more slowly. These different precessional rates lead to intravoxel dephasing, which results in signal loss. It is common to observe signal loss in blood vessels as they pass through the skull base due to the magnetic
susceptibility differences between bone, extravascular tissues, and intraluminal blood.
susceptibility differences between bone, extravascular tissues, and intraluminal blood.
The amount of intravoxel dephasing can be reduced by using a short echo time. Using a short TE permits the signal to be detected before the magnetization has had time to dephase. Dephasing only occurs during the TE—from the time the magnetization is tipped into the transverse plane, until the time that the receiver is turned on and the signal is detected. Shortening the TE reduces the amount of time that the magnetization is permitted to dephase. Hence, by employing shorter TEs, these types of signal losses are reduced.
The amount of intravoxel dephasing can also be reduced by using small voxels. This is because magnetization from one voxel is not combined with magnetization from another voxel. Therefore, by using small voxels, the amount of magnetization that is permitted to combine incoherently is reduced, thus limiting signal loss.
Finally, intravoxel dephasing may also be reduced by activating an image-enhancing feature called flow compensation. This feature eliminates phase shifts accumulated by blood that is moving at constant velocities. Flow compensation is described more fully later in this chapter.
Another phenomenon that leads to signal loss in MR angiograms is referred to as signal saturation. Signal saturation is a diminution of signal caused by rapid and repeated application of radio frequency excitation pulses to an image slice or volume, as shown in Figure 2-3. The rapid and repeated application of these pulses limits the regrowth of longitudinal magnetization of blood. This reduces the magnetization available to generate signal after application of subsequent radio frequency excitation pulses. All MRA methods employ rapid application of radio frequency pulses (short TRs), so saturation of vascular signal is an inherent limitation of all the MRA techniques. The more radio frequency pulses blood experiences, the greater the saturation, until eventually an equilibrium saturation level is reached. Thus, the longer blood stays in an image slice or volume, the more saturated it becomes. Methods to reduce signal saturation have been determined. In general, increasing the TR, reducing the tip angle, decreasing the thickness of the image slice or volume, strategically prescribing the acquisition to ensure that blood spends little time in the slice, and administering a T1-shortening contrast material are all strategies that lead to reduced signal saturation.
These and other methods used to minimize signal saturation are described in more detail throughout this chapter.
These and other methods used to minimize signal saturation are described in more detail throughout this chapter.
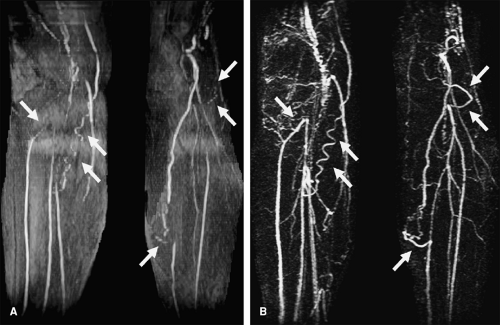
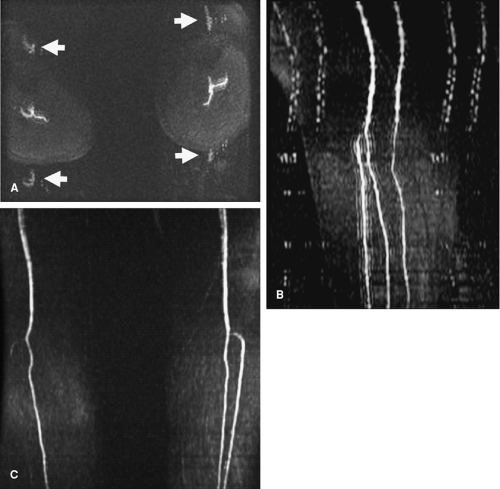
A third phenomenon that affects the quality of MR angiograms is referred to as signal ghosting. Ghosting is the replication of signal in an image, resulting in an object appearing at one or more locations where it does not exist, as shown in Figure 2-4. Because replicas appear in locations where the object does not exist, they are referred to as ghosts. Signal ghosting originates from several sources. One source of ghosting is variation of signal intensity throughout image acquisition. Because blood flow is subject to variations from the rhythmic beating of the heart, spins in the blood move along the gradients in a varied manner. This motion generates phase gain or loss, resulting in artifacts that appear along the phase-encoding axis. (The position along the phase-encoding axis is encoded at a specific phase). Mismapped phase information can appear as a varying signal or ghosts of the pulsating vessels in the image. It is the phase shifts of spins flowing along the imaging gradients during the finite time required between phase encoding and signal sampling that produce these ghosts.
Signal ghosts originating from this source can be reduced or eliminated by collecting data for an image always at the same time frame, or phase, within the cardiac cycle. This increases the likelihood that the blood will be flowing at the same velocity during acquisition of all of the data for an image. Elimination of signal variation removes the ghosts.
Like all imaging methods, MR vascular imaging methods have benefits and limitations. The limitations can be minimized and the benefits exploited by understanding the
characteristics of the MRA methods. This understanding is helpful in selecting the appropriate method and scan parameters for the desired application. Some of the more important benefits and limitations of all MRA methods are summarized in Table 2-1.
characteristics of the MRA methods. This understanding is helpful in selecting the appropriate method and scan parameters for the desired application. Some of the more important benefits and limitations of all MRA methods are summarized in Table 2-1.
Table 2-1 Benefits and Limitations of Magnetic Resonance Angiography | ||
|---|---|---|
|
Magnetic Resonance Angiography—Specific Methods
The most widely used MRA techniques can be categorized as phase contrast, time-of-flight, or contrast-enhanced MRA techniques. In the remainder of this chapter, an overview of the principles of these techniques is provided, examples of clinical applications are shown, and the benefits and limitations of each of the specific methods are discussed. In addition, two other techniques that can be useful for vascular assessments, dark blood imaging and steady state free precession, will also be discussed.
Phase Contrast Magnetic Resonance Angiography
It is a fundamental MR principle that spins subjected to a magnetic field gradient acquire a shift in their phase of rotation that is proportional to the strength of the field. Moving spins will acquire a phase shift that is related to the distance traveled along the gradient and, therefore, related to the velocity of the spins. Phase contrast MRA capitalizes on this phenomenon such that spin velocities are encoded into a map of the vessels of interest. Thus, those phase contrast techniques that rely exclusively on phase data yield images with complete suppression of stationary tissue (with no velocity, there is no signal). When using PC techniques, stationary tissues that might appear bright by virtue of T1 or T2 characteristics will not be confused with flow.
Phase contrast MRA (6,7) is similar to conventional x-ray angiography in that both methods employ subtraction to eliminate signals from stationary tissues. As a result, only signals from flowing blood are present in the angiogram. Phase contrast MRA differs from conventional x-ray angiography in that no contrast media injection is required with the former method. The mechanism responsible for generating signal in phase contrast MRA is the motion of the blood.
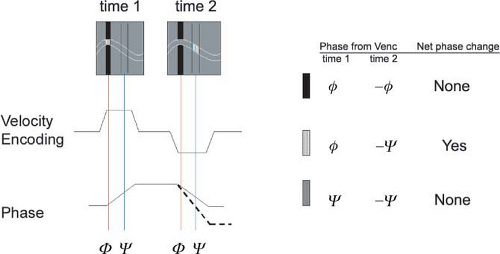
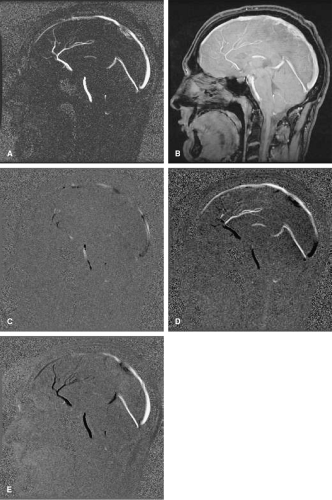
Phase contrast techniques derive contrast between flowing blood and stationary tissues by manipulating the phase of the magnetization, such that the phase of the magnetization is zero for stationary tissues and nonzero for moving tissues (Fig. 2-5). Phase is a measure of how far the magnetization precesses, or rotates, from the time it is tipped into the transverse plane until the time it is detected. The data acquired with phase contrast techniques can be processed to produce magnitude, phase difference, and complex difference images.
In magnitude images, the strength of the magnetization at each point in the object is displayed in the appropriate pixel in the image. This is the typical display method employed in general MR imaging. With phase contrast methods, the phase of the magnetization is manipulated, but the strength of the magnetization, or its magnitude, is unaltered. Thus, displaying the magnitude of the magnetization permits simultaneous demonstration of vessels and stationary tissues.
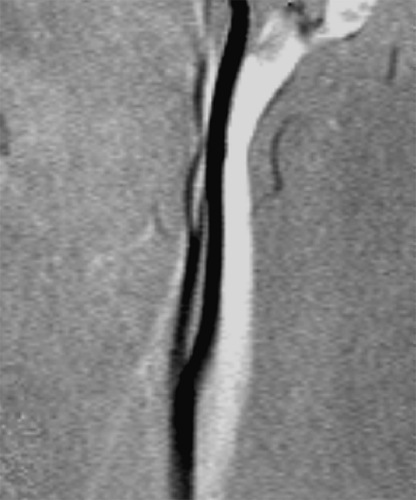
In phase difference images, the signal is linearly proportional to the velocity of the blood—the faster the motion of the blood, the larger the signal, and blood moving in one direction is assigned a bright (white) signal, whereas blood moving in the opposite direction is assigned a dark (black) signal (Fig. 2-6). This characteristic of phase difference images permits arteries to be effectively differentiated from veins when they are aligned antiparallel to each other, as is the case with the carotid arteries and jugular veins (Fig. 2-7). Phase difference images also can be used to
detect retrograde flow such as in subclavian steal syndrome, where a stenosis or occlusion of the subclavian artery proximal to the vertebral artery causes reversed flow in the latter.
detect retrograde flow such as in subclavian steal syndrome, where a stenosis or occlusion of the subclavian artery proximal to the vertebral artery causes reversed flow in the latter.
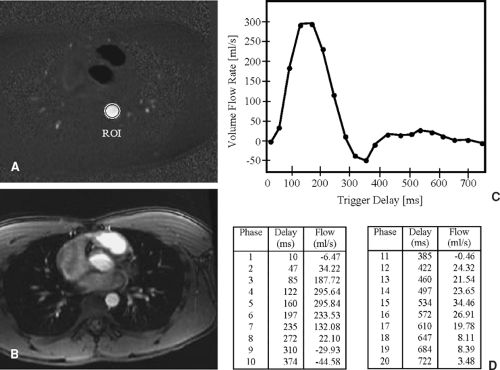
In addition to permitting assessment of vascular anatomy, phase difference images can be used to determine quantitative information regarding speed and direction of blood flow. The signal in each pixel in a phase difference image is linearly proportional to the velocity of the blood or tissue represented by that pixel. So, a cursor or region of interest (ROI) can be placed on the image, and a direct measure of the velocity (mm/sec) of the blood or tissue can be determined. In addition, if the cross section of a vessel is demonstrated in the image, information regarding the volume flow rate of the blood (mL/min) in that vessel can be derived using computer software (8). Flow volumes can be calculated from the equation Q = velocity × area, where Q is flow in mL/min, velocity is determined using the phase map images (cm/sec), and area (cm2) is defined by a user-generated ROI. By creating a cross-sectional ROI that traces the full lumen of a vessel and is perpendicular to its course, the blood volume (cm/sec × cm2 = cm3/sec, or mL/sec) can be calculated. Furthermore, if the acquisition is cardiac gated (9,10), and a series of images is produced demonstrating the cross section of a vessel throughout the cardiac cycle, then the acquired series of images can be evaluated to determine volume flow rate in that vessel throughout the cardiac cycle (Fig. 2-8). In this case, blood volume across the aorta can be integrated over the cardiac cycle (mL/cardiac cycle), and since the cardiac cycle translates to heart rate, aortic volume flow rate (mL/min) can be calculated.
The physiologic effect of vascular pathology can be evaluated by (a) comparing the volume flow rate on the contralateral side with that on the ipsilateral side, (b) by comparing the volume flow rate before and after a physical or drug-induced challenge, and (c) by comparing the volume flow rate proximal and distal to a stenosis (e.g., coarctation of the aorta).
In complex difference images, the signal strength is dependent on the velocity of the blood (as it is in phase difference images), but the dependence is not linear (as it is in phase difference images). Furthermore, the direction of blood flow is not represented, so flow in opposite directions is not represented as bright and dark as it is in phase difference images (Fig. 2-9). Therefore, complex difference images are not used to determine quantitative information regarding blood velocity or volume flow rate, but are used, instead, for demonstrating the anatomy of the vessels.
Phase contrast methods are implemented using two-dimensional or three-dimensional acquisitions (11,12). Two-dimensional acquisitions can be completed rapidly
and are effective for localizing vessels that can then be more thoroughly evaluated using other MRA techniques. In this manner, the 2D PC serves as a vascular scout series. It is also effective for performing cardiac-gated scans as described previously. Three-dimensional acquisitions are more time consuming than two-dimensional acquisitions and thus are used less frequently. Due to the long scan times associated with 3D acquisitions, they are not commonly cardiac gated. Benefits of 3D acquisitions include an inherently high signal-to-noise ratio (SNR) (due to the effective averaging of signal that is acquired throughout the entire scan) and small voxels (due to the encoding method employed). Also, thin section 3D image sets can be retrospectively reprojected or reformatted to permit observation of the vessels from any orientation. When phase difference processing is used, images reformatted perpendicular to a vessel can be used to determine volume flow rate through that vessel.
and are effective for localizing vessels that can then be more thoroughly evaluated using other MRA techniques. In this manner, the 2D PC serves as a vascular scout series. It is also effective for performing cardiac-gated scans as described previously. Three-dimensional acquisitions are more time consuming than two-dimensional acquisitions and thus are used less frequently. Due to the long scan times associated with 3D acquisitions, they are not commonly cardiac gated. Benefits of 3D acquisitions include an inherently high signal-to-noise ratio (SNR) (due to the effective averaging of signal that is acquired throughout the entire scan) and small voxels (due to the encoding method employed). Also, thin section 3D image sets can be retrospectively reprojected or reformatted to permit observation of the vessels from any orientation. When phase difference processing is used, images reformatted perpendicular to a vessel can be used to determine volume flow rate through that vessel.
Phase contrast methods are sensitive to a range of velocities. To specify this range of velocities, the user chooses a velocity-encoding (Venc) value. This range designates the flow velocities to be encompassed within the maximum 360 degrees of phase shift. The Venc is inversely related to the area of the flow-encoding gradients. Hence, for the imaging time to remain unchanged, stronger gradient amplitudes are required to encode smaller velocities.
The Venc is given in centimeters per second. It determines the highest and lowest detectable velocity encoded by a phase contrast sequence. Therefore, Venc = 100 cm/sec describes a phase contrast experiment with a measurable range of flow velocities of ±100 cm/sec.
Blood traveling at velocities higher than the Venc value will be misrepresented in the image, so the user must choose this value carefully. This misrepresentation is referred to as velocity aliasing and appears differently in phase difference and complex difference images. In phase difference images, aliased signal is easy to identify by an abrupt change from very dark to very bright signal (Fig. 2-10), or vice versa. In complex difference images, velocity aliasing manifests as a decreasing signal for blood traveling at increasing velocities above the Venc value. Blood traveling at some velocities above the Venc value gives rise to no signal at all. Thus, with complex difference processing, selecting a Venc that is too low can yield very misleading results that are not easy to identify. With both phase difference and complex difference processing, choosing a Venc value that is too low should be avoided. Choosing a Venc value that is too high should also be avoided, as it leads to all blood magnetization accumulating only small phase shifts, which results in low SNR, and a small signal range.
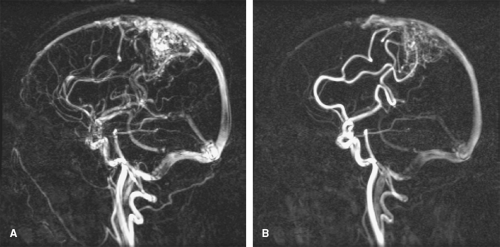
To avoid velocity aliasing, some a priori information regarding the anticipated pathology may be helpful in determining the appropriate velocity-encoding value. Often this information is not available, and in such instances, reference velocity values for normal vessels can provide a useful starting point. Alternatively, different velocity-encoding values may be used in different scans to highlight different vessels. For example, arteries and veins in an arteriovenous malformation (AVM) can be displayed in separate images that are sensitive to different velocity ranges (Fig. 2-10).
In order to encode flow in all directions with phase contrast acquisitions, a flow-encoding gradient must be applied on each of the three gradient axes in separate TR intervals. In addition, a fourth nonflow-encoded acquisition must be acquired. This nonflow-encoded acquisition is subtracted from each of the three flow-encoded acquisitions to eliminate signal phase produced from sources other than velocity. Alternatively, the flow-encoding gradients may be strategically applied on more than one axis simultaneously, to improve the SNR of the subtracted images (13,14). These alternative methods still require the acquisition of four scans to acquire velocity information in all three cartesian directions. With all of the phase contrast acquisition methods,
the subtraction provides high contrast between vessels and stationary tissues, permitting large fields-of-view to be imaged without detrimental effects from saturation, as long as a relatively small tip angle (20 to 30 degrees) is used.
the subtraction provides high contrast between vessels and stationary tissues, permitting large fields-of-view to be imaged without detrimental effects from saturation, as long as a relatively small tip angle (20 to 30 degrees) is used.
The scan time for encoding flow in all three cartesian directions using 2D acquisitions is 4 × TR × NSA × #PE, where TR is the repetition time of the imaging sequence, NSA is the number of signal averages (sometimes referred to as the number of excitations, NEX), and #PE is the number of phase-encoding values acquired. If flow is encoded in only a single direction, the factor of four is reduced to a factor of two. With 2D acquisitions, a single thick slab is typically imaged. If multiple slabs are imaged, the scan time is determined by multiplying the above equation by the number of slabs. The scan time for encoding flow in all directions using 3D acquisitions is 4 × TR × NSA × #PE × #SE, where #SE is the number of slice-encoding values acquired and all other abbreviations are as described previously. If
flow is encoded in only a single direction, the factor of four is again reduced to a factor of two.
flow is encoded in only a single direction, the factor of four is again reduced to a factor of two.
The use of the flow-encoding gradients in phase contrast sequences makes these methods particularly susceptible to signal loss caused by intravoxel dephasing. There are two reasons for this. First, the flow-encoding gradients force an increase in the minimum achievable echo time, which means that there is more time for intravoxel dephasing to occur (from all sources, including susceptibility). Second, the purpose of the flow-encoding gradients is to impart phase to magnetization from moving blood, but this is detrimental when blood at different locations within a voxel is moving at different velocities. In this case, magnetization from blood that is moving at different velocities accumulates different amounts of phase, which leads to intravoxel dephasing (which is exacerbated by the long TE).
The slice-selection and frequency-encoding gradients also cause intravoxel dephasing when blood at different locations within a voxel is moving at different velocities during application of these imaging gradients. Flow compensation methods (15,16), also known as gradient moment nulling methods, may be employed to reduce intravoxel dephasing caused by the imaging gradients.
Flow compensation methods are designed to eliminate the phase induced by the slice-selection and/or frequency-encoding gradients in the magnetization of all blood that moves at a constant velocity, independent of its velocity. When the phase of the magnetization from all blood (moving at a constant velocity) is nulled, intravoxel dephasing from this source is eliminated. However, the phase induced by the flow-encoding gradients is a necessary part of phase contrast MRA methods, so these phases are intentionally not nulled by the flow compensation methods. As a result, phase contrast MRA methods remain susceptible to signal loss caused by intravoxel dephasing when blood moving at a range of velocities is present in the same voxel. Accelerating blood also causes intravoxel dephasing, so phase contrast methods often exhibit signal loss where blood flows around a corner (centripetal acceleration) or in regions where pathology generates complex flow patterns.
The features of two- and three-dimensional phase contrast MRA methods are summarized in Tables 2-2 and 2-3, respectively, and the benefits and limitations of the two techniques are summarized in Tables 2-4 and 2-5.
Time-of-Flight Magnetic Resonance Imaging
Time-of-flight MRA techniques (17,18) differ from phase contrast techniques in that the former do not employ subtraction, so some signal from stationary tissues remains in the angiograms. In addition, time-of-flight techniques do not provide quantitative information regarding velocity or volume flow rate; thus, these methods are used primarily for assessing vascular anatomy.
Table 2-2 Summary of Two-dimensional Phase Contrast Magnetic Resonance Angiography | |
|---|---|
|
Time-of-flight techniques derive contrast between flowing blood and stationary tissues by manipulating the magnitude of the magnetization, such that it is large for moving blood and small for stationary tissues. This leads to a large signal from moving blood and a diminished signal from stationary tissues.
In MR, the signal from tissues decreases with exposure to an increasing number of radio frequency excitation pulses, until an equilibrium saturation value is reached. In time-of-flight imaging, the goal is to subject the flowing blood to at most a very few excitation pulses, and to subject stationary tissues to a large number of excitation pulses, thereby achieving a signal difference between blood and stationary tissues (Fig. 2-11).
This can be accomplished by imaging slices, or thin slabs, oriented perpendicular to the primary direction of flow. When this is done, the moving blood enters the slice fully magnetized, experiences only a few excitation pulses, and then flows out of the slice before it becomes saturated. This ensures that the signal from blood will be relatively large. The stationary tissues, however, remain in the slice, or slab, throughout image acquisition, so they give rise to a diminished signal because the magnetization from them is saturated due to the constant exposure to the excitation pulses.
Table 2-3 Summary of Three-Dimensional Phase Contrast Magnetic Resonance Angiography | |
|---|---|
|
The number of excitation pulses experienced by moving blood as it traverses the imaging slice depends on a number of factors including the thickness of the slice, the velocity of the blood, the orientation of the vessel relative to the image slice, and the TR of the imaging sequence. In general, thinner slices, faster-flowing blood, vessels oriented perpendicular to the slice, and a longer TR lead to increased vascular signal. A longer TR, however, also leads to increased signal from stationary tissues. Therefore, an intermediate TR must be selected with time-of-flight MRA.
Increasing the tip angle leads to diminished signal from stationary tissues but can also lead to increased saturation of blood that experiences multiple excitation pulses. As a result, an intermediate tip angle also must be selected. These factors and others must be carefully considered when constructing a time-of-flight protocol. Some important parameters and their effect on the signal from blood and stationary tissues are summarized in Table 2-6.
Stay updated, free articles. Join our Telegram channel

Full access? Get Clinical Tree


