Conventional Angiography in the Noninvasive Era
Daniel Y. Sze
Within a few months of Roentgen’s publication describing the discovery of x-rays, Haschek and Lindenthal published the first angiogram of an amputated hand (1). While Lord Kelvin was still denouncing x-rays as a “hoax,” others already recognized the potential for medical applications of this new phenomenon and the utility of filling hollow structures with a radio-opaque substance to aid in image-based diagnosis. The first seven decades of medical imaging were devoted primarily to the diagnosis of disease.
In 1964, Dotter conceived of angioplasty using sequential introduction of plastic dilators, and the field of angiography and interventional radiology veered away from diagnosis and toward therapy. The previous year, he had predicted that “[the angiographic catheter can be more than a tool for passive means for diagnostic observation; used with imagination, it can become an important surgical instrument” (2). This trend was fueled further by the introduction of less invasive diagnostic technologies including ultrasound, computed tomography (CT), and magnetic resonance (MR) imaging. Cross-sectional and volumetric imaging has replaced nearly all of the diagnostic roles previously occupied by angiography. Dotter’s prophecy has become completely realized; the tools and techniques of catheter-based therapy have developed into a field that stands as its own “component” in the American College of Radiology (3). Despite this change in function, catheter angiography continues to play a crucial role in vascular medicine.
The current practice of interventional radiology, although highly dependent on miniaturized devices and new pharmacological agents, relies on the generation of anatomical images to pursue its mission of maximum therapeutic yield with minimum risk. To generate these images, tools and techniques currently or formerly used solely for diagnosis were adopted and customized. Aside from facilitating interventions, these customized imaging methods can also provide a few subtle but clinically crucial advantages over noninvasive methods of imaging.
Techniques
Generation of Images
Early observations that x-ray bombardment of certain substances could cause luminescence, or emission of photons of a wavelength in the visible range, allowed real-time x-ray examination of patients. Unfortunately, the hazards of radiation were not well understood, and many red-spectacled physicians succumbed to the adverse effects of radiation overexposure. Modern fluoroscopy has evolved into a method that reduces physician exposure to acceptable levels yet greatly increases the diagnostic power of the generated images. Standards of practice, including standards of equipment, have been published and are updated periodically (4).
Few modern angiography facilities have retained the capability of producing analog hard-copy photographic film angiograms, sometimes referred to as cut film. Film size ranged from 105-mm cinematic roll film, through 14″ square rapid sequence film used with a “Puck” film changer, to 51″ “long leg” film capable of capturing the entire lower extremities without demagnification. Obtaining subtraction
films from these hard-copy films required considerable expertise in a time-consuming process of making a negative of the mask image and reprinting selected images by physically stacking the images onto the negative mask and printing a summating negative. Since the 1970s, digitized images have progressively replaced analog images, and digital subtraction can be performed instantaneously. Even the last bastions of cut-film angiography in mesenteric and pulmonary angiography are yielding to the modernization of digital subtraction angiography (DSA).
films from these hard-copy films required considerable expertise in a time-consuming process of making a negative of the mask image and reprinting selected images by physically stacking the images onto the negative mask and printing a summating negative. Since the 1970s, digitized images have progressively replaced analog images, and digital subtraction can be performed instantaneously. Even the last bastions of cut-film angiography in mesenteric and pulmonary angiography are yielding to the modernization of digital subtraction angiography (DSA).
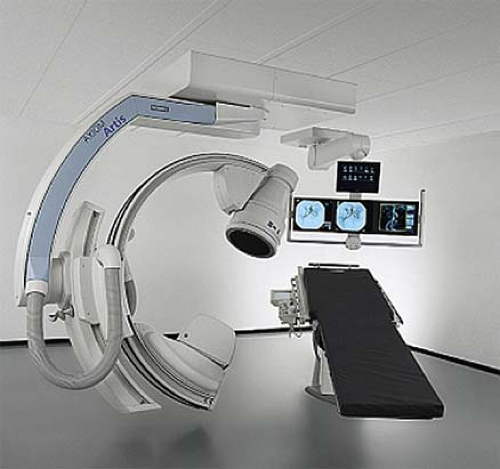 Figure 3-1 A fluoroscopic unit is shown. Imaging hardware is commercially available in numerous different designs and configurations, including C-arms, U-arms, floor-mounted, ceiling-mounted, biplanar, and the like. This unit is a ceiling-mounted C-arm using an image intensifier. (Courtesy Siemens Medical Solutions USA, Inc., Malvern, PA) |
The generation of a DSA image starts with generation of x-rays by a tube that usually sits beneath the patient (5) (Fig. 3-1). The thinly collimated x-rays pass upward through the radiolucent table and the patient, and transmitted photons are captured by the detector situated above the patient, coupled to the tube by a C- or U-shaped arm. In the 1950s, fluorescent detectors were replaced by the image intensifier (II). These “cans” contain a vacuum tube photon detector that converts x-ray photons to optical photons. The weak luminescence is converted to photoelectrons, which are then electronically accelerated and focused onto another phosphorescent screen that converts the photoelectrons back to optical photons. These amplified optical photons are then photographed by a video camera and projected in real time onto a high-definition (>1 kilopixel ÷ >1 kilopixel) monitor (6). The newest detectors are flat panel, square or rectangular, and use amorphous silicon to detect photons and convert them directly to electrical signals. Flat-panel detectors offer the advantages of lower profile than IIs, approximately 30% reduction in radiation due to greater efficiency and much less geometric distortion (Fig. 3-2).
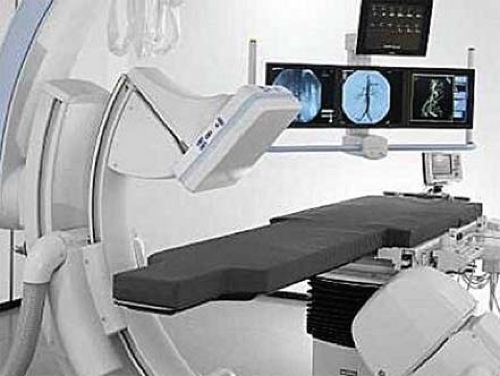 Figure 3-2 This figure shows a flat-panel detector. In the newest fluoroscopic units, the image intensifier is replaced with a square or rectangular amorphous silicon flat-panel detector, decreasing the effective radiation dose and geometric distortion of the image, and lowering the profile of the instrument. (Courtesy Siemens Medical Solutions USA, Inc., Malvern, PA) |
Fluoroscopic images obtained in real time by stepping on a pedal may be archived on videotape or computer memory. Most frequently, though, the real time images are not archived, and only the runs, dedicated and prescribed cinematic sequences usually obtained during injection of contrast, are stored electronically. Acquisition parameters that need to be prescribed include the frame rate (up to 30 frames per second) and exposure time per frame, the kilovoltage, and the current or milliamperes. As is true of any other radiography technique, the greater the current (and therefore photons), the higher the signal-to-noise ratio, and the higher the kilovoltage (especially above the k-edges of the penetrated materials), the higher the penetrance.
Images obtained digitally can be displayed as native or subtracted and positive or negative (black bones, white air or white bones, black air). With digital subtraction, the intensity of each pixel in each frame is first converted into logarithmic form and then subtracted from a digital mask image, producing a difference image. If the patient is perfectly still and nothing is injected, the difference image is blank. By blanking out the background, digital subtraction angiography attains sensitivity much greater than in native images. Injected contrast can be seen as black on a blank white background, or vice versa (Fig. 3-3).
Subtraction techniques, though, are subject to a number of artifacts. Perhaps the most frequently encountered
is motion artifact. Motion of a uniform background does not cause artifacts, but the background of the human body is decidedly nonuniform. Any anatomical structures that are fluoroscopically discernable, including bones, bowel gas, lungs, surgical clips, and the like will move as a result of patient respiration, cardiac pulsation, and peristalsis, causing artifacts that can obscure the region of interest. These artifacts can be minimized by apnea (voluntary or otherwise), pharmacological intervention (sedatives, glucagon), and physical restraints. Smaller artifacts can usually be eliminated by optimal choice of which frame to use as a mask, and by reregistration of the mask frame and image frame in a process referred to as pixel shifting (Fig. 3-4).
is motion artifact. Motion of a uniform background does not cause artifacts, but the background of the human body is decidedly nonuniform. Any anatomical structures that are fluoroscopically discernable, including bones, bowel gas, lungs, surgical clips, and the like will move as a result of patient respiration, cardiac pulsation, and peristalsis, causing artifacts that can obscure the region of interest. These artifacts can be minimized by apnea (voluntary or otherwise), pharmacological intervention (sedatives, glucagon), and physical restraints. Smaller artifacts can usually be eliminated by optimal choice of which frame to use as a mask, and by reregistration of the mask frame and image frame in a process referred to as pixel shifting (Fig. 3-4).
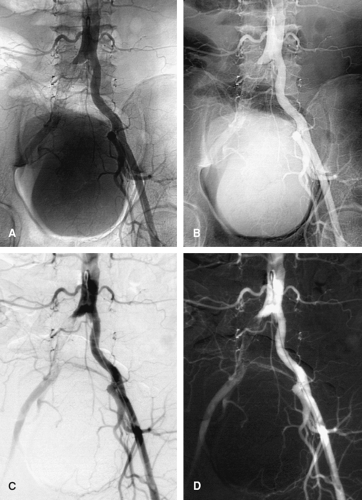 Figure 3-3 Shown is a digitally acquired catheter angiogram. The same image can be displayed (A) native (unsubtracted), (B) inverted native, (C) digitally subtracted, or (D) subtracted and inverted. Signal-to-noise and contrast-to-noise ratios, and thus diagnostic power, can be greatly enhanced by digital subtraction. |
Newer angiography units also feature the capability of rotational angiography. In these systems, continuous acquisition is performed while the C-arm rotates and contrast is injected. Preliminary images obtained without contrast allow digital subtraction to be performed. The final product shows the angiogram from a multitude of oblique angles, which when displayed as a loop allows the angiographer to form a three-dimensional (3D) image mentally.
Angiographic Methods
Modern angiography blossomed with the introduction of the Seldinger method of catheter exchange and the introduction of preshaped wires and catheters. Prior to the 1950s, angiography of a vessel required direct puncture of
that vessel with a needle to inject contrast and obtain images. Building on the techniques of percutaneous access to a vessel and the Forssman technique pioneered in the 1920s of accessing distant structures using a catheter threaded through a vessel, Seldinger published the technique of removing the needle over a guide wire and replacing it with a catheter (1). With rare exception, all modern angiography is performed using the Seldinger technique.
that vessel with a needle to inject contrast and obtain images. Building on the techniques of percutaneous access to a vessel and the Forssman technique pioneered in the 1920s of accessing distant structures using a catheter threaded through a vessel, Seldinger published the technique of removing the needle over a guide wire and replacing it with a catheter (1). With rare exception, all modern angiography is performed using the Seldinger technique.
 Figure 3-4 Optimization of digital subtraction is presented here. A: Digitally acquired catheter angiogram using the default mask for subtraction. B: Selection of optimal mask image. C: Reregistration of the mask and selected images yields a more diagnostic image. D: Multiple frames can be stacked to obtain a maximum opacity image, which can be useful for short or fragmented contrast boluses or for displaying arterial and venous information simultaneously. |
Access to a vessel, arterial or venous, is usually performed with a needle ranging from 18 to 22 gauge (G). Although digital palpation of a pulse combined with knowledge of normal anatomy is usually sufficient to achieve safe access to a vessel, transcutaneous ultrasound can enable success in difficult situations (no palpable pulse, branched or tortuous vessels) and also makes routine access safer. Inadvertent carotid puncture during internal jugular vein access, for instance, has been reported to be as common as 5% to 14% without the use of ultrasound but is now virtually 0% in the hands of the skilled ultrasonographer (7). Other complications, such as pneumothorax and branch vessel injury, can also be minimized using ultrasound guidance. In patients in whom the use of an arterial closure device is anticipated, ultrasound can also optimize access location, avoiding sidewall punctures and punctures near or through bifurcations. Larger needles can accommodate larger wires, so use of an 18G or thin-walled 19G needle may save time by allowing immediate introduction of a 0.035″-diameter wire, but many practitioners now prefer the relative safety of using a smaller needle (21 or 22G) that only accommodates an 0.018″ wire. With lower-profile access, a micropuncture coaxial dilator must be used to increase the size of the access to accommodate the standard 0.035″ wire.
Devices
The default size for diagnostic catheterization is now 5 French (F) (1.67 mm outer diameter), but some practitioners are starting to favor 4F. For patients in whom multiple catheter exchanges are anticipated, a side-arm sheath is usually placed to minimize trauma to the vessel. Sheaths are sized according to inner diameter, so a 5F sheath allows passage of 5 French catheters, but actually measures about 6 to 7F (2.0 to 2.3 mm) on its outer diameter. Catheters are commercially available as thin as about 1.8F (0.6 mm), and the largest devices (used for stent-graft treatment of the thoracic aorta) require a 24F sheath with an outer diameter of 9.5 mm. Diagnostic catheters are available in a large variety of shapes, diameters, and lengths (Fig. 3-5). Most catheters incorporate a radio-opaque substance within the polymer to render them visible on fluoroscopy. In addition, differences in design engineering and manufacturing using materials such as polyethylene (PE), polytetrafluoroethylene (PTFE, Teflon), polyamides (e.g., nylon), and aramids (e.g., Kevlar) result in subtle differences in “pushability” or resistance to longitudinal stretching and shortening, “trackability” or conformability to a tortuous course, pliability, torquability, pressure capacity, and surface friction. Similarly, guide wires are available in a large array of designs, varying in diameter, length, stiffness, tip shape and length, torquability, steerability, surface friction, and kink resistance (Fig. 3-6). Different materials including nitinol, stainless steel, and platinum are used in the cores to take advantage of their characteristics such as kink resistance, stiffness, and radio-opacity. Superficially, guide wires may be coated with PTFE or wettable hydrophilic coatings.
Risks and Complications
Some of the reasons for diagnostic catheter angiography being replaced by less invasive methods are (a) greater risk for complications of catheterization and (b) convenience to the patient. For purely diagnostic catheterization procedures, the rate of complications is not alarming, and published guidelines list acceptable rates (8,9,10) (Table 3-1). The rates of complications increase when therapeutic procedures are performed, due to the larger device profiles, longer duration and greater complexity of manipulation, greater selectivity of catheterization, and the fact that only patients with significant disease require intervention.
Some of the risks of catheter angiography are shared by CT angiography, including exposure to contrast medium and to radiation. The typical diagnostic catheter angiogram uses approximately 100 to 150 mL of contrast medium, no different from CT angiography, so the risks of contrast medium reactions and/or nephrotoxicity are not substantially different. However, in catheter angiography, the contrast is administered in smaller aliquoted boluses, so localized tissue infiltration and necrosis are virtually absent. However, the contrast medium may be injected at rates as high as 25 mL per second and pressure as high as 1700 psi (pounds per square inch, approximately 11.7 kPa) through a multisidehole nonselective catheter, and approximately half of these parameters through a single endhole selective catheter, so injury to arteries and other vessels is possible. These injuries can include arterial dissection, small vessel rupture, and aneurysmal rupture. These complications should be immediately recognized and rectified by the practitioner. Other risks unique to catheterization include distal embolization of targeted organs or of the accessed extremity, subintimal passage of wires and/or catheters, and access site complications including hematoma, thrombosis, arteriovenous fistula, and pseudoaneurysm.
Radiation dose is highly variable in both conventional and CT angiography, depending on the imaging protocols and body parts imaged. The high frame rates used in
catheter pulmonary angiography result in high radiation dosage of 3.3 to 17.3 (mean 7.1) mSv, substantially higher than that expected with CT angiography of 2.2 to 6.0 (mean 4.2) mSv (14). However, radiation dose reduction remains a challenge in coronary CT angiography, as described in other chapters. For peripheral vessels, measured cumulative dose of a CT angiogram of the abdomen, pelvis, and lower extremities has been reported to be as high as 15 to 20 or as low as 1.6 to 3.9 (mean 2.7) mSv, compared to a dose of 6.4 to 16.0 (mean 11) for catheter angiography (13).
catheter pulmonary angiography result in high radiation dosage of 3.3 to 17.3 (mean 7.1) mSv, substantially higher than that expected with CT angiography of 2.2 to 6.0 (mean 4.2) mSv (14). However, radiation dose reduction remains a challenge in coronary CT angiography, as described in other chapters. For peripheral vessels, measured cumulative dose of a CT angiogram of the abdomen, pelvis, and lower extremities has been reported to be as high as 15 to 20 or as low as 1.6 to 3.9 (mean 2.7) mSv, compared to a dose of 6.4 to 16.0 (mean 11) for catheter angiography (13).
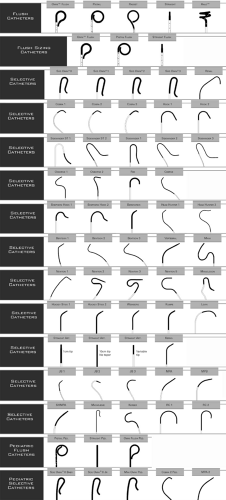 Figure 3-5 The standard diagnostic catheter shapes offered by a market-leading company are shown. In addition to differences in shape, catheters are available in different diameters, lengths, and materials. In addition, catheters can be custom shaped commercially or by individual practitioners at the time of angiography. (Courtesy AngioDynamics, Inc., Queensbury, NY) |
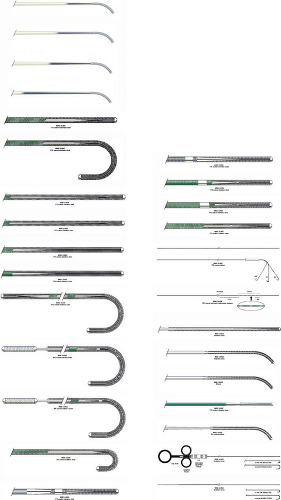 Figure 3-6 Standard guide wires (also known as wire guides) are used for peripheral angiography and intervention. The commercial offerings of one market-leading company are listed. These wires range in diameter from 0.014” to 0.038” and are available in various lengths from 50 to 300 cm. They differ from each other in core stiffness, steerability, torquability, tip shape and length, kink resistance, and surface treatment. From top to bottom, in order of appearance: Roadrunner Nimble, Nimble Floppy, The Firm, The Firm LT, Straight Fixed Core Wire Guides, Safe-T-J Curved Fixed Core Wire Guides, Newton Cerebral Wire Guides (LT), Newton Cerebral Wire Guides (LLT), Bentson Cerebral Wire Guides, Bentson Plus Cerebral Wire Guides, Double Flexible Tipped Wire Guides, Amplatz Tapered Movable Core Wire Guides, Tapered Tefcor Movable Core Wire Guides, Rosen Curved Wire Guides, Lunderquist Extra Stiff Wire Guides, Amplatz Ultra Stiff Wire Guides, Amplatz Extra Stiff Wire Guides, Amplatz Stiff Wire Guides, Coon Interventional Wire Guides, Lunderquist-Ring Torque Wire Guides, McNamara Renal Exchange Wire Guides, Graduate Measuring Wire Guides, Torq-Flex Wire Guides—Australian Modification, Cope Mandril Wire Guides, Shorty Wire Guides—TFE Coated, Roadrunner Extra-Support Wire Guides, Disposable Reuter Tip Deflecting Wire Guides, and Reuter Tip Deflecting Wire Guides (Courtesy Cook Inc., Bloomington, IN) |
Table 3.1 Indicators and Thresholds for Complications in Diagnostic Arteriography | |||||||||||||||||||||||||||||||||
|---|---|---|---|---|---|---|---|---|---|---|---|---|---|---|---|---|---|---|---|---|---|---|---|---|---|---|---|---|---|---|---|---|---|
|
As for convenience to the patient, a diagnostic catheter angiogram is usually completed in less than an hour. However, in preparation for the procedure, most patients undergo laboratory blood tests and receive intravenous sedatives. This means that they need to fast for at least 6 hours before the procedure and may have to pay a preliminary visit or else wait several hours for laboratory test results to be available. After a venous catheterization, only an hour or two of supine recovery is necessary for a common femoral venous access, and even less for internal jugular or brachial. However, after arterial catheterization, most practitioners still recommend a 6-hour recovery with the patient supine and immobile, universally considered by patients to be the worst part of any procedure. With the availability of arterial closure devices, the recovery can be substantially shortened to an hour or so, but these devices carry their own risks for complications, including hemorrhage and hematoma, pseudoaneurysm, stenosis or occlusion, device embolization, and infection (15).
Utilization
Cross-sectional Imaging as a Preferred Diagnostic Tool
Although complications and convenience are important, the most compelling reason for less invasive cross-sectional imaging to have replaced catheter angiography for diagnostic procedures is the greater diagnostic power (Table 3-2). The specific features of cross-sectional imaging that result in this diagnostic power include 3D rather than projectional imaging of the vessel lumen, better characterization of vessel wall morphology, greater diagnostic characterization of nonvascular structures and tissues, and greater sensitivity to contrast enhancement.
Conventional catheter angiography yields only projectional images with little 3D information. For instance, when assessing vessel lumen diameter in a stenosis, a radially asymmetric lesion could result in gross inaccuracy (Fig. 3-7). Flow dynamics, as described by Poiseuille’s law, are a function of
the vessel diameter to the fourth power. The traditional guidelines grading severity of stenoses assume that the cross section of the vessel is consistently circular. Deviations from radial symmetry can greatly increase turbulence. Even when catheter angiography is performed with multiple oblique projections, the irregular irregularity of typical atherosclerotic disease and its effect on hemodynamics is probably underestimated.
the vessel diameter to the fourth power. The traditional guidelines grading severity of stenoses assume that the cross section of the vessel is consistently circular. Deviations from radial symmetry can greatly increase turbulence. Even when catheter angiography is performed with multiple oblique projections, the irregular irregularity of typical atherosclerotic disease and its effect on hemodynamics is probably underestimated.
Table 3.2 Major Advantages of Cross-sectional Versus Catheter Angiography | |
|---|---|
|
 Figure 3-7 Asymmetric vessel lumen. A: A lateral true-lumen aortogram in a patient with an aortic dissection shows contrast filling both main renal arteries, the celiac axis, and the superior mesenteric artery (SMA). A mild stenosis of the SMA is seen approximately 2 cm distal to its origin (arrow). The diameter of the first 2 cm appears normal, but the contrast column appears attenuated, suggesting effacement of the vessel. CT angiogram (B) and intravascular ultrasound (IVUS) (C) at the level of the SMA origin shows the aortic dissection flap extending into the SMA. The craniocaudal dimension of the vessel is essentially normal, but the transverse diameter is reduced by about 50%. The false lumen of the SMA is a blind sac without a re-entry tear, containing some thrombus. |
Another advantage of 3D imaging over projectional imaging is the ability to elongate tortuosity and to untangle overlapping vessels. Redundant, tortuous vessels with focal abnormalities are difficult to image by any modality, but acquiring a 3D data set essentially performs an infinite number of oblique projections simultaneously. Finding the optimal projection to portray an aneurysmal neck, for instance, frequently requires multiple iterative runs during catheter angiography, whereas all of these data are intrinsic to the data set produced by one series of CT or MR angiography (Figs. 3-8, 3-9 and 3-10).
 Figure 3-8 A three-dimensional depiction of the neck of an aneurysm arising from tortuous vessels. Treatment options for a symptomatic right common iliac artery saccular aneurysm included embolization and stent-graft exclusion. An axial image (A) and an oblique volume rendering (B) from a CT angiogram revealed a wide neck with adequate length landing areas proximal and distal, and a total aneurysmal diameter of 4.4 cm, including mural thrombus (arrows). Anteroposterior catheter angiogram (C) using a marker (measuring) catheter confirmed location of aortic and iliac bifurcations and marked tortuosity. However, the neck of the aneurysm is not well depicted, and the total size of the aneurysm is severely underestimated by this lumenogram. Repeat catheter angiogram (D) and follow-up CT angiogram (E) after stent-graft exclusion. |
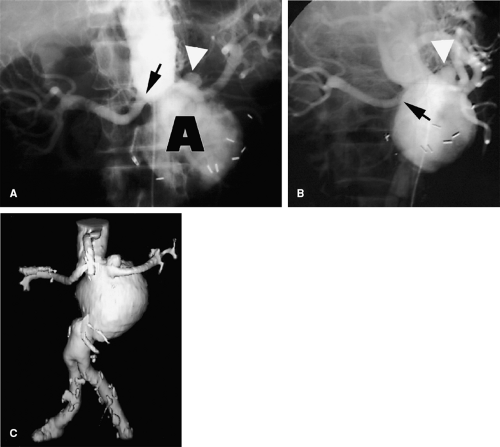 Figure 3-9 Overlapping branch arteries over an aortic aneurysm. A: Unsubtracted screen-film anteroposterior catheter angiogram demonstrates an abdominal aortic aneurysm. While unsubtracted screen-film techniques are now obsolete, the challenge of differentiating overlapping structures on projectional images is effectively illustrated. The aneurysm neck projects below the left renal artery origin (black arrow), but the locations of the superior mesenteric and right renal arteries are poorly demonstrated. A small saccular aneurysm (white arrowhead
Get Clinical Tree app for offline access
Stay updated, free articles. Join our Telegram channel
Full access? Get Clinical Tree


|