Postprocessing and Data Analysis
Geoffrey D. Rubin
Pietro Sedati
Jesse L. Wei
Chapters 1 and 2 detail how computed tomographic (CT) and magnetic resonance (MR) angiograms are acquired and images generated. In the case of CT, projection data acquired by the rotating x-ray source and detectors is processed by Fourier transforms to generate transverse reconstructions. Similarly, in MR, the primarily acquired signal is reconstructed to planar images also using Fourier transforms. Although the data acquired during CT scanning are volumetric due to continuous acquisition during table translation, these data are exclusively reconstructed into a stack of transverse sections (1,2,3). Similarly, although “three-dimensional” (3D) sequences (where an entire volume of anatomy reconstructed is imaged simultaneously) are frequently used in MR angiography, these data are also reconstructed into a stack of planar reformations (4,5).
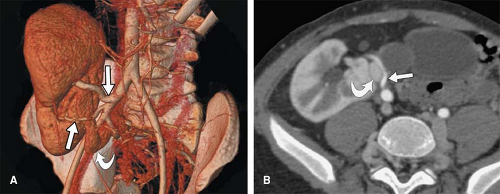
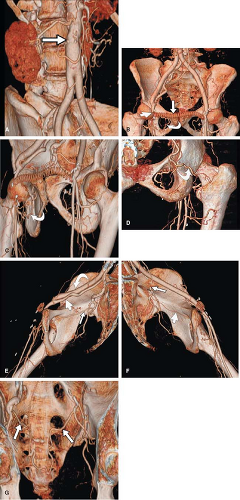
Although these primary reconstructions when stacked together represent the entire imaged volume, observers have a limited ability to mentally integrate and interpret the many images making up each volume. 3D visualization of volumetric CT and MR data using dedicated image-processing workstations allows different perspectives for visual examination and analysis of these primarily acquired and reconstructed data. Postprocessing of imaging volumes allows visualization of these data in a manner that is most analogous with what is represented in anatomic diagrams as well as what is seen on direct observation in the operating room or in the pathology suite (Fig. 6-1). However, the
rationale for reformatting and rendering volumetric data extends well beyond simulating direct visualization of anatomic structures. The advantages of postprocessing volumetric CT and MR data fall into four broad categories: alternative visualization, efficiency of interpretation, effective communication, and volumetric quantitation (2,3,4,5,6,7,8). Each of these rationales will be discussed in turn.
rationale for reformatting and rendering volumetric data extends well beyond simulating direct visualization of anatomic structures. The advantages of postprocessing volumetric CT and MR data fall into four broad categories: alternative visualization, efficiency of interpretation, effective communication, and volumetric quantitation (2,3,4,5,6,7,8). Each of these rationales will be discussed in turn.
Rationale for Image Postprocessing
Alternative Visualization
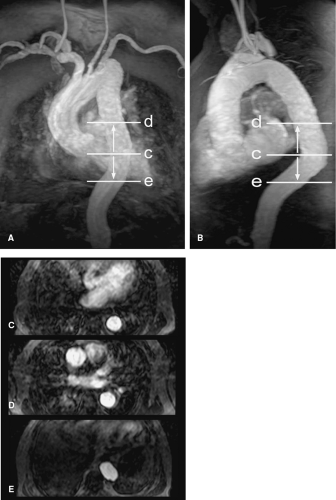
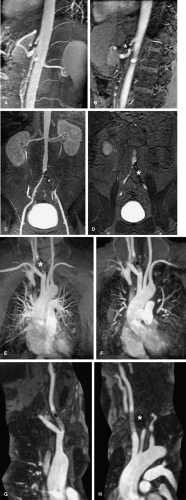
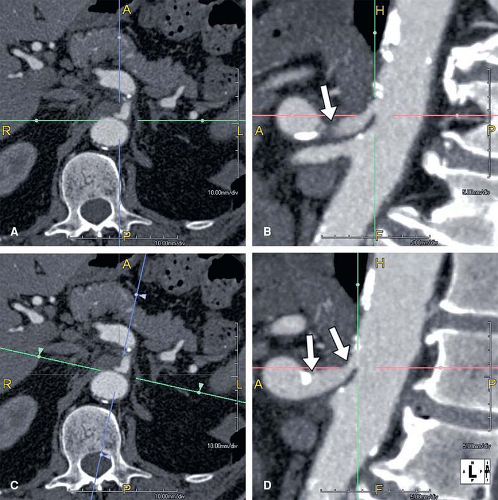
As mentioned in the preceding paragraph, volumetric rendering techniques of computed tomographic angiography (CTA) and magnetic resonance angiography (MRA) data can display anatomic structures in a manner similar to that experienced on direct visualization. Such techniques emphasize surface representations but have substantial limitations. Many vascular abnormalities are best assessed by using cross-sectional representations through the structures of interest. However, the routine primarily reconstructed cross-sectional images are usually arbitrarily oriented relative to these structures. For example, although the abdominal aorta courses in a cranial to caudal direction nearly parallel to the CT or MR scanner table, it is not truly parallel. Therefore a “transverse,” or “axial,” primary reconstruction would not be quite perpendicular to the longitudinal axis of the aorta, resulting in oblique cross sections of this structure. Moreover, because even the normal aorta subtly curves with the kyphosis of the thoracic spine and the lordosis of the lumbar spine, a planar reformation perpendicular to the axis of the aorta at one point when translated cranially and caudally may no longer be perpendicular to the curved centerline axis of the aorta (Fig. 6-2). Because the vascular system is a network of tubes oriented with complex and at times highly variable spatial relationships, and because diagnosis and characterization of vascular diseases necessitate an assessment of a vessel’s lumen, wall, and surrounding tissue, a diverse menu of visualization options have been developed to enable physicians to maximize their understanding of the imaged vasculature. The flexibility afforded by volumetric visualization techniques facilitates comparison of changes over time despite subtle shifts in a patient’s position between serial examinations. These techniques allow assessment of anatomy by using landmarks and axes that are intrinsically relevant to structures of interest rather than to the orientation of the imaging table (2,3,4,5,6,7,8) (Fig. 6-3).
Efficient Interpretation
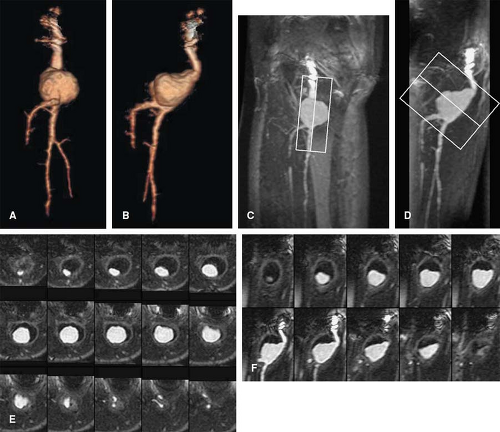
A single volumetric CT angiogram of the aorta through the lower extremity arterial system can consist of over 2,000 primary reconstructions (Fig. 6-4). Assuming that only 3 seconds are spent examining each image in a CT scan of 2,400 primary transverse reconstructions, an impractical 2 hours would be required for a physician to examine each volumetric data set (3,6,9,10).
A preferable paradigm to consider for the interpretation of such volumetric data arises from ultrasonography. A single sonographic image is a cross-sectional reconstruction similar to a primary planar reconstruction from CTA or MRA; however, the sonographer does not typically save
entire stacks of cross sections for interpretation while sweeping the transducer from top to bottom of the imaging volume. Rather, the sonographer watches the image display changing in real time as the transducer is swept over the surface of the patient. Based on knowledge of normal and abnormal anatomy, only relevant and representative images in standard planes are captured for further review and archive. Primary diagnosis is made based on direct real-time observation by the sonographer; the saved static images serve primarily to document clinically relevant information in familiar organ-specific planes.
entire stacks of cross sections for interpretation while sweeping the transducer from top to bottom of the imaging volume. Rather, the sonographer watches the image display changing in real time as the transducer is swept over the surface of the patient. Based on knowledge of normal and abnormal anatomy, only relevant and representative images in standard planes are captured for further review and archive. Primary diagnosis is made based on direct real-time observation by the sonographer; the saved static images serve primarily to document clinically relevant information in familiar organ-specific planes.
CTA and MRA data can be explored in an analogous fashion. If one considers the volumetric data as a virtual patient lying on a gurney in the ultrasound suite and conceptualizes the workstation as a virtual sonographic transducer, the interpreter of such examinations can rapidly scan through and interactively explore this volumetric data set both to perform primary interpretation and to record views that are clinically relevant. Using a spectrum of visualization tools in this fashion, the volumetric data can be examined more efficiently than a simple review of individual cross sections.
It should be noted, however, that primary interpretation using interactive volumetric visualization techniques cannot completely replace the routine examination of the primary reconstructions. The pitfalls of each visualization technique utilized should be considered when scanning through the primary reconstructions to assure that all abnormalities have been detected and that volumetric representations are truly representative of the anatomy. Moreover, although the primary goal of vascular imaging is to investigate vascular structures and the organs perfused or drained by those structures, it is incumbent on any interpreter of CTA or MRA data to examine the entirety of the volumetric data set, including structures that are not primarily relevant to the purpose of the examination so that important incidental nonvascular findings may be identified and reported (2,3,4,5,7,9,10,11).
Communication
Individual “screen shots” saved during real-time exploration of volumetric data provide a basis for communication to referring physicians of anatomic findings with complex spatial relationships. The adage that a picture is worth a thousand words is certainly applicable in the case of communicating imaging results (Fig. 6-4). Although a CT or MR angiogram may be composed of thousands of primary reconstructions, key findings can typically be represented in a handful of dedicated views (Fig. 6-5). The advantage of providing this focused output is that it allows the referring clinician to be most efficient in understanding the primary interpretation while reducing the need to wade through piles of film or virtual stacks of cross-sectional images on a computer monitor (3,12). In certain circumstances, the ability for the referring physician to then use those representative images to illustrate the severity and nature of disease to a patient has been shown to alter a patient’s treatment choices (e.g., to accept a therapeutic option or undergo lifestyle modifications) (13).
Volumetric Quantitation
The final major rationale for volumetric analysis is the ability to quantify the complex geometric relationships and features of the vasculature. Length, area, and volume measurements of vascular disease serve as objective metrics for evaluating disease severity as well as change over time. In an era where percutaneous delivery of stents, stent grafts, and
other therapeutic devices has significantly reduced the direct visualization and measurement afforded by an open procedure, vascular quantitation based on imaging has become a critical process both for triaging patients to appropriate therapeutic options as well as for determining the appropriate size and type of medical devices to be used when intervention is planned (14).
other therapeutic devices has significantly reduced the direct visualization and measurement afforded by an open procedure, vascular quantitation based on imaging has become a critical process both for triaging patients to appropriate therapeutic options as well as for determining the appropriate size and type of medical devices to be used when intervention is planned (14).
Visualization Techniques
Primary Planar Reconstructions
While many sophisticated visualization techniques critical to interpretation of cardiovascular imaging are the focus of this chapter, the importance of review of primary planar reconstructions both with CTA and MRA cannot be understated.
The “source data” provide the highest spatial resolution and the lowest likelihood of motion-related misregistration and off-axis artifacts.
The “source data” provide the highest spatial resolution and the lowest likelihood of motion-related misregistration and off-axis artifacts.
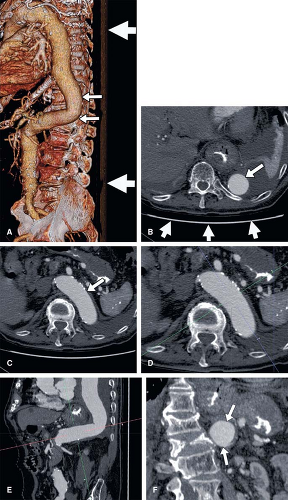
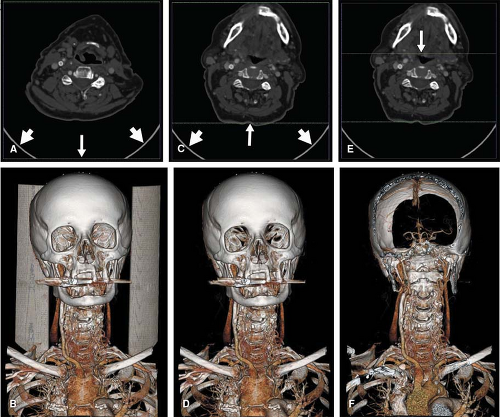
Artifacts related to beam hardening in CT and magnetic susceptibility in MR are easiest to recognize on the primary image reconstructions. These effects frequently result from metallic clips and prostheses and can cause vascular pseudo-lesions due to localized loss of detail in affected regions. A similar effect can occur where the high concentration of intravenous contrast medium along the course of venous access results in x-ray beam hardening or magnetic susceptibility. While 3D volume-rendered images may deceivingly suggest stenosis or occlusion due to susceptibility, review of the primary reconstructions show affected regions as signal voids that cross normal anatomic boundaries (Fig. 6-6).
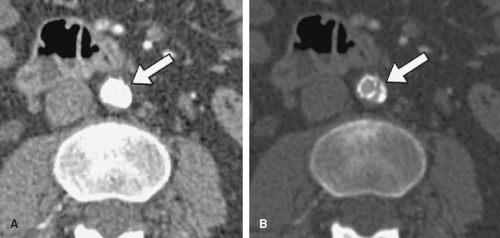
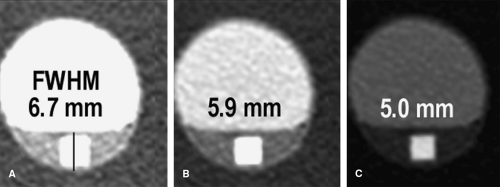
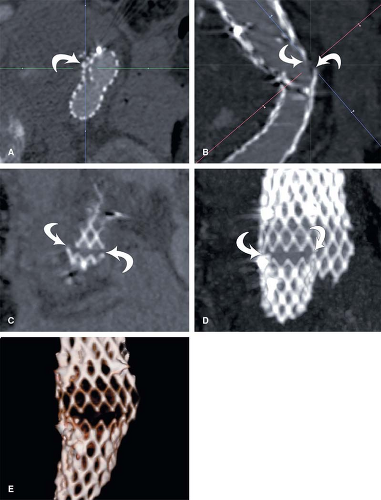
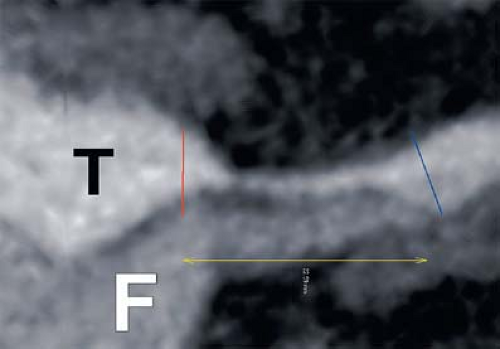
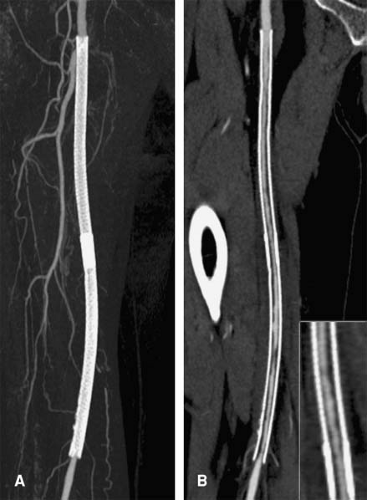
A critical consideration in the visualization process lies in the setting of the grayscale window and level for image review. When performing cardiovascular imaging, the vessel lumen should never be rendered with the highest gray values (white). If the lumen is rendered at these highest gray values, then the grayscale is truncated, which can misrepresent vessel dimensions. This consideration is particularly critical for visualization of arterial wall calcifications or metallic stents and stent grafts in CTAs—truncation may render mural calcifications and metal indistinguishable from the lumen (Fig. 6-7). In fact, in the presence of mural calcification in an image, the window and level should be adjusted so that the calcification is not truncated. If the calcium is allowed to be represented as white, its dimensions may be overrepresented and arterial lumina
adjacent to calcifications underrepresented, suggesting higher grades of stenosis than are actually present (Fig. 6-8). Similarly, when the lumina of metallic stents or stent-grafts need to be assessed, a window and level should be selected to avoid rendering the metallic components of the stents or stent grafts as bright white (Fig. 6-9). These principles for selecting grayscale window and level are equally applicable and clinically important when assessing multiplanar reformations and maximum intensity projections (5,7,10).
adjacent to calcifications underrepresented, suggesting higher grades of stenosis than are actually present (Fig. 6-8). Similarly, when the lumina of metallic stents or stent-grafts need to be assessed, a window and level should be selected to avoid rendering the metallic components of the stents or stent grafts as bright white (Fig. 6-9). These principles for selecting grayscale window and level are equally applicable and clinically important when assessing multiplanar reformations and maximum intensity projections (5,7,10).
Multiplanar Reformations
Multiplanar reformations (MPR) refer to planar cross sections that are oriented through planes other than those of the primary reconstructions. If the primary reconstruction is transverse, then simple sagittal or coronal MPRs orthogonal to these transverse images may be created; however, just as primary transverse reconstructions that are perpendicular to the MR or CT table are generally oriented arbitrarily to human anatomic structures, coronal and sagittal MPRs suffer from the same limitation. MPRs become most valuable when obliqued
parallel or perpendicular to the primary axes of a structure to be examined (Fig. 6-10), again in a manner analogous to the cross-sectional images or drawings typically shown in anatomic diagrams. Because blood vessels have a curved course, MPRs are rarely the best means of summarizing vascular anatomy. Nonetheless, MPRs can be useful for examining the cross-sectional characteristics of short segments of targeted vasculature, particularly in the vessel wall (5,7,10) (Fig. 6-11).
parallel or perpendicular to the primary axes of a structure to be examined (Fig. 6-10), again in a manner analogous to the cross-sectional images or drawings typically shown in anatomic diagrams. Because blood vessels have a curved course, MPRs are rarely the best means of summarizing vascular anatomy. Nonetheless, MPRs can be useful for examining the cross-sectional characteristics of short segments of targeted vasculature, particularly in the vessel wall (5,7,10) (Fig. 6-11).
An important limitation of evaluating planar CT or MR images (whether primary reconstructions or MPRs)
occurs because most structures are only partially represented within a single image. When examining blood vessels, planar images must be evaluated in a stacked cine mode rather than in a tiled presentation as would traditionally be represented on photographic film. In this manner, cine paging is performed on a workstation to progressively scroll through a stack of planar images. By dynamically paging through the stack, the interpreting clinician can develop a much better understanding of the spatial relationships of imaged structures than when the stack of images are spatially dissociated by the tiled format (5,7,10).
occurs because most structures are only partially represented within a single image. When examining blood vessels, planar images must be evaluated in a stacked cine mode rather than in a tiled presentation as would traditionally be represented on photographic film. In this manner, cine paging is performed on a workstation to progressively scroll through a stack of planar images. By dynamically paging through the stack, the interpreting clinician can develop a much better understanding of the spatial relationships of imaged structures than when the stack of images are spatially dissociated by the tiled format (5,7,10).
Curved Planar Reformations
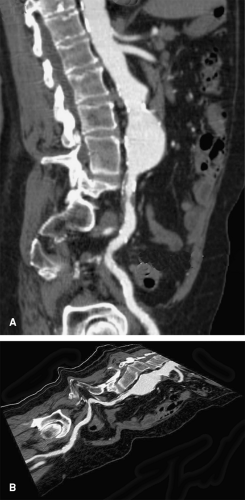
Unlike MPRs, where planes are created via the propagation of a straight line through the imaging volume, curved planar reformations (CPR) are created via the propagation of a curved line through the imaging volume. The curved line typically represents a trace through the centerline of a
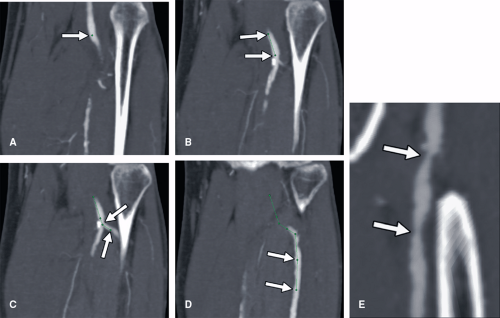
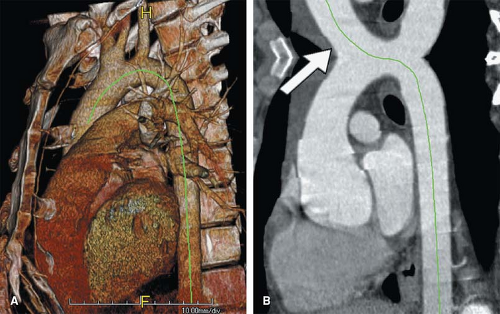
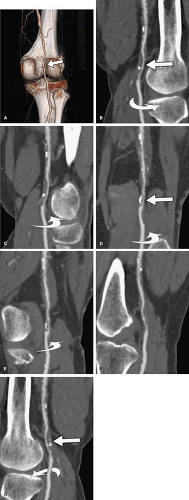
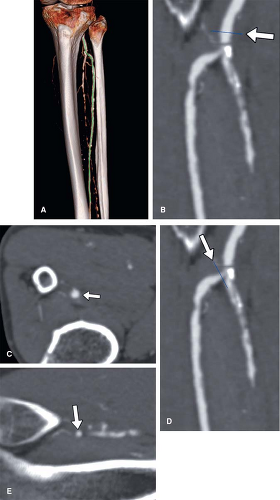
blood vessel or other curvilinear structures such as the pancreatic duct or biliary tree, which is then extruded through the volume. Intuitive representations of curved planar reformations, illustrated in Figure 6-12, have been euphemistically referred to as “magic-carpet views,” but are not standard in clinical practice. Instead, CPRs are represented on a flat plane as if the folds of the magic carpet have been laid out on a flat surface. This powerful form of display provides the best overview for evaluating wall irregularities along the longitudinal course of blood vessels (Fig. 6-13). It can also be very useful for evaluating the relationship of filling defects such as thrombi or intimal flaps to the vessel wall and the origins of vessel branches (Fig. 6-14). CPRs in CTA are particularly useful for assessing the luminae of arteries with high attenuation material in or along the arterial wall, such as calcifications or metal stents (Fig. 6-15). One might wonder why CPRs are not more widely used in the assessment of vascular structures, given these capabilities (5,7,10,15).
blood vessel or other curvilinear structures such as the pancreatic duct or biliary tree, which is then extruded through the volume. Intuitive representations of curved planar reformations, illustrated in Figure 6-12, have been euphemistically referred to as “magic-carpet views,” but are not standard in clinical practice. Instead, CPRs are represented on a flat plane as if the folds of the magic carpet have been laid out on a flat surface. This powerful form of display provides the best overview for evaluating wall irregularities along the longitudinal course of blood vessels (Fig. 6-13). It can also be very useful for evaluating the relationship of filling defects such as thrombi or intimal flaps to the vessel wall and the origins of vessel branches (Fig. 6-14). CPRs in CTA are particularly useful for assessing the luminae of arteries with high attenuation material in or along the arterial wall, such as calcifications or metal stents (Fig. 6-15). One might wonder why CPRs are not more widely used in the assessment of vascular structures, given these capabilities (5,7,10,15).
While CPRs are routinely utilized at the Stanford University 3D Laboratory, many practices eschew this technique for several reasons. Until recently, curved planar
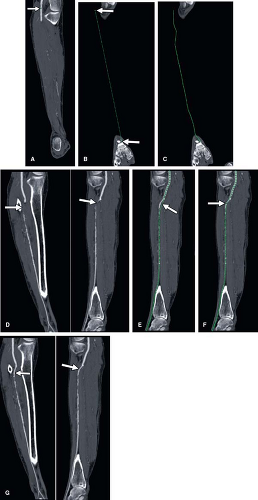
reformations could only be achieved through manual tracing of a vessel centerline (Fig. 6-16). This labor-intensive process is both time consuming and operator dependent, with potential for substantial variability in the quality of the CPR. Over the past several years, software algorithms to automatically extract the median centerline of blood vessels have resulted in the introduction of automated techniques for creating CPRs (Fig. 6-17). Such automation eliminates both the time-consuming aspects of tracing the curve as well as the operator dependence associated with creating the curve. The interpreter must be cautioned, however, that different implementations of centerline algorithms have varying degrees of effectiveness in finding the true median path, and thus, the interpretation of a CPR should always be made in association with the review of the centerline trace. Another limitation of CPRs is that to the unfamiliar eye, they can present bizarre spatial representations of structures outside the vessels of interest. Particularly when blood vessels course in one direction and then double back on themselves, unusual artifacts called “loop artifacts” can be created (Fig. 6-18). As long as the observer focuses on the primary structure through which the curve is created (while ignoring unusual appearances of other structures), mistakes in interpretation can be avoided. Just as we typically think of MPRs as a collection of parallel planes stacked through the imaging volume, CPRs are more effectively created as a series of radially oriented planes through the curved centerline. By rotating through a series of CPRs created at regular intervals (e.g., 5 degrees) around the centerline, eccentric manifestations of mural thickening or disease deposition are readily demonstrated (Fig. 6-19) and provide greater analytical efficiency when compared with planar reformation translated through a cartesian axis (15).
reformations could only be achieved through manual tracing of a vessel centerline (Fig. 6-16). This labor-intensive process is both time consuming and operator dependent, with potential for substantial variability in the quality of the CPR. Over the past several years, software algorithms to automatically extract the median centerline of blood vessels have resulted in the introduction of automated techniques for creating CPRs (Fig. 6-17). Such automation eliminates both the time-consuming aspects of tracing the curve as well as the operator dependence associated with creating the curve. The interpreter must be cautioned, however, that different implementations of centerline algorithms have varying degrees of effectiveness in finding the true median path, and thus, the interpretation of a CPR should always be made in association with the review of the centerline trace. Another limitation of CPRs is that to the unfamiliar eye, they can present bizarre spatial representations of structures outside the vessels of interest. Particularly when blood vessels course in one direction and then double back on themselves, unusual artifacts called “loop artifacts” can be created (Fig. 6-18). As long as the observer focuses on the primary structure through which the curve is created (while ignoring unusual appearances of other structures), mistakes in interpretation can be avoided. Just as we typically think of MPRs as a collection of parallel planes stacked through the imaging volume, CPRs are more effectively created as a series of radially oriented planes through the curved centerline. By rotating through a series of CPRs created at regular intervals (e.g., 5 degrees) around the centerline, eccentric manifestations of mural thickening or disease deposition are readily demonstrated (Fig. 6-19) and provide greater analytical efficiency when compared with planar reformation translated through a cartesian axis (15).
An important adjunct to CPRs is stacks of cross sections oriented orthogonal or perpendicular to the median centerline of a vessel. The creation of a stack of cross sections in this fashion results in planes that are not parallel to one another but that maintain a perpendicular relationship to the median axis of the vessel as these images propagate along the length of the vessel (Fig. 6-20). This allows for a true assessment of variations in cross-sectional area (CSA) or cross-sectional wall thickening and forms the basis for many quantification techniques described later in this chapter. The stacked review of these orthogonal cross sections has been referred to as a “slice-through” display (15).
Volume Rendering and Ray Casting
Although the current connotation of “volume rendering” (VR) in medical imaging implies a specific 3D visualization technique that uses sophisticated algorithms to represent MR signal or CT attenuation characteristics, volume
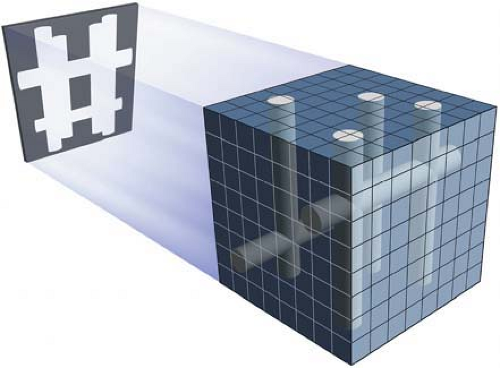
rendering also more broadly refers to a family of visualization techniques generally linked by “ray casting,” a process which creates 2D images derived from the information in 3D volumetric data sets. Ray casting is a process where the computer projects rays along a specified viewing direction through a volume or subvolume of the CT or MR data and uses characteristics of voxels encountered along each of these rays to compute pixel characteristics that compose an output image. By doing so, ray casting produces 2D images that represent projections from 3D volumes. Commonly seen ray casting techniques include maximum- and minimum-intensity projection (MIP and MinIP, respectively), ray sum, shaded-surface display (SSD), and VR (2,3,4,5,6,7,8,10,12,15,16,17).
rendering also more broadly refers to a family of visualization techniques generally linked by “ray casting,” a process which creates 2D images derived from the information in 3D volumetric data sets. Ray casting is a process where the computer projects rays along a specified viewing direction through a volume or subvolume of the CT or MR data and uses characteristics of voxels encountered along each of these rays to compute pixel characteristics that compose an output image. By doing so, ray casting produces 2D images that represent projections from 3D volumes. Commonly seen ray casting techniques include maximum- and minimum-intensity projection (MIP and MinIP, respectively), ray sum, shaded-surface display (SSD), and VR (2,3,4,5,6,7,8,10,12,15,16,17).
Maximum-intensity Projections
MIPs were introduced in the 1980s for MRA. They remain a mainstay of MRA visualization and have also found an important niche in CTA visualization.
As an example of ray casting, the value of the highest intensity voxel encountered by each ray becomes encoded in the output image (Fig. 6-21). Because pulse sequences for MR angiographic acquisitions are designed so that vascular lumina are the highest intensity structures, MIPs are a logical means to flatten 3D MR imaging volumes into 2D representations. This technique is perhaps the most commonly used VR technique for 3D MR angiographic data because it is operator independent, free of intensity thresholding, and easy to perform. Although MIPs seem tailor-made for MRA, there are important limitations to the MIP technique that must be understood (10,16,17).
First, when a ray encounters multiple blood vessels along its path through the imaging volume, only the brightest (maximum intensity) voxel encountered will be encoded on the final MIP image. As a result, in regions of vessel overlap, only the voxels from the brightest vessel will contribute to the pixels of the output image. Unlike conventional angiography, however, there is no summation of
structures in these regions of overlap to help separate the overlapping vessels. From a practical standpoint, this means that in areas of complex vascular branching or overlap, it can become impossible to decipher the specific path of individual arterial branches (Fig. 6-22). More importantly, while the assessment of arterial ostia and proximal portions of arteries originating from the aorta is critical to the evaluation of many vascular disease processes, these portions of branch vessels could be obscured if an MIP view is created with overlap of an aortic branch ostium and the aorta itself (Fig. 6-23).
structures in these regions of overlap to help separate the overlapping vessels. From a practical standpoint, this means that in areas of complex vascular branching or overlap, it can become impossible to decipher the specific path of individual arterial branches (Fig. 6-22). More importantly, while the assessment of arterial ostia and proximal portions of arteries originating from the aorta is critical to the evaluation of many vascular disease processes, these portions of branch vessels could be obscured if an MIP view is created with overlap of an aortic branch ostium and the aorta itself (Fig. 6-23).
Another important limitation of the MIP technique is its tendency to overgrade vessel stenoses. Stenosis overgrading is a well-recognized phenomenon with MIP (Fig. 6-24). This occurs as a consequence of an undesirable side effect of MIP where background intensity values are increased by the MIP process. As rays are cast through the background, noise in the background data will be present, and therefore the rays will encounter a variety of voxel values. Because only the brightest voxel (defined as the one having the maximum value) encountered by any ray will be encoded on the output image, greater degrees of noise will result in a greater variation of background voxel values and, consequently, higher maximum values encountered by the ray tracing.
Thus, background signal increases proportional to increasing noise in the data (Fig. 6-25).
Thus, background signal increases proportional to increasing noise in the data (Fig. 6-25).
Because vessel visualization is directly dependent on the contrast between the vessel lumen and background, there are two consequences of this phenomenon. First, small or less enhancing vessels can disappear in an MIP as background signal increases. Of greater practical importance, however, is that the ability to discriminate the outermost margins of narrowed blood vessels decreases and the degree of apparent narrowing increases as background noise increases (Figs. 6-25, 6-26). This occurs because voxels at the boundary of a vessel’s lumen have decreased signal due to volume averaging with unenhanced tissues and can blend into the background as the background noise increases. When vessels with narrower lumina (including segments of stenosis) are evaluated, the proportion of the luminal diameter with significant intravascular enhancement tends to decrease relative to the proportion of the vessel’s diameter composed of these boundary pixels that may be obscured by higher background signal levels.
Therefore, while MIP images conveniently provide a gross overview of vascular anatomy that tend to be easy to understand and are generally analogous to conventional angiographic images, there are also limitations to this technique. These limitations can be overcome when used in conjunction with curved planar reformatted images, which should provide the most accurate representation of vessel dimensions or in conjunction with planar images such as the primary reconstructions or MPRs.
When considering the use of MIP with CTA data, all of the aforementioned attributes of using MIP with MRA exist but with an additional important limitation. Because contrast-enhanced vascular lumina are frequently not the highest attenuation structures encountered within a CT volume, they may be obscured by overlying nonvascular structures with high density from mineralization or metal. The most common sources of mineralization are bones and arterial wall calcifications. However, other causes of mineralization (renal calculi, gallstones, myositis ossificans, calcified graft material, oral radiopaque contrast material) as well as metallic structures (wires, clips, joint prostheses, osseous fixation hardware, cardiac pacemakers) and associated streak artifact may also obscure vessel lumina on MIPs (Fig. 6-27). The elimination of nonvascular high-attenuation structures may be accomplished through a variety of segmentation processes that create subvolumes of data free of these high-attenuation structures. Currently, arterial wall calcification cannot be eliminated easily for the purpose of the creation of MIPs. Although some investigators have suggested that applying a threshold to the CT data can eliminate the calcification for the purpose of MIP creation, this approach is fraught with error. The arbitrary selection of the threshold assumes that the transition between luminal attenuation and mural calcium is constant, which is usually not the case. Without a dedicated method to analyze regional attenuation variations at interfaces between calcium and arterial lumina, or until availability of prospective methods for discriminating calcium from iodine such as dual energy approaches, automated removal of calcium from MIPs will remain a highly suspect pursuit.
It is important to note, however, that although arterial wall calcification obscures the arterial lumen on MIPs, the same MIPs can be a very effective means of conveying anatomic distribution of vascular calcifications. This qualitative calcium map can facilitate the selection of optimal locations for graft anastomoses and cross-clamp placement when performing arterial bypass procedures (Fig. 6-28). In the presence of moderate to extensive arterial wall calcification, luminal assessment is best performed with MPRs and CPRs rather than with MIPs.
Minimum-intensity Projections
Stay updated, free articles. Join our Telegram channel

Full access? Get Clinical Tree


