10
Normal Anatomy and Flow During the Complete Examination
Extracardiac Anatomy
 Introduction
 Anatomic Relationships
The esophagus extends from the oropharynx to the cardia of the stomach, transversing the chest and abdomen. It is anatomically situated posterior to the heart and trachea, running alongside the descending aorta, and then passing anterior to it as it crosses the diaphragm to enter the stomach. Therefore, as the TEE probe is placed through the esophagus and into the stomach to obtain upper-esophageal (UE) and midesophageal (ME) views, the imager will view the great vessels, heart, lungs, and pleural spaces on either side. As the probe then enters the stomach, the transgastric (TG) views are obtained. Using these views as a starting point, the imager can also evaluate the peritoneal space, liver, spleen, stomach, and kidneys. These topographical relationships are appreciated in Figures 10-1 through 10-7. 1
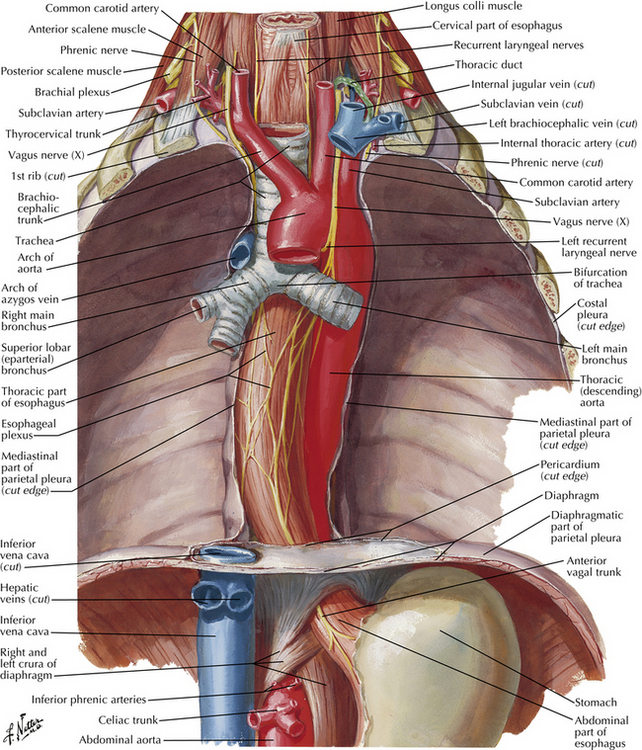
Figure 10-1 Esophagus as it courses through chest to abdomen. (Netter illustration from www.netterimages.com. © Elsevier Inc. All rights reserved.)
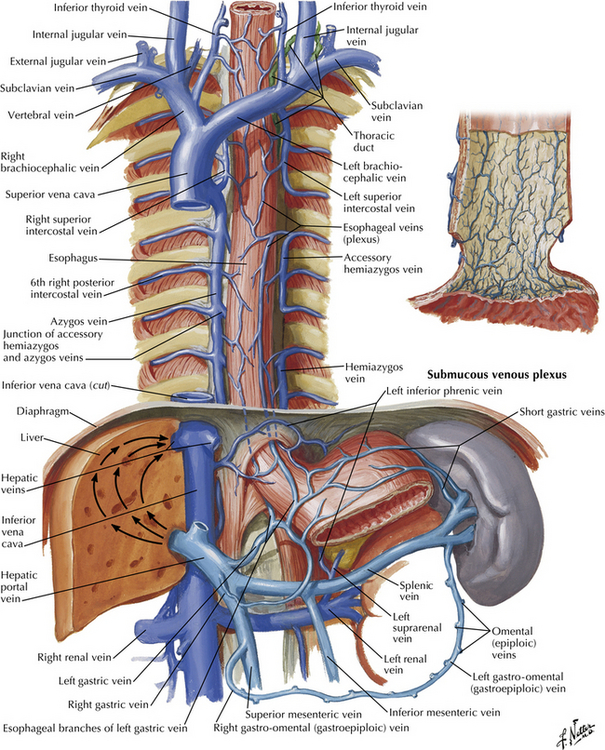
Figure 10-2 Esophagus, great veins in chest and upper abdomen, stomach, liver, and spleen. (Netter illustration from www.netterimages.com. © Elsevier Inc. All rights reserved.)
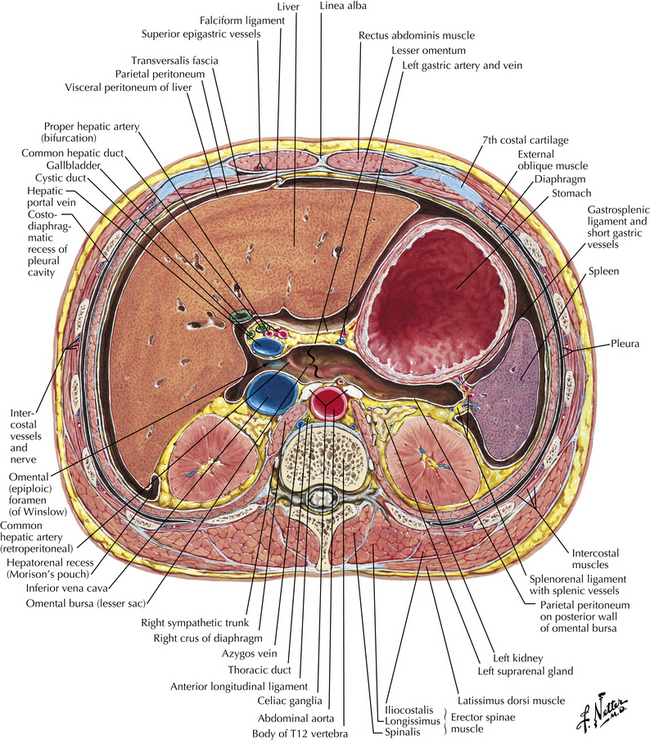
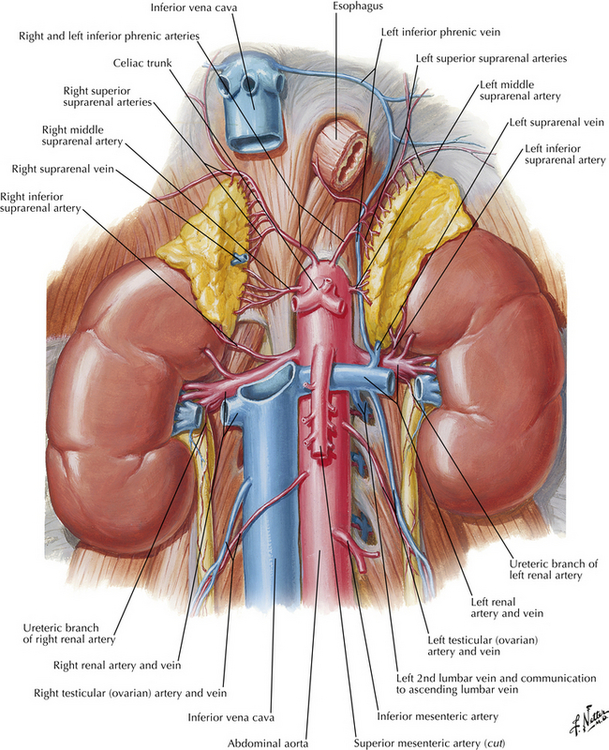
Figure 10-3 Cross-sectional view of upper abdomen, revealing stomach, liver, spleen, kidneys, and great vessels. (Netter illustration from www.netterimages.com. © Elsevier Inc. All rights reserved.)
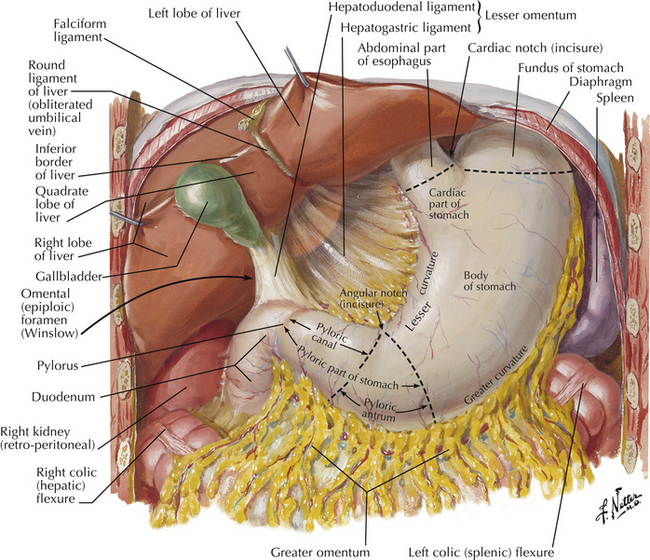
Figure 10-4 Stomach, its anatomy, and its relationship to liver and spleen. (Netter illustration from www.netterimages.com. © Elsevier Inc. All rights reserved.)
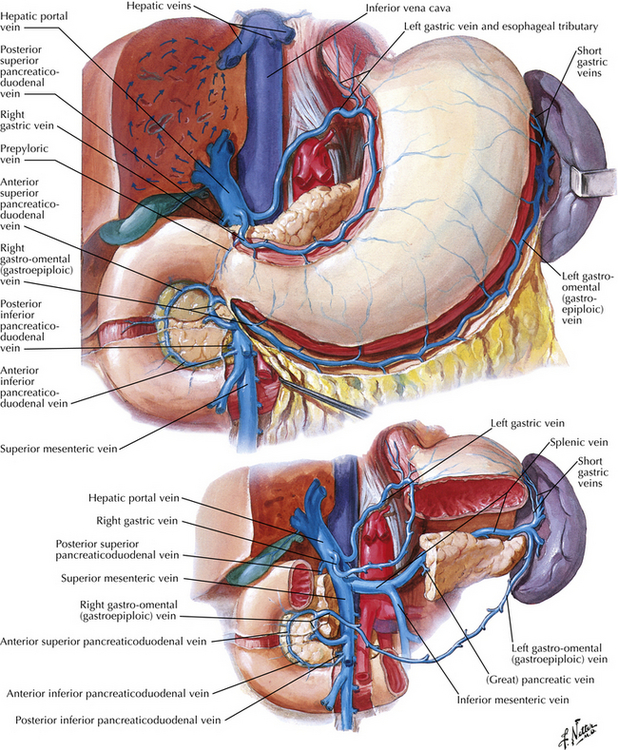
Figure 10-5 Stomach, spleen, and liver and their venous drainage. (Netter illustration from www.netterimages.com. © Elsevier Inc. All rights reserved.)
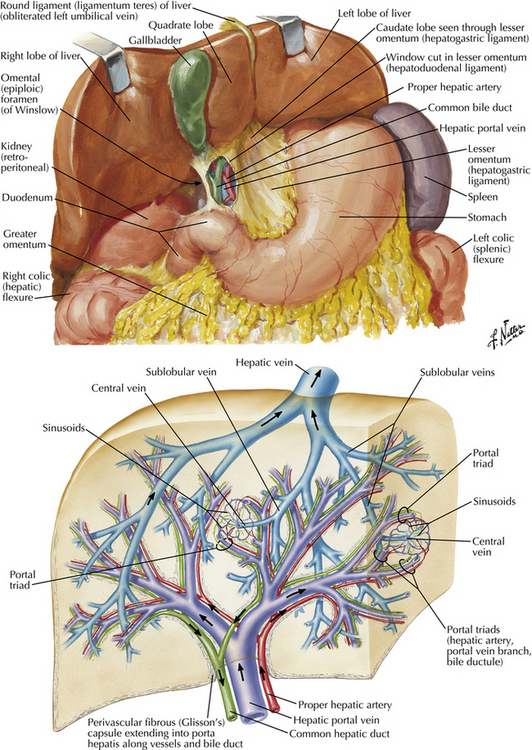
Figure 10-6 Liver and its vascular supply. (Netter illustration from www.netterimages.com. © Elsevier Inc. All rights reserved.)
 Lungs and Pleural Spaces
Because of their close proximity to the heart, the lungs should be easily viewed by turning the TEE probe either to the left (counterclockwise) or right (clockwise) from a standard ME four-chamber view. However, in its normal physiologic state, the lung is difficult to image sonographically because of the aerated nature of the organ, preventing penetration of acoustic energy. Low density and stiffness result in low acoustic impedance as well as a high attenuation coefficient, which in turn make acoustic imaging of this organ impractical.2–5
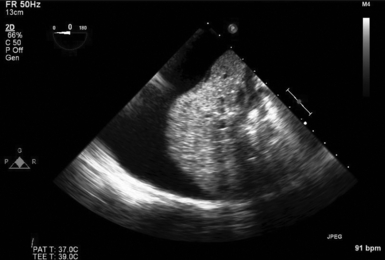
This stands in contrast to imaging capabilities under pathologic conditions. In the presence of lung collapse or consolidation, which results in loss of aeration, excellent visualization of the lungs and pleural spaces by TEE can be achieved.5,6 Ultrasonic air bronchograms and blood vessels are seen, along with relatively uniform tissue, producing a mosaic of echo images ( Fig. 10-8). 7 Therefore, the ability to obtain TEE images of the lung means, by definition, there is at least partial lung collapse.
Figure 10-8 Left pleural effusion with collapsed left lung, revealing bronchi and intrapulmonary blood vessels.
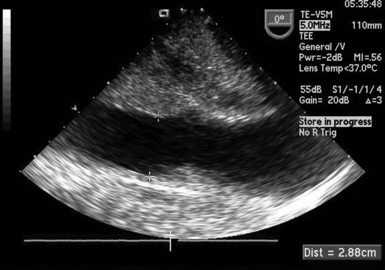
The left lung may be imaged by turning the probe to the left, or counterclockwise, from the standard ME four-chamber view and is seen in the area adjacent to the region of the descending aorta. Advancing the probe more distal into the stomach and withdrawing it will allow imaging along the length of the lung. A pneumothorax can be diagnosed by seeing an echo-free area next to a bright edge of the associated collapsed lung. Pleural effusion and hemothorax are visualized in the same area, often with associated septations, denoting fluid with a high protein content, blood, or blood clots, which appear as more highly echogenic images ( Fig. 10-9 and Video 10-1  ).5,7
).5,7
By rotating the probe to the right, or clockwise, from the ME four-chamber view, the right lung and pleural space can be imaged. It is often more difficult to visualize this space unless there is a large accumulation of air and/or fluid (see Figs. 10-8 and 10-9).
In contrast to transesophageal imaging, B-mode imaging obtained by transthoracic sonography provides the imager with reverberation artifacts that are produced by the interface of the chest wall and the pleural surface of the lung. M-mode imaging may produce a “sliding lung” or lung movement images in the normal lung and be absent with a pneumothorax.6–8
 Intraabdominal Fluid and Organs
Practice guidelines have been established for transabdominal ultrasonography of the abdomen and retroperitoneum, but these have not yet been transferred into the practice of TEE. 9
 Peritoneum
Physiologically the peritoneal space usually contains only a small amount of fluid, creating a virtual space allowing the intraabdominal organs to seamlessly glide past each other during movement. Owing to the close anatomic relationship of the intra- and retroperitoneal organs and the fact that they have similar acoustic impedances, it can become challenging to differentiate where one organ starts and the other one ends. Accumulation of ascites or blood will produce a greater (and potentially enlarging) space within the abdominal cavity, making identification of the organs easier ( Fig. 10-10).
Differentiation between an exudate and transudate of peritoneal fluid has been described using transabdominal ultrasound.10,11 Similar images may be obtained by TEE. Septations in the peritoneal fluid may represent fluid with a higher protein content, infected fluid, or blood, which in turn would be more indicative of an exudate.12,13
Hemoperitoneum may show septations in the peritoneal fluid and blood clots. If there is ongoing bleeding, as encountered with a ruptured viscus or vascular injury, a dynamic increase in the size of the peritoneal cavity can be appreciated sonographically and quantitatively documented by placing calipers ( Figs. 10-11 to 10-13).14–16
 Liver
Liver
In gross anatomic terms, the liver comprises four distinct lobes: the larger right, the left, the caudate, and the quadrate lobes. In practice, however, liver anatomy has been described in terms of its vascular supply. Sir James Cantlie described the division of the liver into right and left lobes, determined by the right and left portal venous blood supply along a line running from the fundus of the gallbladder to the center of the inferior vena cava (IVC). 17 Couinaud proposed a model that divides the liver into eight functional segments, and this model has been adopted by current liver surgical practice. This allows for resection of segments of the liver with their own blood supply while sparing the remaining segments.18,19
Tumors of the liver are usually more echogenic than the surrounding liver tissue, appearing as brighter (whiter), denser, and usually circular objects within the liver, occasionally with lucent areas within them representing cystic or infarcted portions of the tumor ( Figs. 10-14 and 10-15; Video 10-2  ).
).
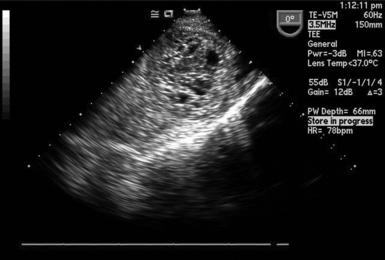
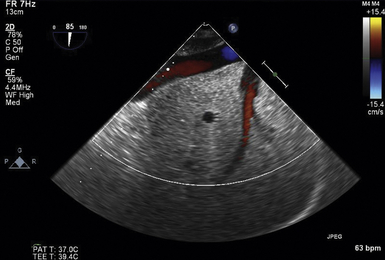
Figure 10-15 Intrahepatic inferior vena cava, right hepatic vein emptying into it, and branch of right portal vein.
Stay updated, free articles. Join our Telegram channel

Full access? Get Clinical Tree


