7
Normal Anatomy and Flow During the Complete Examination
Components of the Complete Examination
Jeremy S. Poppers, Sansan S. Lo, David J. West, Teresa A. Mulaikal, Michelle M. Liao and Jack S. Shanewise
 Introduction
Each clinician develops his or her own systematic approach to the assessment of valvular pathology and biventricular function. In this chapter, we discuss a structure-based approach to the normal transesophageal echocardiography (TEE) exam ( Table 7-1). In the operating room, it may be prudent to first obtain the Doppler and three-dimensional (3D) full-volume images, since the use of electrocautery will interfere with image acquisition using these modalities.
TABLE 7-1
 Left Atrium, Pulmonary Veins, and Left Atrial Appendage
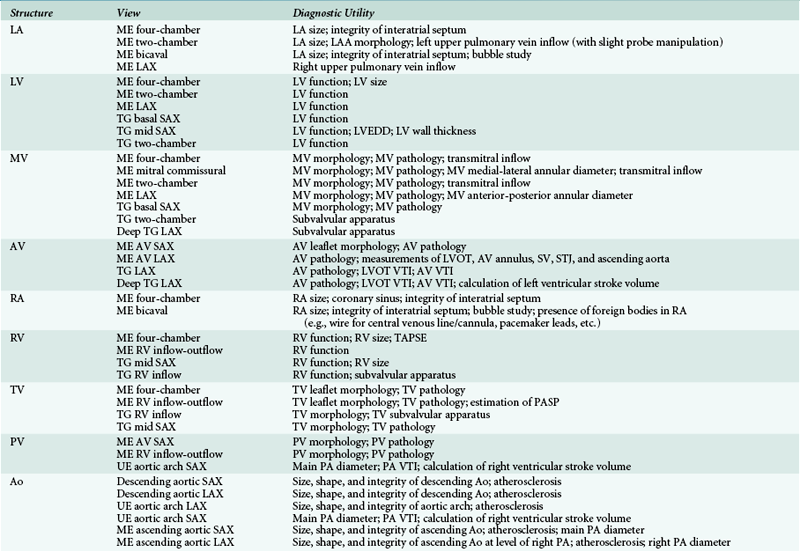
The pulmonary veins are often imaged in conjunction with the LA and mitral valve because of both anatomic proximity and physiologic relevance in the assessment of mitral regurgitation and diastolic function. The left pulmonary veins can be imaged in the midesophageal (ME) two-chamber ( Fig. 7-1,  Video 7-1) and four-chamber ( Fig. 7-2,
  Video 7-2) views. From the ME two-chamber view, the left upper pulmonary vein can be seen above the level of the LAA on the right side of the image sector by withdrawing the probe slightly along with leftward rotation. The ideal multiplane angle to view the left upper pulmonary vein will vary and may be found anywhere from 0 (ME four-chamber) to 90 degrees (ME two-chamber). Once the upper pulmonary vein has been identified, slightly advancing the probe further will occasionally bring the left lower pulmonary vein into focus as it converges with the left upper pulmonary vein.
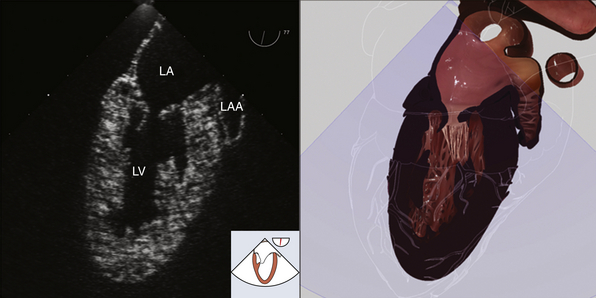
Figure 7-1 Midesophageal two-chamber view. LA, Left atrium; LAA, left atrial appendage; LV, left ventricle. (Two-dimensional TEE images and three-dimensional pictures generated using software developed by Heartworks, Inventive Medical Ltd., London, UK.)
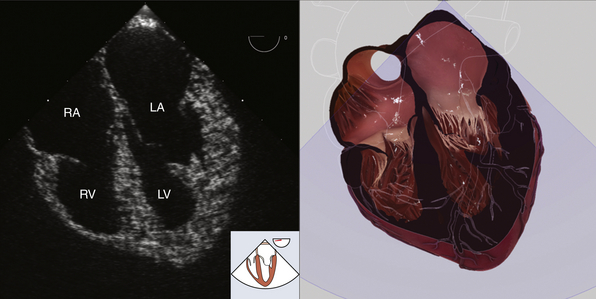
Figure 7-2 Midesophageal four-chamber view. LA, Left atrium; LV, left ventricle; RA, right atrium; RV, right ventricle. (Two-dimensional TEE images and three-dimensional pictures generated using software developed by Heartworks, Inventive Medical Ltd., London, UK.)
The right upper and lower pulmonary veins may be imaged by starting with the ME four-chamber view. Slight rightward rotation while slowly withdrawing the probe will reveal the veins as they merge and drain into the LA. Alternatively, the right upper pulmonary vein may be located by first finding an ME long-axis view ( Fig. 7-3,  Video 7-3) and then rotating the probe to the right. The vein will appear at the right lower portion of the image sector as it passes posterior to the superior vena cava (SVC) into the LA.
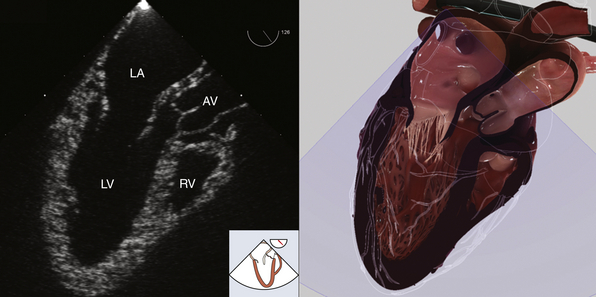
Figure 7-3 Midesophageal long-axis view. AV, Aortic valve; LA, left atrium; LV, left ventricle; RV, right ventricle. (Two-dimensional TEE images and three-dimensional pictures generated using software developed by Heartworks, Inventive Medical Ltd., London, UK.)
There are four phases to the normal pulmonary venous Doppler flow velocity profile ( Fig. 7-4). Place the pulsed wave Doppler gate 1 cm into the pulmonary vein to assess the inflow patterns. There is an antegrade systolic component, or S wave, composed of two phases, S1 and S2, but frequently seen as a single peak. S1 represents LA relaxation during systole, and S2 represents the effects of left ventricular contraction and mitral regurgitation if present. The third phase of the pulmonary venous Doppler flow velocity profile, the D wave, corresponds to the antegrade flow seen in early diastole. The Ar wave is the final phase, in which there is retrograde flow into the pulmonary veins during late diastole as a result of atrial contraction.1,2
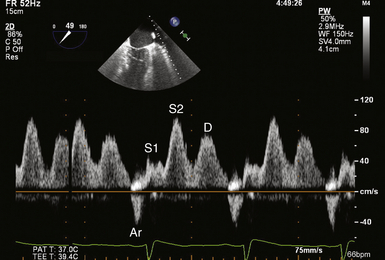
Figure 7-4 Normal pulse wave Doppler velocity profile of left upper pulmonary vein (LUPV) inflow. S1 corresponds to left atrial relaxation during systole. S2 represents effects of right ventricular contraction and mitral regurgitation during ventricular systole. D wave depicts antegrade blood flow from LUPV into left atrium in early diastole. Ar wave is retrograde flow into LUPV during late diastole as a result of atrial contraction.
 Left Ventricle
A comprehensive evaluation of the left ventricle (LV) includes an assessment of its chamber size, wall thickness, and function. LV function is assessed both qualitatively and quantitatively. Qualitative assessment of LV function is a skill developed over time and should frequently be checked against accepted quantitative measures of LV function (e.g., endocardial fractional shortening, fractional area change, method of disks, full-volume 3D, etc.). Segmental wall motion is assessed by analyzing each segment for endocardial excursion (movement of endocardium toward center of LV) and wall thickening. Normal endocardial excursion is greater than 30%, and normal wall thickening is 30% to 50%. 3
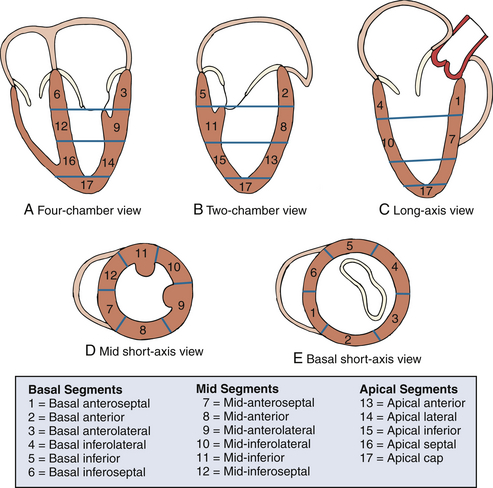
To assist in describing LV function and regional wall motion abnormalities, the LV is described using a 17-segment model 4 in which the LV is divided into four levels from base to apex: basal, mid-, apical, and apical cap ( Fig. 7-5). The basal level is divided circumferentially into six segments: basal anteroseptal, basal anterior, basal anterolateral, basal inferolateral, basal inferior, and basal inferoseptal. The mid-level is also divided circumferentially into six segments: mid-anteroseptal, mid-anterior, mid-anterolateral, mid-inferolateral, mid-inferior, and mid-inferoseptal. The apical level is divided circumferentially into four segments: apical anterior, apical lateral, apical inferior, and apical septal. The apical cap consists of the tip of the LV apex beyond the end of the LV cavity. When describing LV function, it is recommended that each segment of the 17-segment model be analyzed individually and in more than one view. A numeric scoring system is used to classify LV function of each segment based qualitatively on each segment’s motion and systolic thickening: normal or hyperkinesis = 1, hypokinesis = 2, akinesis (negligible thickening) = 3, dyskinesis (paradoxical systolic motion) = 4, and aneurysmal (diastolic deformation) = 5. 4
At least three views are required to evaluate all segments of the LV. Use of all six views described provides some redundancy (segments seen in more than one view) and may improve the accuracy of regional wall motion assessment. Examination of LV function begins with the ME four-chamber view (see Fig. 7-2,  Video 7-2). Slight retroflexion in this view may help avoid foreshortening of the LV during its assessment. Each segment of the LV is examined for regional wall motion abnormalities. In the ME four-chamber view, the following segments of the LV are evaluated: inferoseptal (basal, mid-, and apical), anterolateral (basal, mid-, and apical), and the apical cap. Next, the multiplane angle is increased until the ME two-chamber view (see Fig. 7-1, Video 7-1
  ) is obtained; the following segments of the LV are evaluated: anterior (basal, mid-, and apical), inferior (basal, mid-, and apical), and the apical cap. Next, the multiplane angle is increased to obtain the ME long-axis view (see Fig. 7-3,
  Video 7-3); the following LV segments are evaluated: anteroseptal (basal, mid-, and apical), inferolateral (basal, mid-, and apical), and the apical cap. Next, the probe is advanced into the stomach to obtain the transgastric (TG) basal short-axis view ( Fig. 7-6,
  Video 7-4) to evaluate the following segments: basal anterior, basal anterolateral, basal inferolateral, basal inferior, basal inferoseptal and basal anteroseptal. Then the TG midpapillary short-axis view ( Fig. 7-7,
  Video 7-5) is obtained to evaluate the following segments: mid-anterior, mid-anterolateral, mid-inferolateral, mid-inferior, mid-inferoseptal and mid-anteroseptal. The probe is then advanced slightly to evaluate the apex in short axis. Finally, increasing the multiplane angle to 90 degrees from the TG midpapillary short-axis image brings the TG two-chamber ( Fig. 7-8,
  Video 7-6) into view. Here, the inferior wall is toward the top of the image sector, and the anterior wall lies at the bottom of the screen.
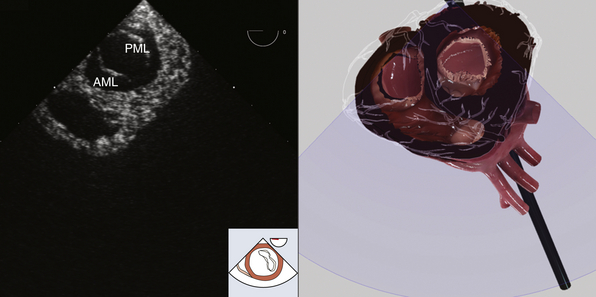
Figure 7-6 Transgastric basal short-axis view. AML, Anterior mitral leaflet; PML, posterior mitral leaflet. (Two-dimensional TEE images and three-dimensional pictures generated using software developed by Heartworks, Inventive Medical Ltd., London, UK.)
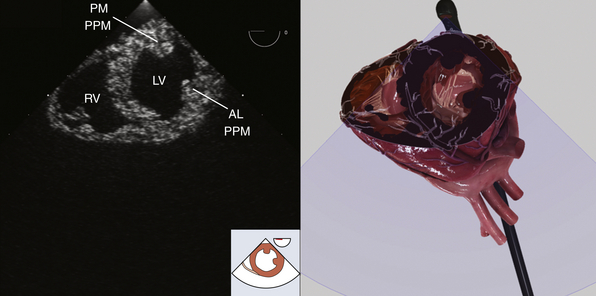
Figure 7-7 Transgastric midpapillary short-axis view. AL PPM, Anterolateral papillary muscle; LV, left ventricle; PM PPM, posteromedial papillary muscle; RV, right ventricle. (Two-dimensional TEE images and three-dimensional pictures generated using software developed by Heartworks, Inventive Medical Ltd., London, UK.)
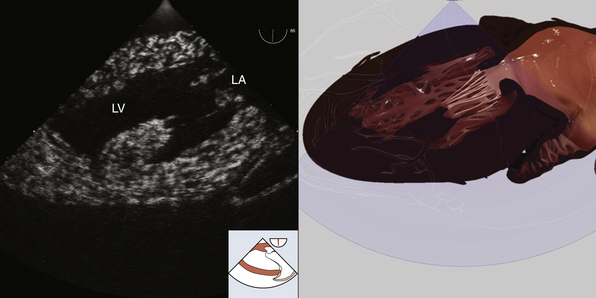
Figure 7-8 Transgastric two-chamber view. LA, Left atrium; LV, left ventricle. (Two-dimensional TEE images and three-dimensional pictures generated using software developed by Heartworks, Inventive Medical Ltd., London, UK.)
Determination of LV chamber size and wall thickness is most easily accomplished in the TG mid–short-axis view. Normal LV septal and inferolateral wall thicknesses are 0.6 to 0.9 cm for women and 0.6 to 1 cm for men. Normal LV end-diastolic diameter is 3.9 to 5.3 cm for women and 4.2 to 5.9 cm for men. 4 The electrocardiogram tracing should be used to ensure that measurements are made during the corresponding period of the cardiac cycle.
 Mitral Valve
The bileaflet mitral valve is the conduit through which blood travels from the LA to the LV. The larger anterior leaflet comprises two thirds of the entire valve surface but is attached to only one third of the annular circumference. 5 The anterior mitral valve leaflet is adjacent to the left and noncoronary aortic valve cusps. The posterior leaflet is smaller and scalloped and makes up two thirds of the annular circumference. The nomenclature described by Carpentier is most commonly used to identify the multiple anatomic segments of the mitral valve leaflet ( Fig. 7-9). From lateral to medial, the anterior leaflet is divided into the A1, A2, and A3 segments that are opposed by P1, P2, and P3 scallops of the posterior leaflet. The anterolateral and posteromedial commissures are the convergence points of A1 and P1, and A3 and P3, respectively. The anterolateral and posteromedial papillary muscles support the mitral valve leaflets and are associated with the similarly named commissure. Three orders of chordae attach the mitral valve to these papillary muscles. Primary chordae attach to the free edge of the mitral leaflets. Secondary chordae attach to the middle, or body, of the leaflets. Tertiary chordae attach only the posterior leaflet to the posteromedial papillary muscle. The mitral valve is in close proximity to the circumflex artery, coronary sinus, right fibrous trigone, and bundle of His, making these structures susceptible to injury during mitral valve surgery. 5
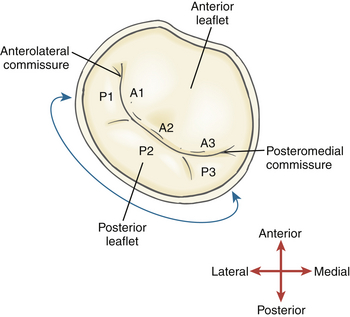
Figure 7-9 Mitral valve, depicting nomenclature used by Carpentier to describe the three scallops of posterior mitral leaflet and three segments of anterior mitral leaflet.
The mitral valve can be evaluated using the ME as well as TG views. In the ME four-chamber view (see Fig. 7-2,  Video 7-2), the anterior leaflet will appear in the center of the image sector and the posterior mitral leaflet to the right of the image. Any abnormalities of the mitral apparatus such as excessive or restricted leaflet motion, annular or subvalvular calcification, or redundant or myxomatous leaflet tissue should be noted. Color flow Doppler (CFD) is useful to assess for mitral stenosis or regurgitation.
From the ME four-chamber view, rotate the multiplane angle to about 60 degrees for an ME mitral commissural view ( Fig. 7-10,  Video 7-7). The exact angle depends on the individual’s anatomy and usually varies from 50 to 80 degrees. In a neutral position, the P3-A2-P1 segments of the mitral leaflets are visualized from the middle to right of the image sector. Chordae from the anterolateral papillary muscle, which appears on the right side of the image sector, attach to P1 and the lateral side of A2. Chordae emanating from P3 and the medial side of A2 insert into the posteromedial papillary muscle, which appears on the left side of the image sector. CFD is again used to document the presence of regurgitation or stenosis. The medial-lateral mitral annular diameter is measured from the ME commissural view. Finally, by rotating the probe to the left (counterclockwise), all three scallops of the posterior mitral leaflet may be inspected, whereas rightward (clockwise) rotation brings the segments of the anterior leaflet into view. Further rightward rotation will reveal the aortic valve in the middle of the image sector, emphasizing its anatomic relationship to the mitral valve, lying just anterior.
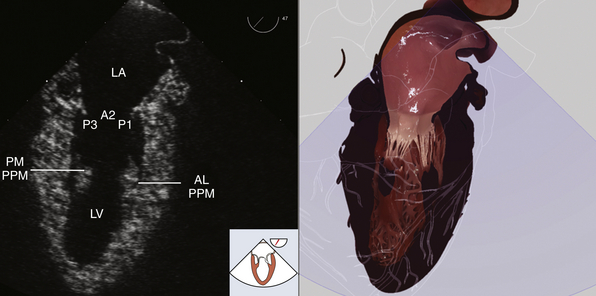
Figure 7-10 Midesophageal mitral commissural view. Mitral valve (P3, A2, P1 scallops). AL PPM, Anterolateral papillary muscle; LA, left atrium; LV, left ventricle; PM PPM, posteromedial papillary muscle. (Two-dimensional TEE images and three-dimensional pictures generated using software developed by Heartworks, Inventive Medical Ltd., London, UK.)

Stay updated, free articles. Join our Telegram channel

Full access? Get Clinical Tree


