The prognostic usefulness of the cardiac biomarkers N-terminal pro-brain natriuretic peptide (NT-proBNP) and angiotensin-converting enzyme 2 (ACE-2), in predicting adverse cardiac outcomes after orthopedic surgery is not well studied. The aim of our study was to determine the usefulness of perioperative NT-proBNP and ACE-2 for predicting cardiac events after emergency orthopedic surgery. The perioperative NT-proBNP and ACE-2 levels were determined in 187 consecutive patients aged >60 years who underwent orthopedic surgery with 1 year of follow-up for any cardiac complications (defined as acute myocardial infarction, congestive cardiac failure, atrial fibrillation, or major arrhythmia) and death. Of the 187 patients, 20 (10.7%) sustained an in-hospital postoperative cardiac complication. The total all-cause in-hospital and 1-year mortality rate was 1.6% (3 of 187) and 8.6% (16 of 187), respectively. The median preoperative and postoperative NT-proBNP level was greater in patients who sustained an in-hospital cardiac event than in those who had not (386 vs 2,273 pg/ml, p <0.001, and 605 vs 4,316 pg/ml, p <0.001, respectively). Similarly, the postoperative median ACE-2 levels were significantly greater in the patients with an in-hospital cardiac event than in those without (25.3 vs 39.5 pmol/ml/min, p = 0.012). A preoperative NT-proBNP level of ≥741 pg/ml (odds ratio 4.5, 95% confidence interval 1.3 to 15.2, p = 0.017), postoperative troponin elevation (odds ratio 4.9, 95% confidence interval 1.3 to 18.9, p = 0.022), and number of co-morbidities (odds ratio 1.8, 95% confidence interval 1.2 to 2.8, p = 0.009) independently predicted in-hospital cardiac complications on multivariate analysis. The pre- and postoperative NT-proBNP level independently predicted 1-year cardiovascular complications but not the ACE-2 levels. In conclusion, elevated perioperative NT-proBNP predicted in-hospital and 1-year cardiac events in an emergency orthopedic population but the ACE-2 levels did not, which requires additional study for validation.
Newer cardiac biomarkers have emerged that could play a role in perioperative care. Brain natriuretic peptide (BNP) and its inactive metabolite N-terminal pro-BNP (NT-proBNP) have been investigated mainly in patients with heart failure and recently after orthopedic surgery, where elevated pre- and postoperative NT-proBNP levels predicted in-hospital cardiac events and 1- and 2-year mortality. BNP is a counter-regulatory hormone released predominantly from ventricular myocytes in response to ventricular dysfunction, stretching, increased wall tension, and ischemia. Another novel peptidase is angiotensin-converting enzyme 2 (ACE-2), found mainly in the heart and kidney. ACE-2 cleaves angiotensin 1 to angiotensin 1 to 9 and degrades angiotensin II to the vasodilator angiotensin 1 to 7 and might help to modulate the balance between vasoconstrictor and vasodilators and therefore have a role in regulating the cardiovascular system. It is activated after a myocardial infarction and is expressed by infiltrating mononuclear cells, suggesting involvement in the initial inflammatory response. A previous study has found marked myocardial expression of ACE-2 early after myocardial infarction, and ACE-2 expression is increased in ischemic cardiac explants of heart transplant recipients. This observational study evaluated NT-proBNP and ACE-2 levels perioperatively after emergency orthopedic surgery and evaluated their association with postoperative cardiac events and mortality.
Methods
The present study was performed in conjunction with a randomized controlled trial randomizing patients who sustained a troponin elevation to usual (standard) care or cardiology care (Australian New Zealand Clinical Trials Registry trial number ACTRN12608000165381). Ethics approval was given by the Northern Hospital Human Research and Ethics Committee, and patients were consecutively recruited from 2008 to 2009.
The patients were recruited from the orthopedic-geriatric unit at Northern Hospital (Epping, Victoria, Australia). Patients were included if they were >60 years old and had undergone emergency orthopedic surgery. The patients were excluded if they had undergone elective surgery, had died before surgery, or were not candidates for cardiology care intervention, such as patients from nursing homes, patients with an estimated survival of <1 year (e.g., terminal cancer), or patients with moderate to severe dementia.
Patients continued to receive usual care from the orthopedic-geriatric unit, including the additional ordering of troponin measurements or electrocardiograms, if clinically indicated. As a part of the randomized controlled trial, the patients with elevated postoperative troponin were randomized that day to either routine or cardiology care. The description of the cardiology management was beyond the scope of the present report but, in brief, included evaluation for the cause of the troponin elevation, continuous Holter monitoring for at ≥24 hours, and treatment of myocardial ischemia, if warranted, with cardiac medication.
NT-proBNP and ACE-2 were measured after the trial concluded. Serum was collected before surgery and daily on postoperative days 1 to 3. Blood was collected in a standard manner by the pathology nurses on the ward and then centrifuged on arrival at the laboratory. The serum was separated into aliquots and stored at −80°C until tested for NT-proBNP and ACE-2. Assays for the present study were performed by experienced laboratory scientists who were unaware of the patient’s clinical data and pathology results.
The Elecsys electrochemiluminescence immunoassay “ECLIA” proBNP II assay was used to test the NT-proBNP levels using a Roche Cobas E170 analyzer. This assay used 2 polyclonal antibodies that recognized epitopes located on the N-terminal part of proBNP. The lower limit of the detection range (sensitivity) was 5 pg/ml. The within-run coefficient of variation is 1.9% at a concentration of 64 pg/ml and 1.3% at 14,142 pg/ml. The total precision coefficient of variation is 3.1% at a concentration of 36 pg/ml and 2.7% at a concentration of 125 pg/ml.
Human plasma has an endogenous inhibitor of ACE-2; thus, we have developed and validated an anion exchange extraction process that allows us to measure circulating ACE-2 in human plasma using a sensitive-quenched fluorescent substrate-based assay. Plasma (0.25 ml) was diluted into low-ionic-strength buffer (20 mmol/L Tris-HCl, pH 6.5) and added to 200 μl ANXSepharose 4 Fast-Flowresin (AmershamBiosciences, GE Healthcare, Uppsala, Sweden). After binding and washing, the proteins were eluted with high-salt buffer (20 mmol/L Tris-HCl, 1 mol/L NaCl, pH 6.5), and the resulting eluate was assayed for ACE-2 catalytic activity. After the extraction process, 100 μl of the eluate was incubated in duplicate with an ACE-2–specific quenched fluorescent substrate [7-methoxycoumarin-4-yl)-acetyl-Ala-Pro-Lys (2,4-dintirophenyl), Auspep, Parkville, Victoria, Australia] with or without 100 μ m ethylenediaminetetraacetic acid in a total volume of 200 μl. The rate of substrate cleavage was determined by comparison to a standard curve of the free fluorophore, 4-amino-methoxycoumarin (Sigma, St. Louis, Missouri) and expressed as pmole of substrate cleaved/ml of plasma/min.
Consenting patients had blood drawn for troponin I on the first 3 postoperative days. Troponin was tested immediately after blood collection postoperatively. However, preoperative troponin was only tested and assayed after the operation. The preoperative specimen was stored in a refrigerator at 4°C for 7 to 10 days. It has previously been shown that troponin results remain stable during this time. This serum was assayed at the same time the first postoperative troponin blood test was ordered. This ensured that the study did not interfere with the preoperative management. The Beckman-Coulter troponin I assay was used, with the 99th percentile of a healthy reference population of <0.04 μg/L. Levels of ≥0.05 μg/L were considered abnormal for the purposes of the present study. The results of troponin were known to both the researchers and the treating team at testing.
A physician associated with the present study and independent of the treating unit obtained medical and demographic data from the medical records and interviewed the patients and their caregivers for information, if necessary. Cardiac events and other complications were determined clinically by the treating team with review by the research team to confirm the events. The patients were reviewed daily during the inpatient stay for symptoms of myocardial ischemia. Cardiac events included acute myocardial infarction, congestive cardiac failure, new-onset or rapid atrial fibrillation, major arrhythmia, and cardiac arrest. For the present study, postoperative acute myocardial infarction was diagnosed by an increase in troponin I to greater than the reference range accompanied by either ischemic symptoms, ischemic electrocardiographic changes, or new pathologic Q waves. This was determined by the recent Task Force definition of acute myocardial infarction.
Statistical analysis was performed using SPSS, version 17.0 (SPSS, Chicago, Illinois) and Excel 2003, version 11 (Microsoft, Redmond, Washington). Normally distributed continuous are expressed as the mean ± SD and were compared using the Student t test. Non-normally distributed continuous data (e.g., NT-proBNP levels, ACE-2 levels) are expressed as the median and range and were compared using the Mann-Whitney U statistic. Pearson’s correlation was used to determine the correlations between the troponin and ACE-2 levels. NT-proBNP levels and ACE-2 levels were dichotomized according to the optimal cutoff value established from the receiver operating characteristic (ROC) curve analysis. Linear regression analysis was used for continuous variables. Univariate logistic regression analysis was performed to evaluate the association between the baseline patient characteristics and in-hospital cardiac events and 1-year events. Predictors with p <0.05 on univariate analysis were candidates for the multivariate logistical regression model. For predictors of 1-year mortality, the multivariate Cox proportional hazards model was used. Kaplan-Meier curves were constructed to determine survival. Survival between groups was compared using log-rank testing.
Results
A total of 383 patients were screened for the present study, and 187 eligible patients were included. The reason for exclusion for most patients was receiving high-level care, undergoing elective surgery, terminal illness, or coexisting severe dementia. Fifteen eligible patients declined involvement in the study. Most patients had preoperative blood samples stored for NT-proBNP analysis (161 [86.1%] of 187). Similarly, most patients had postoperative blood samples available for postoperative NT-proBNP testing (175 [93.6%] of 187 patients). The patient characteristics and pathologic findings are listed in Tables 1 and 2 .
| Variable | All Patients (n = 187) | In-Hospital Postoperative Cardiovascular Event | OR (95% CI) | p Value ⁎ | |
|---|---|---|---|---|---|
| Yes (n = 20) | No (n = 167) | ||||
| Age (years) | 76.7 ± 9.3 | 80.2 ± 7.9 | 76.2 ± 9.4 | 1.0 (1.0–1.1) | 0.079 |
| Men | 54 (29%) | 8 (40%) | 46 (28%) | 1.8 (0.67–4.6) | 0.250 |
| Total co-morbidities (n) | 2.2 ± 1.4 | 3.4 ± 1.9 | 2.0 ± 1.2 | 2.0 (1.3–2.9) | 0.001 † |
| Co-morbidity type | |||||
| Coronary heart disease | 31 (17%) | 8 (40%) | 23 (13%) | 4.2 (1.5–11.3) | 0.005 † |
| Congestive cardiac failure | 13 (7%) | 3 (15%) | 10 (6%) | 2.8 (0.7–11.1) | 0.149 |
| Hypertension | 116 (62%) | 15 (75%) | 101 (61%) | 2.0 (0.7–5.7) | 0.213 |
| Atrial fibrillation | 14 (8%) | 4 (20%) | 10 (6%) | 3.9 (1.1–14.0) | 0.035 † |
| Renal failure | 6 (3%) | 2 (10%) | 4 (2%) | 4.5 (0.8–26.5) | 0.094 |
| Dementia1 | 4 (8%) | 1 (5%) | 13 (8%) | 0.6 (0.08–5.0) | 0.658 |
| Diabetes mellitus | 43 (23%) | 6 (30%) | 37 (23%) | 1.5 (0.5–4.2) | 0.433 |
| Emphysema | 15 (8%) | 2 (10%) | 13 (8%) | 1.3 (0.3–6.3) | 0.731 |
| Stroke | 19 (10%) | 4 (20%) | 15 (9%) | 2.5 (0.8–8.6) | 0.134 |
| Smoker | 20 (11%) | 4 (20%) | 16 (10%) | 2.4 (0.7–7.9) | 0.165 |
| Malignancy | 3 (2%) | 0 (0%) | 3 (2%) | NA | NA |
| Medication | |||||
| βBlocker | 42 (23%) | 7 (35%) | 35 (21%) | 2.0 (0.8–5.5) | 0.161 |
| Antiplatelet agent | 61 (33%) | 10 (50%) | 51 (31%) | 2.3 (0.9–5.8) | 0.089 |
| Warfarin | 12 (6%) | 3 (15%) | 9 (5%) | 3.1 (0.8–12.6) | 0.113 |
| Angiotensin-converting enzyme inhibitor/angiotensin II receptor blocker | 90 (48%) | 11 (55%) | 79 (47%) | 1.4 (0.5–3.5) | 0.516 |
| Calcium channel blocker | 38 (20%) | 5 (25%) | 33 (20%) | 1.4 (4.6–4.0) | 0.583 |
| Nitrate | 6 (3%) | 1 (5%) | 5 (3%) | 1.7 (0.2–15.3) | 0.638 |
| Diuretic | 49 (26%) | 7 (35%) | 42 (25%) | 1.6 (0.6–4.2) | 0.355 |
| Statin | 57 (31%) | 7 (35%) | 50 (30%) | 1.3 (0.5–3.3) | 0.643 |
| Nonsteroidal anti-inflammatory drug | 10 (5%) | 0 (0%) | 10 (6%) | NA | NA |
| Fracture type | 0.8 (0.5–1.3) | 0.391 | |||
| Neck of femur | 92 (49%) | 14 (70%) | 78 (47%) | 2.7 (1.0–7.3) | 0.056 |
| Lower limb | 35 (19%) | 1 (5%) | 34 (20%) | ||
| Upper limb | 51 (27%) | 2 (10%) | 49 (29%) | ||
| Other | 9 (5%) | 3 (15%) | 6 (4%) | ||
| Interval to surgery (days) | 1.0 ± 2.2 | 2.4 ± 2.5 | 2.0 ± 2.2 | 1.1 (0.9–1.3) | 0.454 |
| Anesthetic type | 0.7 (0.4–1.1) | 0.117 | |||
| General | 121 (65%) | 11 (55%) | 110 (66%) | ||
| Spinal or regional59 (32%) | 9 (45%) | 50 (30%) | |||
| Combination general and spinal or regional | 7 (4%) | 0 (0%) | 7 (4%) | ||
| Operative time (hours) | 1.5 ± 0.8 | 1.5 ± 0.9 | 1.5 ± 0.8 | 1.0 (0.6–1.7) | 0.959 |
⁎ Unadjusted p value for predictors of postoperative cardiovascular complications.
| Variable | All Patients (n = 187) | In-Hospital Postoperative Cardiovascular Event | OR (95% CI) | p Value ⁎ | |
|---|---|---|---|---|---|
| Yes (n = 20) | No (n = 167) | ||||
| NT-proBNP (pg/ml) | <0.001 | ||||
| Preoperative | 436 (10–47,612) | 2,273 (64–27,594) | 386 (10–47,612) | 10.9 (3.7–32.1) | |
| Postoperative | 657 (31–82,058) | 4,316 (321–59,197) | 605 (31–82,058) | 7.7 (2.6–22.2) | |
| ACE-2 level (pmol/ml/min) | |||||
| Preoperative | 20.3 (0.348–257.2) | 33.5 (1.0–163.4) | 19.4 (0.34–257.2) | 1.0 (0.99–1.0) | 0.314 |
| Postoperative | 26.2 (0.2–451.8) | 39.5 (8.0–451.8) | 25.3 (0.2–247.7) | 1.01 (1.01–1.02) | 0.012 |
| Preoperative NT-proBNP ≥741 pg/ml | 51 (27%) | 15 (75%) | 36 (22%) | 10.9 (3.7–32.1) | <0.001 |
| Postoperative NT-proBNP ≥1,064 pg/ml | 62 (33%) | 15 (75%) | 47 (28%) | 7.7 (2.6–22.3) | <0.001 |
| Troponin elevation | <0.001 | ||||
| Preoperative | 29 (11.4%) | 10 (50%) | 19 (11%) | 7.8 (2.9–21.1) | |
| Postoperative | 70 (37.4%) | 16 (80%) | 54 (32%) | 8.4 (2.7–26.2) | |
| Hemoglobin (g/L) | |||||
| Preoperative | 12.1 ± 1.8 | 11.8 ± 2.6 | 12.2 ± 1.8 | 0.9 (0.7–1.2) | 0.399 |
| Postoperative | 10.7 ± 1.8 | 10.1 ± 2.1 | 10.7 ± 1.8 | 0.8 (0.6–1.1) | 0.113 |
| Creatinine (μmol/L) | |||||
| Preoperative | 85.5 ± 47.6 | 109.0 ± 43.4 | 82.4 ± 47.4 | 1.0 (1.0–1.0) | 0.068 |
| Postoperative | 88.3 ± 55.2 | 105.6 ± 57.0 | 86.0 ± 54.7 | 1.0 (1.0–1.0) | 0.164 |
| Estimated glomerular filtration rate (mL/min/1.73m 2 ) | |||||
| Preoperative | 68.9 ± 20.6 | 55.8 ± 24.0 | 70.6 ± 20.0 | 0.97 (0.95–0.99) | 0.004 |
| Postoperative | 66.8 ± 20.8 | 56.5 ± 22.0 | 68.2 ± 20.3 | 0.97 (0.95–0.99) | 0.017 |
| White blood cell count (× 10 9 /L) | |||||
| Preoperative | 10.9 ± 5.9 | 11.1 ± 3.5 | 10.9 ± 6.1 | 1.0 (0.9–1.1) | 0.784 |
| Postoperative | 10.4 ± 4.1 | 10.8 ± 3.3 | 10.3 ± 4.2 | 1.0 (0.9–1.1) | 0.580 |
⁎ Unadjusted p value for predictors of postoperative cardiovascular complications.
The postoperative troponin elevations were significantly associated with greater NT-proBNP levels (p <0.001). Of the 187 patients, 51 had a preoperative NT-proBNP of ≥741 pg/ml. Of these 51 patients, 36 (70.6%) had an associated postoperative troponin elevation. Similarly, 62 of 187 patients had a postoperative NT-proBNP level of ≥1,064 pg/ml, and 46 (74.2%) of the 62 had a postoperative troponin elevation.
The ACE-2 level taken at the peak troponin level had a median value of 27.43 pmol/ml/min (interquartile range 38.70, minimum 0.24, maximum 509.73 pmol/ml/min). Of the 187 patients, 144 (77%), 176 (94.1%), 177 (94.7%) had blood stored and tested for ACE-2 levels preoperatively, on postoperative day 1, and at the peak troponin level. The mean difference in ACE-2 levels between postoperative day 1 and preoperatively was 8.13 pmol/ml/min (minimum −75.3, maximum 163.7, SD 30.2). Using Pearson’s correlation, the postoperative day 1 ACE-2 levels correlated significantly with the postoperative troponin levels (r = 0.512, p <0.001) and the peak troponin level correlated with the postoperative ACE-2 level (r = 0.423, p <0.001). However, the preoperative ACE-2 level did not correlate significantly with the preoperative troponin level (r = 0.133, p = 0.113).
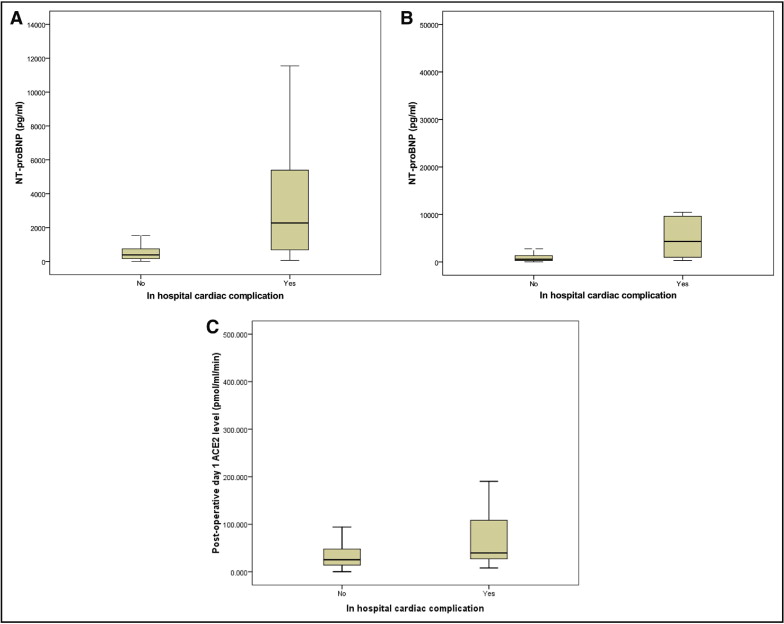
Of the 187 patients, 20 (10.7%) sustained an in-hospital cardiac complication. Postoperative acute myocardial infarction occurred in 12 patients (6.4% of the cohort), postoperative atrial fibrillation in 3 (1.6%), and postoperative cardiac failure in 9 (4.8%); 3 patients (1.8%) died in hospital. The predictors of in-hospital cardiovascular complications are listed in Tables 1 and 2 . The preoperative median NT-proBNP level was significantly greater in those who sustained an in-hospital cardiac event than in those who did not (386 vs 2,273 pg/ml, p <0.001; Figure 1 ). Similarly, the postoperative median NT-proBNP level was significantly greater in those who sustained an in-hospital cardiac event than in those who did not (605 vs 4,316 pg/ml, p <0.001). Additionally, the postoperative median ACE-2 levels were significantly greater in patients who sustained an in-hospital cardiac event than in those who did not (25.3 vs 39.5 pmol/ml/min, p = 0.012; Figure 1 ). The preoperative ACE-2 levels did not significantly predict in-hospital cardiac events (p = 0.314).
Stay updated, free articles. Join our Telegram channel

Full access? Get Clinical Tree


