Congenital Heart Diseases


Congenital Heart Diseases


Congenital heart diseases are broadly defined as those cardiac anomalies that are present at birth. By their very nature, such defects have their origin in embryonic development. Most congenital cardiac lesions constitute gross structural abnormalities with a spectrum of associated hemodynamic derangements. It is not surprising that the various echocardiographic techniques are ideally suited to the study of patients with congenital heart disease. Perhaps nowhere in cardiology have these methods played a more vital role in diagnosis and management. Historically, the emergence of two-dimensional echocardiography must be viewed as a milestone in the diagnostic approach to congenital heart disease. The tomographic nature of the technique and the unlimited number of imaging planes permit the anatomy and relationships of the cardiac structures to be defined, even in the presence of complex congenital malformations. For the noninvasive assessment of cardiac structure and function, echocardiography plays a preeminent role as the most accurate and widely applied method.

The echocardiographic approach to patients with congenital heart lesions differs substantially from that used to evaluate other forms of cardiac disease. Imaging in children has both advantages and disadvantages compared with adults. The smaller patient size permits the use of higher frequency transducers, thereby enhancing image quality. The presence of less heavily calcified bone and the absence of hyperinflated lungs in most children increase the available acoustic windows and generally contribute to improved image quality. Unfortunately, the smaller patient size also creates practical problems for image acquisition. Children are more likely to be uncooperative and may have other malformations (such as a chest deformity) that complicate imaging.

Adults with congenital heart disease present an entirely different array of challenges to the echocardiographer. The decision to intervene in these patients frequently hinges on the adequacy of previous interventions and the presence and severity of pulmonary vascular disease. In patients who have undergone surgery, an accurate assessment may be difficult. When details of the clinical history are unavailable, the echocardiographer is often called on to determine which surgical procedures have been performed. The options for further intervention often depend on the echocardiographic results. As the patient with congenital heart disease ages, the superimposition of other medical conditions (such as hypertension or coronary disease) further complicates his or her evaluation and management. Both image acquisition and interpretation can be challenging and timeconsuming. The diversity and complexity of congenital cardiac malformations obviate even the most basic assumptions regarding chamber orientation and great vessel relationships. These problems are magnified in the patient who has undergone a surgical procedure previously. Therefore, the initial evaluation of the patient with suspected congenital heart disease mandates a thorough and systematic echocardiographic approach, often using additional views beyond those obtained during the standard examination.

This chapter focuses on the role of echocardiography in the adolescent and adult with congenital heart disease. Guidelines for the use of echocardiographic techniques in this growing patient population are provided in Table 20.1. The chapter is not intended as an exhaustive description of all forms of congenital heart disease. Lesions that are seen more commonly in adult patients are emphasized, whereas those considered less relevant are covered only superficially. Finally, the evaluation of the postoperative patient is covered in some detail.


Table 20.1 Indications for Echocardiography in the Adult Patient with Congenital Heart Diseasea


Class


1.


Patients with clinically suspected congenital heart disease, as evidenced by signs and symptoms such as a murmur, cyanosis, or unexplained arterial desaturation, and an abnormal electrocardiogram or radiograph suggesting congenital heart disease


I


2.


Patients with known congenital heart disease on follow-up when there is a change in clinical findings


I


3.


Patients with known congenital heart disease for whom there is uncertainty as to the original diagnosis or when the precise nature of the structural abnormalities or hemodynamics is unclear


I


4.


Periodic echocardiograms in patients with known congenital heart lesions and for whom ventricular function and atrioventricular valve regurgitation must be followed (e.g., patients with a functionally single ventricle after a Fontan procedure, transposition of the great vessels after a Mustard procedure, L-transposition and ventricular inversion, and palliative shunts)


I


5.


Patients with known congenital heart disease for whom following pulmonary artery pressure is important (e.g., patients with moderate or large ventricular septal defects, atrial septal defects, single ventricle, or any of the above with an additional risk factor of pulmonary hypertension)


I


6.


Periodic echocardiography in patients with surgically repaired (or palliated) congenital heart disease with the following: change in clinical condition or clinical suspicion of residual defects, left or right ventricular function that must be followed, or the possibility of hemodynamic progression or a history of pulmonary hypertension


I


7.


To direct interventional catheter valvotomy, radio frequency ablation valvotomy interventions in the presence of complex cardiac anatomy


I


8.


A follow-up Doppler echocardiographic study, annually or once every 2 years, in patients with known hemodynamically significant congenital heart disease without evident change in clinical condition


IIb


9.


Multiple repeat Doppler echocardiography in patients with a repaired patent ductus arteriosus, atrial septal defect, ventricular septal defect, coarctation of the aorta, or bicuspid aortic valve without change in clinical condition


IIIa


10.


Repeat Doppler echocardiography in patients with known hemodynamically insignificant congenital heart lesions (e.g., small atrial septal defect, small ventricular septal defect) without a change in clinical condition


III


aAdapted from Cheitlin MD, Alpert JS, Armstrong WF, et al. ACC/AHA Guidelines for the Clinical Application of Echocardiography: a report of the American College of Cardiology/American Heart Association Task Force on Practice Guidelines (Committee on Clinical Application of Echocardiography) developed in collaboration with the American Society of Echocardiography. Circulation 1997;95:1686-1744, with permission.


The Echocardiographic Examination: A Segmental Approach to Anatomy

The initial echocardiographic examination of the patient with suspected congenital heart disease requires a sequential and systematic approach to cardiac anatomy. Such a method is necessary to detect cardiac malpositions and to diagnose complex congenital heart disease. The first step in this sequential approach is to determine atrial situs and to assess the venous inflow patterns to the atria. Then, atrioventricular connections are defined and ventricular morphology and position are determined. Finally, ventriculoarterial relationships are evaluated. In most cases, this approach permits the identification of even the most complex forms of congenital heart disease (Table 20.2).


Cardiac Situs

Determination of atrial situs is best accomplished by using the subcostal views. In atrial situs solitus, the normal situation, the morphologic right atrium is to the right and the morphologic left atrium is to the left. In situs inversus, the opposite occurs, creating a mirror image effect. Atrial and visceral situs are almost always concordant. Thus, a right-sided liver and left-sided stomach are usually associated with atrial situs solitus. In the rare cases when atrial and abdominal situs are discordant, however, the likelihood of complex congenital lesions is high. By using two-dimensional echocardiography, the location and morphology of the atria can be determined. The morphologic right atrium always contains the eustachian valve, and its appendage is shorter and broader than that of the left atrium. The left atrium lacks the eustachian valve and has a more rounded shape than the right atrium. The left atrial appendage is long and thin and has a narrower atrial junction than that of the right atrial appendage.

Although venous inflow does not define atrial morphology, the patterns of systemic and pulmonary venous return are helpful in determining situs. This spatial relationship is best evaluated using a transverse imaging plane through the upper abdomen. Normally, the abdominal aorta lies to the left and the inferior vena cava lies to the right of the spine. Compared with the vena cava, the aorta appears larger, more rounded, and more pulsatile. When in doubt, color flow imaging can be used to differentiate between the two vessels by demonstrating higher velocity and primarily systolic flow in the aorta (Fig. 20.1). The opposite spatial relationship is characteristic of situs inversus. By tracing the course of the inferior vena cava and hepatic veins in the subcostal long-axis view, the right atrium generally can be identified in its usual position anterior and to the right of the left atrium (Fig. 20.2).


Table 20.2 A Segmental Approach to Cardiac Situs and Malpositions


Atrial situs


Visceral situs (and visceroatrial concordance)


Atrial morphology (situs solitus or inversus)


Venous inflow patterns


Ventricular localization


Ventricular morphology (D-loop or L-loop)


Atrioventricular concordance (atrioventricular valve morphology)


Base-to-apex axis (levocardia or dextrocardia)


Great artery connections


Identification of the great arteries


Ventriculoarterial concordance or transposition


Spatial relationship between the great arteries and ventricular septum


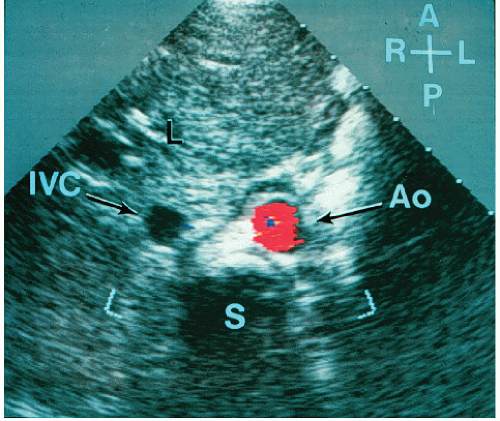
FIGURE 20.1. Subcostal short-axis view of the subject with situs solitus. The liver (L) and inferior vena cava are on the patient’s right, and the aorta is to the patient’s left. With the use of color flow imaging, flow within the aorta is detected. A, anterior; I; L, left; P, posterior; R, right; S, spine.

The pulmonary venous connections to the left atrium may be visualized using the apical and suprasternal window (Fig. 20.3). Color Doppler imaging is particularly helpful in identifying the pulmonary veins as they enter the left atrium. In adults, it is usually impossible to record the insertion of all four pulmonary veins using transthoracic echocardiography. With transesophageal echocardiography, however, the pulmonary venous drainage pattern can be defined more precisely. Because of the possibility of anomalous pulmonary venous drainage, the relationship between the pulmonary veins and the left atrium is not constant, and their connections should not be used to define atrial morphology.


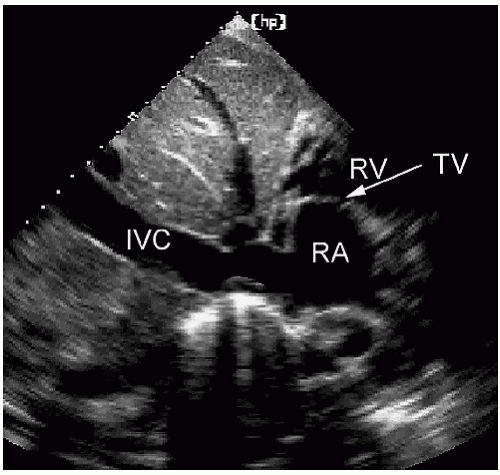
FIGURE 20.2. Subcostal long-axis view of a normal subject. The inferior vena cava can be seen entering the right atrium. TV, tricuspid valve.


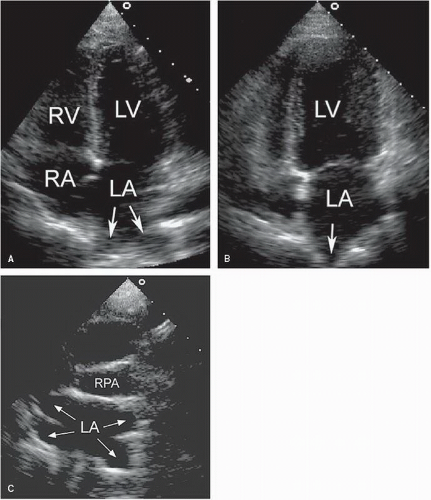
FIGURE 20.3. Apical four- (A) and two-chamber (B) views from a patient demonstrate the entrance of the pulmonary veins (arrows) into the left atrium. C: A suprasternal short-axis view shows the posterior region of the left atrium, below the right pulmonary artery (RPA), where the pulmonary veins enter (arrows).


Ventricular Morphology

Once visceroatrial situs and venous connections are established, the orientation and morphology of the ventricles should be determined. During normal embryogenesis, the straight heart tube folds to the right (a D-loop) and then pivots to occupy a position within the left side of the chest. This positioning results in the right ventricle developing anteriorly and to the right of the left ventricle. The base-to-apex axis points leftward and most of the cardiac mass lies within the left side of the chest. If the initial fold in the heart tube is leftward, an L-loop develops, with the morphologic right ventricle to the left of the morphologic left ventricle. Thus, atrioventricular discordance occurs in the presence of situs solitus and an L-loop or situs inversus and a D-loop.

Ventricular morphology is readily assessed with twodimensional echocardiography. Features that are useful in distinguishing the right and left ventricles are listed in Table 20.3. The presence of muscle bundles, particularly the moderator band, gives the right ventricle a trabeculated endocardial surface (Fig. 20.4). In contrast, the left ventricle is characterized by a smooth endocardial surface. This distinction is apparent using echocardiography and serves as one of the more reliable characteristics when determining ventricular morphology. The structure and position of the atrioventricular valves are additional echocardiographic clues that are useful in distinguishing the right and left ventricles. If two ventricles are present, the
atrioventricular valves associate with the corresponding ventricle and identification of the mitral and tricuspid valves defines the respective chambers. The tricuspid valve is more apically displaced and has three leaflets (and three papillary muscles) and chordal insertions into the septum. The mitral valve has a more basal septal attachment and has two leaflets, which insert into two papillary muscles but not the septum. All these features can be assessed with echocardiography. The four-chamber view allows the echocardiographer to determine ventricular morphology and the relative positions of the atrioventricular valves. The short-axis views permit definition of the papillary muscles and chordal insertions. The relative positions of the atrioventricular valves and the presence or absence of chordal insertions into the septum are the most helpful echocardiographic features when attempting to determine ventricular identity.


Table 20.3 Echocardiographic Characteristics of Right and Left Ventricles


Right Ventricle


Left Ventricle


Trabeculated endocardial surface


Smooth endocardial surface


Three papillary muscles


Two papillary muscles


Chordae insert into ventricular septum


Ellipsoidal geometry


Infundibular muscle band


Mitral atrioventricular valve with two leaflets with relatively basal insertion


Moderator band


Triangular cavity shape


Tricuspid atrioventricular valve with relatively apical insertion


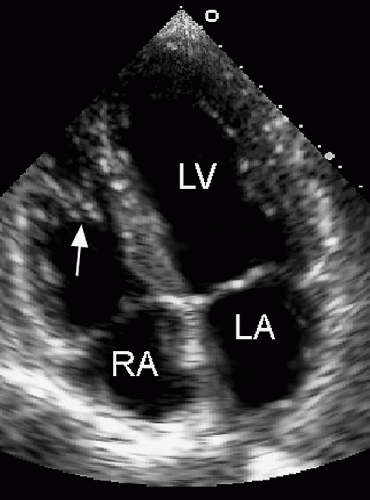
FIGURE 20.4. Apical four-chamber view from a healthy subject with a prominent moderator band (arrow), which represents a normal structure that is occasionally confused with thrombus or tumor.


Great Artery Connections

The final step in the segmental approach to cardiac anatomy involves identification of the great arteries and their respective connections. In the normal heart with concordant connections, the morphologic left ventricle gives rise to the aorta and the pulmonary artery serves as the outlet of the right ventricle. In the presence of normal ventricular orientation, this arrangement results in an anterior and leftward pulmonary artery and a posterior and rightward aorta with a left-sided aortic arch and descending aorta. The great arteries originate in orthogonal planes creating a “sausage and circle” appearance on short-axis imaging, which results from the rotation during development of the right ventricular outflow tract and pulmonary artery (the “sausage”) around the ascending aorta (the “circle”). Discordant ventriculoarterial connections, or transposition, occur when the great arteries arise from the opposite ventricle. Two forms of transposition exist. In D-transposition, ventricular relationship is normal, with the morphologic right ventricle located to the right of the morphologic left ventricle. In L-transposition, atrioventricular discordance is present (because of formation of an L-loop during embryogenesis) so that the morphologic right ventricle lies to the left of the morphologic left ventricle.

Two-dimensional echocardiography permits accurate identification of the great arteries and their origins and relationship. The short-axis view at the base of the heart is most helpful when assessing these features. In the normal heart, the pulmonary valve lies slightly anterior and to the left of the aortic valve (Fig. 20.5). The pulmonary artery then courses posteriorly and bifurcates, with the right pulmonary artery passing immediately below the aortic arch. These findings are best appreciated in the parasternal long- and short-axis and subcostal views. The proximal aorta is optimally recorded from the parasternal window and the suprasternal notch (Fig. 20.6). To identify the great arteries, the course of the vessel and the presence or absence of a bifurcation are the most reliable echocardiographic signs. The presence of a right aortic arch can also be detected by
assessing from the suprasternal short-axis view the course of the brachiocephalic vessels as they leave the arch.


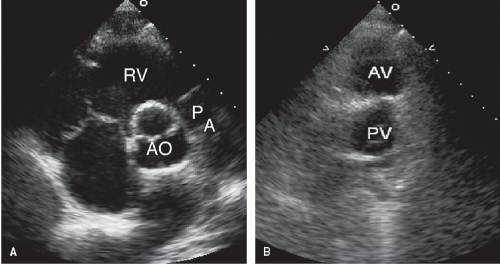
FIGURE 20.5. Parasternal short-axis echocardiograms from a healthy subject (A) and a patient with D-transposition of the great arteries (B). In the healthy subject, the aortic valve (AV) is posterior and the right ventricular outflow tract and pulmonary artery (PA) appear to wrap around the aorta. With transposition, the aorta is anterior and the two great vessels arise in parallel. PV, pulmonary valve.


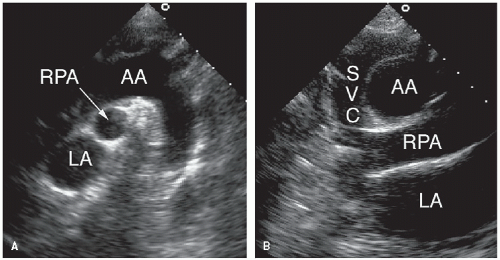
FIGURE 20.6. Suprasternal long- (A) and shortaxis (B) views from a healthy subject. The right pulmonary artery (RPA) passes below the aortic arch (AA) and above the left atrium. The superior vena cava can be seen to the right of the aortic arch.


Abnormalities of Right Ventricular Inflow

The right ventricular inflow tract and tricuspid valve are visualized using the apical and subcostal four-chamber views, the short-axis view at the base, and the medially angulated parasternal long-axis view. The most important congenital pathologic entities involving the tricuspid valve are Ebstein anomaly and tricuspid atresia (discussed subsequently). Ebstein anomaly consists of apical displacement of the septal and posterior (and sometimes the anterior) leaflets of the tricuspid valve into the right ventricle. Typically, the leaflets are elongated and redundant with abnormal chordal attachments. This results in “atrialization” of the basal portion of the right ventricle as the functional orifice is displaced apically relative to the anatomic annulus. Ebstein anomaly is a spectrum of abnormalities, depending on the extent of apical displacement of the valve, the distal attachments of the leaflets, the size and function of the remaining right ventricle, the degree of tricuspid regurgitation, and the presence of right ventricular outflow tract obstruction (usually from the redundant anterior tricuspid valve leaflet).


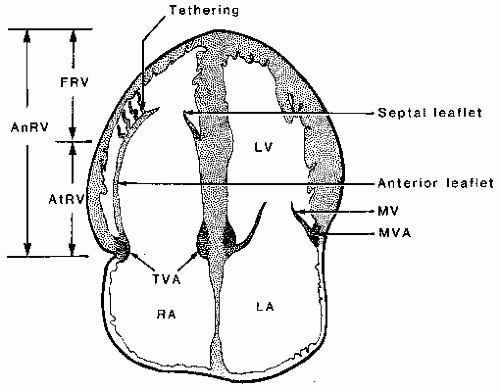
FIGURE 20.7. Schematic of anatomic abnormalities in Ebstein anomaly. AnRV, anatomic right ventricle; AtRV, atrialized right ventricle; FRV, functional right ventricle; MV, mitral valve; MVA, mitral valve annulus; TVA, tricuspid valve annulus.

The best echocardiographic view for the evaluation of Ebstein anomaly is the four-chamber view. The characteristic features identified in this plane are shown schematically in Figure 20.7. Of principal importance is the accurate recording of the level of insertion of the septal leaflet of the tricuspid valve relative to the annulus. Apical displacement of this insertion site is optimally assessed in this view and is the key to diagnosis (Fig. 20.8). Because the tricuspid valve is normally positioned more apically than the mitral valve, abnormal apical displacement is relative, and some investigators have suggested measuring the distance between insertion sites of the two atrioventricular valves. When normalized for body surface area, a distance of greater than 8 mm/M2 is indicative of Ebstein anomaly. Other
investigators have advocated a maximal displacement of more than 20 mm as the diagnostic criterion in adults.


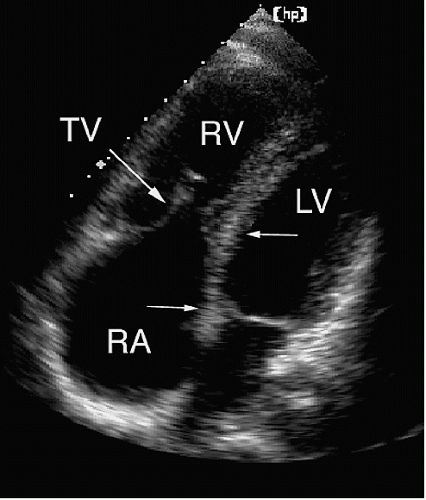
FIGURE 20.8. A four-chamber view from a patient with Ebstein anomaly. The arrows indicate the degree of apical displacement of the tricuspid valve (TV), which had restricted motion. Note that the functional portion of the right ventricle is fairly well preserved.


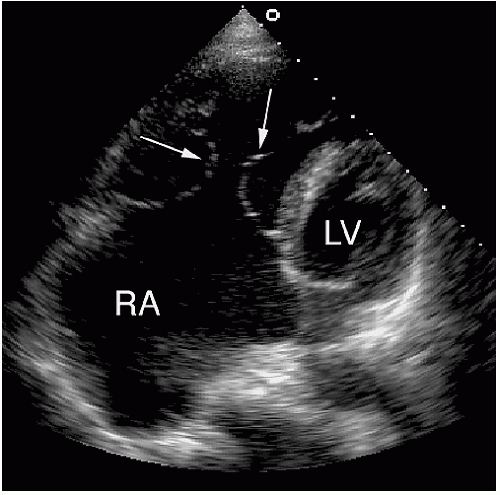
FIGURE 20.9. A more extreme form of Ebstein anomaly. The tricuspid valve (arrows) is markedly abnormal, and there is tethering of the leaflets, which prevented normal coaptation and resulted in significant tricuspid regurgitation. The right atrium is severely dilated.

The four-chamber and medially angulated parasternal views may be used to assess the severity of Ebstein anomaly and to determine surgical options. The degree of atrialization of the ventricle, the extent of leaflet tethering, and the magnitude of deformity or dysplasia of the valve leaflets are important features with implications for surgical repair (Fig. 20.9). The extent of chordal attachments between the anterior leaflet and the anterior free wall should be assessed in multiple views. If tethering is significant, valve replacement rather than repair may be required. The greater the degree of atrialization is, the worse the prognosis. Figure 20.10 is an example of an extreme form of Ebstein anomaly, with displacement of the tricuspid leaflets well into the right ventricular apex and marked tethering of the valve tissue. If the area of the functional right ventricle is less than one third of the total right ventricular area, overall prognosis is poor. Because of the complexity of right ventricular geometry, an accurate measure of the size of the functional right ventricle is difficult, and all available views should be used. Doppler echocardiography should be used to detect tricuspid regurgitation, which is commonly seen in patients with Ebstein anomaly (Fig. 20.11). A redundant anterior tricuspid valve leaflet may cause functional right ventricular outflow tract obstruction, which can also be detected with Doppler imaging. In severe cases, pulmonary atresia may be present, although it is rarely seen in adults.


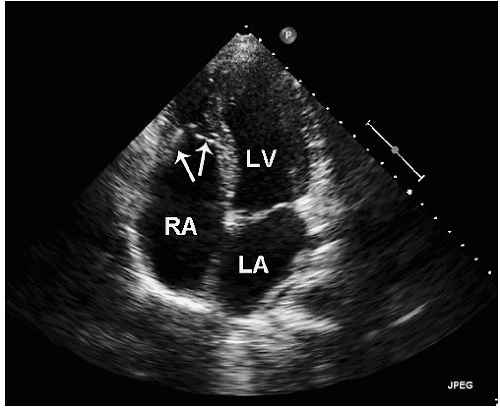
FIGURE 20.10. An example of Ebstein anomaly. From the apical four-chamber view, the tricuspid valve leaflets (arrows) are displaced far into the right ventricular apex.


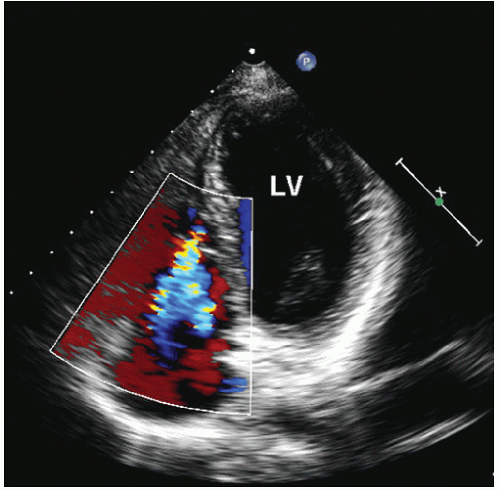
FIGURE 20.11. Color flow imaging is used to demonstrate tricuspid regurgitation in the setting of Ebstein anomaly.

Ebstein anomaly may be associated with a variety of other abnormalities that can be detected with echocardiography, namely, atrial septal defect, mitral valve prolapse, and left ventricular dysfunction. The etiology of the left ventricular dysfunction is not known, but its presence is associated with a poor prognosis. Surgical options in patients with Ebstein anomaly include tricuspid valve repair or replacement. After surgical repair, echocardiography plays a role in assessing the success of the procedure and the function of the tricuspid valve.


Abnormalities of Left Ventricular Inflow


Pulmonary Veins

Obstruction of left ventricular inflow can occur at several levels (Table 20.4). Pulmonary vein stenosis may be seen as an isolated entity or in association with other congenital lesions. In one form, discrete areas of stenosis involving one or more pulmonary veins occur at or near the junction with the left atrium. Alternatively, hypoplasia of the pulmonary veins may be present. The echocardiographic diagnosis of the discrete form of pulmonary vein stenosis is contingent on the ability to visualize the entrance of the veins into the left atrium, which is optimally recorded using the apical and subcostal four-chamber views. In younger patients, a posteriorly angulated suprasternal short-axis view (sometimes referred to as the “crab view”) can also be obtained (Fig. 20.3C). Usually, only the right or left upper pulmonary veins are imaged. Because of the proximity of
the transducer to the left atrium, transesophageal echocardiography is superior for recording the insertion of the pulmonary veins (Fig. 20.12A). An approach to pulmonary vein visualization using this technique is covered in detail in Chapter 8. In most patients, all four veins can be visualized. Echocardiography has also been used for the diagnosis of pulmonary vein obstruction from compression by an extrinsic mass or secondary to stricture after an atrial fibrillation ablation procedure.


Table 20.4 Levels of Obstruction of Left Ventricular Inflow


Pulmonary veins


Pulmonary vein stenosis (discrete)


Hypoplastic pulmonary veinss


Extrinsic compression


Left atrium


Cor triatriatum


Supravalvular stenosing ring


Mitral valve


Hypoplastic mitral valve


Congenital mitral stenosis


Parachute mitral valve


Anomalous mitral arcades


Double-orifice mitral valve


Visualizing pulmonary vein stenosis with two-dimensional echocardiography is rarely possible, and Doppler imaging is the primary means of securing a noninvasive diagnosis. Color Doppler imaging is useful when attempting to identify venous inflow and to detect the turbulent flow associated with stenosis. Because of the increase in velocity distal to the stenosis, color Doppler imaging may record a jet of blood entering the left atrium near the posterior wall. Turbulent flow in the posterior left atrium may be the initial echocardiographic abnormality and should suggest the possibility of a stenotic pulmonary vein. Then, pulsed Doppler imaging can be used to assess the inflow pattern and determine flow velocity. Normally, biphasic antegrade pulmonary venous flow (during ventricular systole and early diastole) is recorded (Fig. 20.12B). With stenosis, the flow velocity increases and becomes turbulent and more continuous. An example of mild pulmonary vein stenosis in an adult is presented in Figure 20.13.


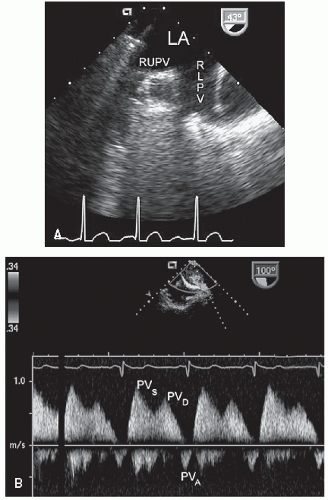
FIGURE 20.12. A: A transesophageal echocardiogram shows the entrance of the right lower pulmonary vein (RLPV) and the right upper pulmonary vein (RUPV) into the left atrium. B: Flow in the left upper pulmonary vein is recorded from transesophageal echocardiography. In this example, moderately increased flow velocity is the result of left-to-right shunting through an atrial septal defect. PVS, PVD, and PVA refer to pulmonary vein flow during systole, diastole, and atrial systole, respectively.


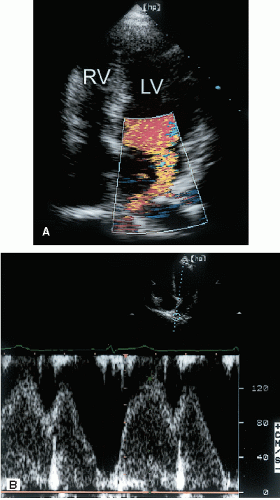
FIGURE 20.13. A patient with pulmonary vein stenosis. A: Color Doppler imaging demonstrates a turbulent jet that appears to originate from the right upper pulmonary vein as it enters the left atrium. B: Pulsed Doppler imaging reveals nearly continuous antegrade flow and increased velocity.


Left Atrium

Obstruction of left ventricular filling also occurs at the atrial level, usually because of a fibrous membrane that impedes the flow of blood through the chamber. These membranes may be located in the middle of the atrium, effectively partitioning the left atrium into two chambers (a condition known as cor triatriatum), or they may occur at or near the level of the mitral annulus (a supravalvular stenosing ring). Such membranes are readily detected and localized with two-dimensional echocardiography. The membrane is visualized as a linear, echogenic structure extending from the anterosuperior to the posterolateral wall. In most cases, the superior “chamber” receives the pulmonary veins and the inferior “chamber” is associated with

the atrial appendage and mitral valve (which is usually normal). Because of the orientation of the membrane, the four-chamber view is often optimal because it places the membrane perpendicular to the beam. Note in Figure 20.14 the improved visualization of the membrane from an apical window compared with the parasternal view. The obligatory perforation connecting the two is most often posterior and may be multiple. This communication may be difficult to record with echocardiography. Color Doppler imaging usually permits localization of the opening in the membrane so that the pressure gradient can be assessed with pulsed Doppler imaging (Fig. 20.15). When the transthoracic study is suboptimal, transesophageal echocardiography should be used for evaluating this entity. Figure 20.16 is an example of cor triatriatum assessed from the transthoracic approach. The atrial membrane is clearly visualized from multiple views.


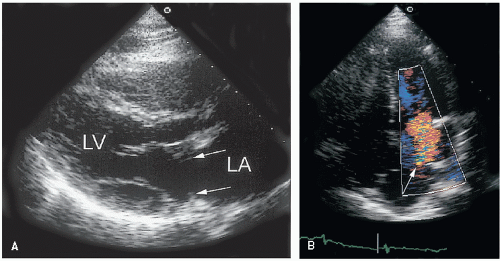
FIGURE 20.14. Cor triatriatum is demonstrated from the parasternal long-axis (A) and fourchamber (B) views. The membrane (arrows) within the left atrium is much better seen from the apical window. In such cases, color Doppler imaging is useful to demonstrate turbulent flow through the defect in the membrane (arrow).


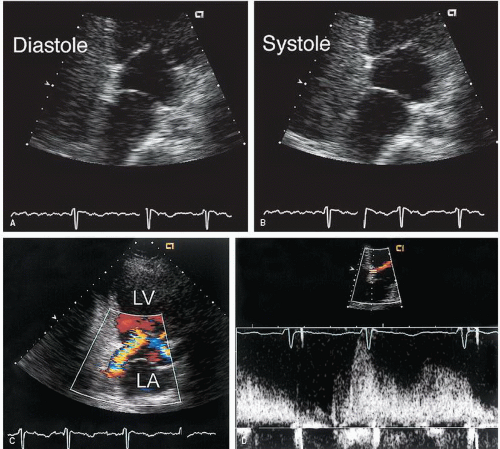
FIGURE 20.15. An example of cor triatriatum. The diastolic frame (A) and systolic frame (B) demonstrate the relationship of the membrane to the mitral valve. C: Color Doppler imaging reveals the perforation within the membrane and the turbulent flow into the lower portion of the left atrium. D: Pulsed Doppler imaging is used to assess flow velocity across the membrane, which has an appearance similar to that of mitral stenosis.


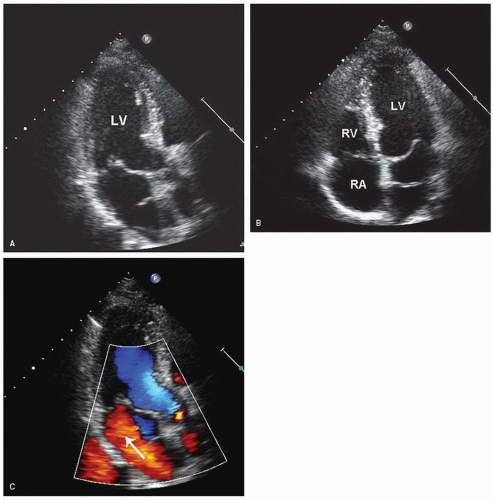
FIGURE 20.16. In this patient with cor triatriatum, the linear echo seen within the left atrium represents a membranous partition in the chamber. This membrane is visualized from the apical long-axis (A) and the four-chamber view (B). In panel C, color flow imaging demonstrates left atrial flow around the membrane and through the mitral valve, confirming incomplete partitioning of the atrium.

Distinguishing among the different levels of left ventricular inflow obstruction requires a combination of two-dimensional imaging and Doppler imaging and is best accomplished using the parasternal long-axis and apical four-chamber views. An example of a supravalvular stenosing ring, in the setting of Shone’s complex, is presented in Figure 20.17. In this case, both a subaortic membrane and a supravalular stenosing ring are present. In contrast to cor triatriatum, these supravalvular membranes are closer to the mitral valve and may actually adhere to the valve leaflets. In the example presented, the membrane was not well visualized in the long-axis view, although restricted mobility of the mitral leaflets was apparent. Absence of anterior leaflet doming excludes the possibility of rheumatic mitral stenosis, and the presence of the supravalvular membrane was detected from the apical window. By using color Doppler imaging, identification of flow acceleration and
turbulence at the level of the annulus rather than the leaflet tips is an additional clue to distinguish a supravalvular ring from mitral valve stenosis. Continuous wave Doppler imaging can then be used to assess the severity of the obstruction (see Fig. 20.17D). The proximity of the membrane to the valve can lead to leaflet damage, the result of high-velocity turbulent flow. Leaflet thickening and mitral regurgitation may develop as a consequence. Caution must be used when diagnosing a supravalvular stenosing ring with echocardiography. Differentiating between a thickened and calcified mitral annulus and a stenosing ring may be difficult, leading to both false-positive and false-negative results. Associated anomalies are seen frequently with both cor triatriatum and supravalvular stenosis. Atrial septal defect and persistent left superior vena cava are especially common and are readily detected with echocardiography.


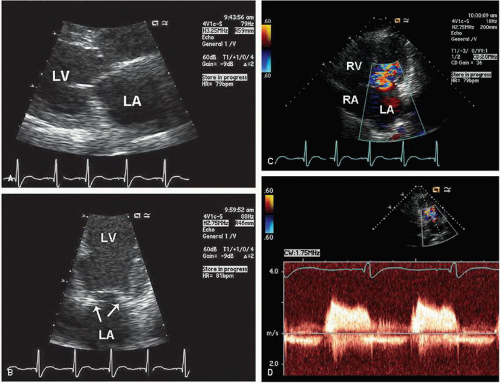
FIGURE 20.17. An example of Shone’s complex. A: Restricted mitral valve motion during diastole is present, but the stenosing ring is not visualized from this view. B: The restricted leaflet motion, as well as the presence of the fibrous ring (arrows) and its relationship to the mitral valve, is better seen from the apical four-chamber view. C: Color Doppler imaging demonstrates turbulent antegrade flow during diastole through the abnormal mitral valve. D: Continuous wave Doppler imaging demonstrates a significant pressure gradient across the mitral valve.


Mitral Valve

Congenital mitral stenosis is far less common than rheumatic mitral valve disease. Several anatomic variations exist (Table 20.4), and all can be diagnosed accurately with echocardiography. Because rheumatic mitral stenosis is so much more common in adults, however, the diagnosis of congenital mitral stenosis is often missed. Figure 20.18 is an example of a parachute mitral valve. In this condition, all the chordae insert into a single, large papillary muscle (hence the term “parachute”). The parasternal short-axis view is most helpful in determining the number, size, and location of the papillary muscles. The long-axis view reveals deformity and thickening of the mitral valve, restricted leaflet excursion, and chordal thickening and fusion. Because many of these features are common to rheumatic mitral valve disease, proper diagnosis is sometimes difficult and relies on detecting the presence of a single papillary muscle. The degree of stenosis is variable and is best assessed with Doppler imaging (Fig. 20.19). Because the inflow jet is often eccentric, color flow mapping is helpful for proper orientation of the Doppler beam. A supravalvular stenosing ring may coexist, thereby complicating the Doppler assessment.

Other congenital forms of mitral stenosis include anomalous mitral arcade and double-orifice mitral valve. In arcadetype mitral stenosis, the chordae insert into multiple small papillary muscles. Both stenosis and regurgitation are possible. Double-orifice mitral valve occurs because of duplication of the mitral orifice with or without fusion of subvalvular chordal structures. Usually, all the chordae associated with each orifice insert into the same papillary muscle, a situation similar to parachute mitral valve. The diagnosis is made by visualization of two separate orifices in the short-axis view (Fig. 20.20). The presence and severity of stenosis are variable in this condition. Other forms of congenital mitral valve pathology, including mitral valve prolapse and cleft mitral valve, are discussed elsewhere.


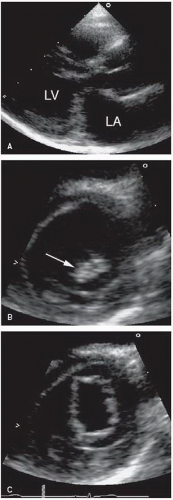
FIGURE 20.18. An example of parachute mitral valve. A: The long-axis view reveals thickened mitral leaflets that dome in diastole. B: A short-axis view at the midventricular level demonstrates the chordae converging on a single papillary muscle (arrow). C: The orifice of the abnormal mitral valve is shown from the short-axis view. Although the orifice is large, a mild degree of subvalvular gradient was present.


Abnormalities of Right Ventricular Outflow


Right Ventricle

Narrowing of the right ventricular outflow tract can occur on several levels, and obstruction may be present at multiple sites within an individual patient. Subvalvular pulmonary stenosis usually involves the infundibulum and is less common than valvular stenosis. Infundibular pulmonary stenosis may be the result of discrete fibromuscular narrowing or hypertrophied subvalvular muscle bundles (also called doublechambered right ventricle) (Fig. 20.21). In many cases, a ventricular septal defect is also present. Right ventricular outflow tract narrowing is occasionally secondary to stenosis at a more distal level. For example, valvular pulmonary stenosis may lead to right ventricular hypertrophy, the development of subvalvular muscle bundles, and subsequent outflow tract narrowing.


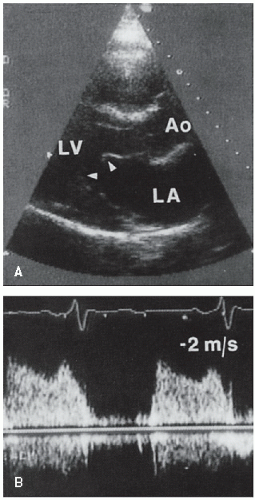
FIGURE 20.19. Parasternal long-axis view (A) and continuous wave Doppler recording of mitral inflow (B) from a child with a parachute mitral valve. The echocardiogram reveals a thickened mitral valve with restricted leaflet mobility and chordal fusion (arrowheads). The left atrium is dilated. Color flow imaging revealed a turbulent and anteriorly directed jet. Continuous wave Doppler imaging demonstrates significantly increased inflow velocity and a prolonged pressure half-time consistent with mitral stenosis.

Two-dimensional echocardiography is well suited to the evaluation of the right ventricular outflow tract. The parasternal short-axis and the subcostal four-chamber views are ideal for assessing the complex geometry of this region and for determining the level and severity of stenosis. The use of Doppler imaging to measure the pressure gradient may be challenging, however. Orienting the ultrasound beam parallel to the outflow tract jet requires considerable effort and the use of all available windows. Furthermore, localization of the site of stenosis may be difficult if narrowing occurs at more than one level. Typically, subvalvular stenosis is a dynamic form of obstruction with maximal velocity occurring in late systole, a pattern that is analogous to the outflow jet seen in hypertrophic cardiomyopathy. The magnitude of reduction in pulmonary artery flow can affect development of the pulmonary arteries, which can be an important factor in surgical planning. Therefore, an evaluation of children with any form of right ventricular outflow tract obstruction should include an assessment of the pulmonary arteries. This includes patients with tetralogy of Fallot, in whom the type and timing of surgical repair are determined in part by the size of the pulmonary arteries.


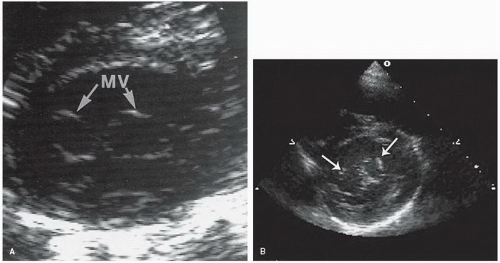
FIGURE 20.20. Parasternal short-axis views from two patients with double-orifice mitral valve (MV).


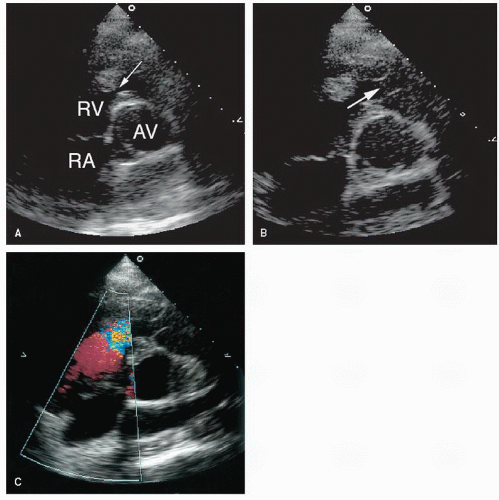
FIGURE 20.21. A series of short-axis images demonstrate infundibular right ventricular narrowing. A: Note the presence of muscle bundles in the area of the right ventricular outflow tract (arrow). B: The relationship of the subvalvular narrowing to the pulmonary valve (arrow). C: Color Doppler imaging demonstrates turbulence in this area. Dynamic subvalvular stenosis is present with a late-peaking gradient. AV, aortic valve.


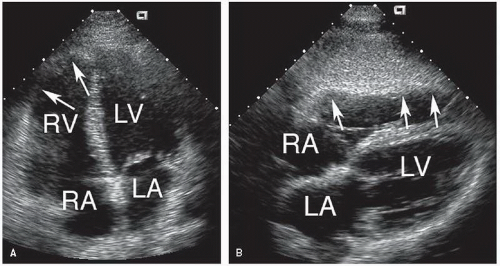
FIGURE 20.22. Extensive right ventricular involvement in a patient with arrhythmogenic right ventricular cardiomyopathy/dysplasia. A: The apical four-chamber view demonstrates dilation of the right ventricle and hypokinesis of the right ventricular free wall (arrows). B: A subcostal view reveals segmental right ventricular dysfunction in some aneurysmal dilation near the apex (arrows).

A rare congenital abnormality of the right ventricle is arrhythmogenic right ventricular cardiomyopathy (Fig. 20.22). This condition is characterized by dysplasia of the right ventricular myocardium, the extent of which varies considerably. Functionally, the dysplastic myocardium results in a form of right ventricular cardiomyopathy with decreased contractility and a propensity for ventricular arrhythmias. A spectrum of echocardiographic findings exists, depending on the extent of involvement. Thinning and hypokinesis of the free wall are characteristic. The systolic dysfunction may appear regional or, in cases of extensive dysplasia, global. Associated valvular pathology is not a feature of this condition.


Pulmonary Valve

Stenosis of the pulmonary valve is a fairly common congenital lesion that may occur in isolation or in association with other cardiac defects. The most frequently encountered form is characterized by fusion of the cusps and incompletely formed raphae, resulting in a domelike structure with a narrowed orifice. Typically, the valve annulus is normal in size. With severe stenosis, right ventricular hypertrophy may lead to variable degrees of subvalvular narrowing.

In adults, the morphology of the stenotic pulmonary valve is best visualized in the parasternal short-axis plane through the base of the heart. With two-dimensional echocardiography, the cusps appear thickened, have decreased excursion, and dome in systole (Fig. 20.23). Poststenotic pulmonary artery dilation is frequently evident, but its presence does not correlate with severity. In most cases, right ventricular size and function are normal, and trabeculation of the right ventricular walls is increased (see Fig. 20.23A). Calcification of the valve is characteristic in adults, but not children, with this disorder. Less common, dysplasia of the pulmonary valve will cause valvular stenosis at birth due to myxomatous thickening of the leaflets (Fig. 20.24). When pulmonary stenosis is severe, evidence of right ventricular pressure overload will be present. The degree of septal flattening and right ventricular enlargement correlate roughly with the severity of stenosis. Figure 20.25 is an example of extreme right ventricular pressure overload secondary to severe valvular pulmonary stenosis.

Although two-dimensional echocardiography is essential for the morphologic diagnosis of pulmonary stenosis, the technique is limited for assessing the severity of obstruction. Neither the degree of cusp thickening nor the presence of right ventricular hypertrophy provides a quantitative measure of severity. Doppler imaging is the technique of choice to measure the severity of pulmonary stenosis. Using the modified Bernoulli equation, the peak instantaneous pressure gradient can be calculated (Figs. 20.23, 20.24 and 20.25). Several clinical studies have demonstrated an excellent correlation between Doppler imaging and catheterization-derived pressure gradients in patients with pulmonary stenosis. In most patients, optimal alignment of the Doppler beam with the stenotic jet uses the parasternal short-axis view. In some individuals, use of a lower interspace is necessary to better align with a superiorly directed jet. In patients with pulmonary artery dilation, anterior displacement of the valve precludes proper beam alignment from the parasternal window. In this situation, the subcostal or suprasternal approach is usually adequate. In children, particularly, the subcostal approach provides optimal beam alignment and permits detection of the maximal jet velocity.

In children with pulmonary stenosis, surgical valvotomy or balloon valvuloplasty is often performed to relieve the obstruction. After such interventions, Doppler echocardiography may be used for serial evaluation and to detect residual stenosis (Fig. 20.26). The magnitude of associated pulmonary insufficiency and abnormalities of right ventricular diastolic filling can also be assessed. In patients with combined valvular and infundibular stenosis, the presence of serial obstructions may result in overestimation by continuous wave Doppler imaging of the catheterization-derived pressure gradient.


Pulmonary Artery

Pulmonary artery stenosis (also referred to as peripheral or supravalvular pulmonary stenosis) can occur at any level and often involves multiple sites. Several morphologic forms exist, including discrete membranelike lesions, long tubular stenoses, and tubular hypoplasia. These anomalies frequently are associated with other congenital cardiac and extracardiac lesions (e.g., Williams syndrome). The ability to detect pulmonary artery stenoses with echocardiography depends on the location

of the lesions. Proximal lesions can be visualized from the parasternal short-axis window. Figure 20.27 is an example of peripheral pulmonary stenosis involving the right branch. In most such cases, the diagnosis is apparent from twodimensional echocardiographic imaging. Color Doppler imaging should be used to demonstrate turbulence and acceleration of flow within the stenotic segment. The echocardiographer must bear in mind, however, that a more common cause of turbulent flow within the main pulmonary artery is patent ductus arteriosus. More peripheral stenoses may be impossible to visualize, especially in older patients. In children, the subcostal four-chamber and the suprasternal views may permit detection of distal lesions. The diagnosis should be considered in a patient with unexplained right ventricular hypertrophy, particularly in the presence of a pulsatile proximal pulmonary artery.


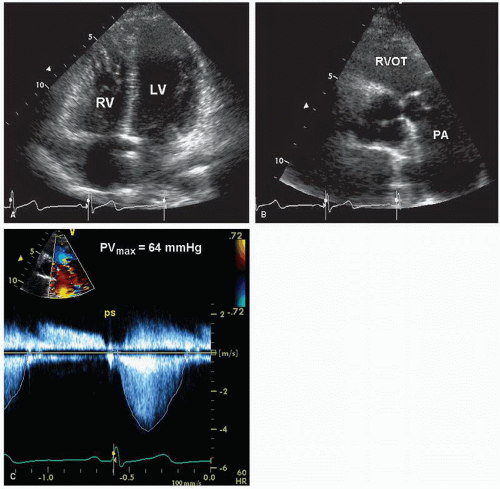
FIGURE 20.23. An example of valvular pulmonary stenosis. A: From the four-chamber view, the right ventricle is hypertrophied with normal systolic function. B: A basal short-axis view demonstrates doming and mild thickening of the pulmonary valve. C: Doppler imaging demonstrates a peak gradient of 64 mm Hg. AV, aortic valve; PA, pulmonary artery.


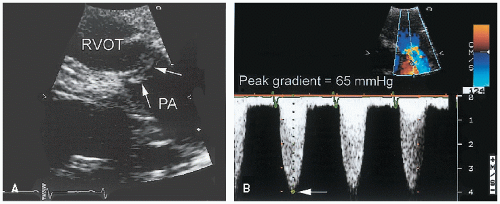
FIGURE 20.24. An example of dysplastic pulmonary valve stenosis. A: The pulmonary valve (arrow) is markedly thickened and immobile. Doming during systole is present. B: A maximal pressure gradient of approximately 65 mm Hg. PA, pulmonary artery.


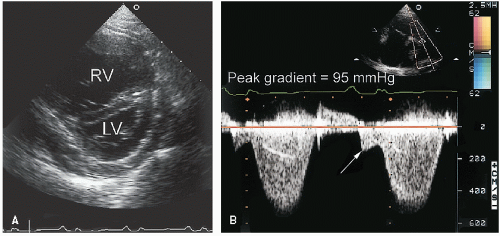
FIGURE 20.25. A: A patient with severe pulmonary stenosis demonstrates septal flattening with a dilated and hypertrophied right ventricle. These findings are consistent with right ventricular pressure overload. B: Severe pulmonary stenosis is confirmed with a maximal pressure gradient of approximately 95 mm Hg. Note the presence of presystolic flow through the pulmonary valve at the time of right atrial systole (arrow).


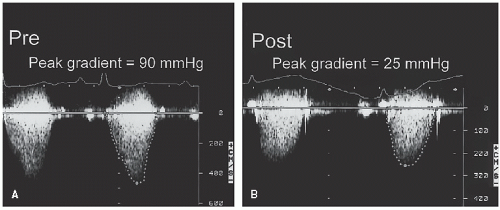
FIGURE 20.26. A case of pulmonary stenosis is shown before (Pre) (A) and after (Post) (B) valvuloplasty. The procedure resulted in a decrease in pulmonary valve gradient from 90 to 25 mm Hg.


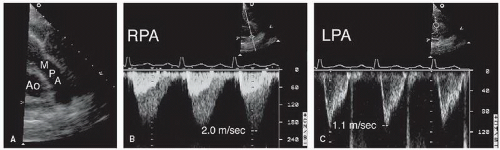
FIGURE 20.27. An example of pulmonary artery stenosis. A: The main pulmonary artery (MPA) appears normal. B: Flow through the right pulmonary artery (RPA) demonstrates increased velocity and acceleration. C: Normal flow velocity through the left pulmonary artery (LPA).


Abnormalities of Left Ventricular Outflow

Congenital abnormalities of left ventricular outflow usually involve obstruction of flow, and several important forms exist.


These lesions may be categorized as subvalvular, valvular, or supravalvular (which includes coarctation of the aorta) (Table 20.5). The subvalvular forms are heterogeneous and include hypertrophic cardiomyopathy, which is discussed in Chapter 19. The most important forms are the valvular lesions, which are common causes of stenosis in children (the unicuspid or congenitally stenotic aortic valve) and in adults (the bicuspid valve). The form of supravalvular obstruction encountered most frequently in the adult patient is coarctation of the aorta. This section includes a discussion of the lesions that occur at each of these different levels in order, but the focus is on those anomalies that are most common in adults.


Subvalvular Obstruction

Two types of subvalvular aortic stenosis are discussed here: the discrete form and the fibromuscular type of subaortic obstruction. Together, these lesions account for less than 20% of
all cases of left ventricular outflow obstruction in children and both are uncommon in adult patients. Discrete subaortic stenosis results from a thin, fibrous membrane or ridge that forms a crescentic barrier within the outflow tract just below the aortic valve. The membrane usually extends from the anterior septum to the anterior mitral leaflet. The degree of obstruction to flow is variable, and aortic regurgitation develops in approximately 50% of patients. With two-dimensional echocardiography, these membranes are seen as a discrete linear echo in the left ventricular outflow tract perpendicular to the interventricular septum. Because the membranes are parallel to the beam, recording these structures from the parasternal long-axis window may require the use of multiple transducer positions (Fig. 20.28). In many cases, the membranes are detected more easily from the apical views (where the ultrasound beam is oriented perpendicular to the structure) (Fig. 20.29). Transesophageal echocardiography has also been used in the assessment of patients with subvalvular obstruction. Doppler imaging plays an essential role in the evaluation of these patients. After the location and orientation of the jet are visualized with color flow imaging, continuous wave Doppler imaging can be used to estimate the peak pressure gradient across the membrane (Fig. 20.30). In the absence of aortic valve stenosis, this value correlates well with the catheterization-derived measure of obstruction. In the presence of multiple serial stenoses, however, Doppler imaging may overestimate the catheterizationmeasured gradient. The presence and severity of aortic regurgitation can also be assessed with Doppler techniques (Fig. 20.28). Figure 31 is an example of a subaortic membrane evaluated with transesophageal imaging. Note how the attachment of the membrane to the anterior mitral leaflet deforms the valve, especially during systole. M-mode echocardiography can also be helpful in assessing subvalvular obstruction (Fig. 31C). Midsystolic partial closure with reopening of the leaflets in late systole is indicative of a subvalvular pressure gradient.


Table 20.5 Classification of the Various Congenital Forms of Left Ventricular Outflow Tract Obstruction


Subvalvular


Discrete membranous stenosis


Fibromuscular tunnel


Hypertrophic obstructive cardiomyopathy


Valvular


Unicuspid


Bicuspid


Dysplastic


Supravalvular


Discrete (membranous or “hourglass”)


Aortic hypoplasia or atresia


Interrupted aortic arch


Coarctation of the aorta


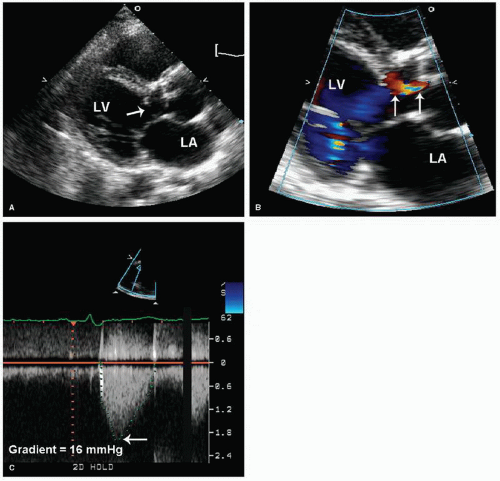
FIGURE 20.28. An example of subvalvular membranous aortic stenosis. A: The location of the membrane (arrow) and its proximity to the aortic valve is demonstrated from the parasternal long-axis view. B: As is often the case, some degree of aortic regurgitation is present as indicated by the white arrows. C: Doppler imaging demonstrates a peak gradient 16 mm Hg, excluding a significant degree of obstruction.


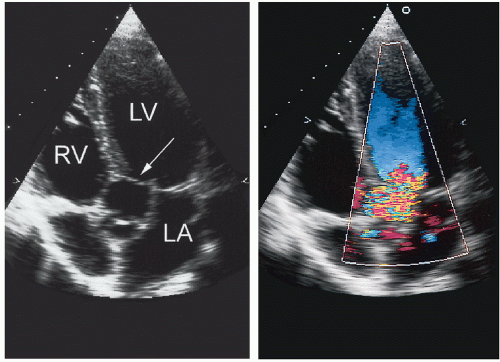
FIGURE 20.29. A: A subaortic membrane is readily apparent in this apical four-chamber view. B: The presence of the membrane results in turbulence in the left ventricular outflow tract, proximal to the aortic valve. This high-velocity, turbulent flow can result in damage to the aortic cusps.

Membranous subaortic stenosis is distinguished from a subaortic fibromuscular ridge or tunnel with two-dimensional echocardiography. Tunnel-type subaortic obstruction, rarely seen in adults, is characterized by diffuse thickening and narrowing of the left ventricular outflow tract with associated concentric left ventricular hypertrophy. A fibromuscular ridge may also obstruct the outflow tract (Fig. 20.30). This entity is similar to discrete membranous subaortic stenosis, but the obstruction is thicker and less discrete and appears more muscular. Figure 20.32 is an example of a fibromuscular ridge evaluated with transesophageal three-dimensional imaging. The improved spatial orientation provided by the three-dimensional technique allows a more complete characterization of the outflow tract and type of obstruction.


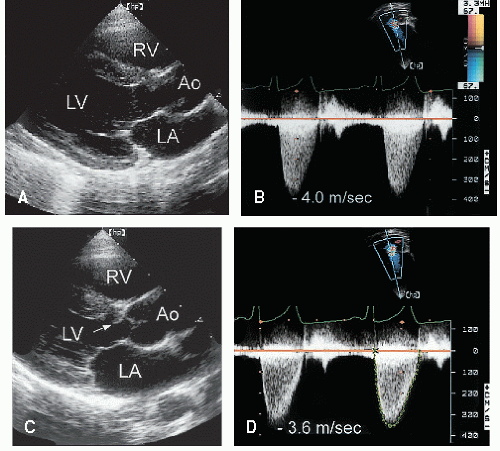
FIGURE 20.30. These two cases demonstrate the continuum between a discrete subaortic membrane and a fibromuscular ridge. A: A discrete membrane is demonstrated. Note how the membrane attaches to and deforms the base of the anterior mitral leaflet. A 60 mm Hg peak systolic gradient is confirmed (B). C: A fibromuscular ridge (arrow) in association with a membrane is located just below the aortic valve. In this patient, the peak gradient across the subvalvular obstruction is approximately 52 mm Hg (D).


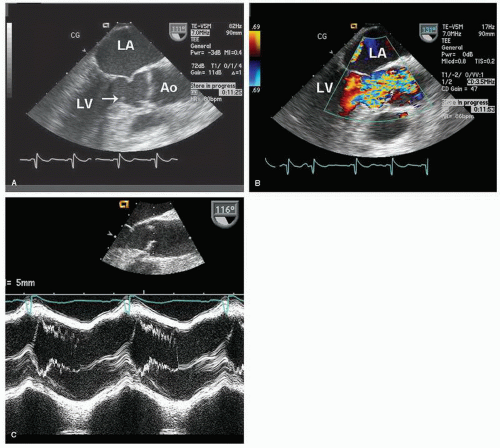
FIGURE 20.31. A subaortic membrane is demonstrated using transesophageal echocardiography. A: From a long-axis view, the membrane can be seen in the left ventricular outflow tract extending from the septum (arrow) to the anterior mitral leaflet. Note how the mitral leaflet is deformed by the attachment of the membrane. B: Color Doppler during systole demonstrates turbulent flow within the left ventricular outflow tract, beginning at the level of the membrane. C: With a subaortic membrane, M-mode echocardiography demonstrates the characteristic midsystolic partial closure and coarse fluttering of the aortic valve cusps.

These different forms of subaortic obstruction probably exist as a continuum, with a thin discrete membrane at one extreme and a diffuse tunnel at the other. Differentiating among individual cases may, therefore, be difficult and somewhat arbitrary. All these forms of subaortic obstruction are frequently associated with ventricular septal defects. Occasionally, other congenital cardiac anomalies are associated with subvalvular left ventricular outflow tract obstruction, including accessory mitral valve chordae, anomalous papillary muscle insertion, and abnormal insertion of the anterior mitral leaflet.


Valvular Aortic Stenosis

Aortic stenosis may be present at birth (a congenitally stenotic aortic valve) or may develop over time in a congenitally abnormal, but not stenotic, valve. In the former, the valve may be acommissural (resembling a volcano and more typical of pulmonary stenosis) or unicuspid unicommissural (with a slitlike orifice, resembling an exclamation point, Fig. 20.33). A bicuspid or tricuspid valve can also be stenotic at birth because of commissural fusion or dysplasia. Most often, such valves will be functionally normal at birth but gradually become stenotic over time because of progressive fibrosis and calcification. In other cases, degeneration of the valve leads to predominant aortic regurgitation. Quadricuspid valves are rare and have a similar natural history.

Bicuspid aortic valve is estimated to occur in 1% to 2% of the general population, making it the single most common congenital cardiac anomaly. As just noted, these valves often are functionally normal at birth (Fig. 20.34). Two-dimensional echocardiography plays a major role in detection of this entity. Direct visualization of the aortic cusps is possible from the parasternal short-axis view through the base of the heart. During diastole, the cusps of a normal tricuspid valve are closed within the plane of the scan and the commissures form a “Y” (sometimes referred to as an inverted Mercedes-Benz sign). A true bicuspid valve has two cusps of nearly equal size, two associated sinuses, and a single linear commissure. A raphe may be present and, if present, creates the illusion of three separate cusps. By observing valve opening in systole, however, the number of distinct cusps is apparent. Fusion of two of the cusps may create the appearance of a bicuspid valve, but the presence of three
distinct sinuses will establish this difference. Confirming the presence of a bicuspid aortic valve with echocardiography requires high-resolution images from the short-axis view for adequate visualization of valve morphology. A unicuspid valve has a single slitlike commissure, and the opening is eccentric and restricted. The stenotic tricuspid valve has three cusps with variable degrees of commissural fusion. Thus, an accurate assessment of functional anatomy requires an analysis of the number of apparent cusps, the degree of cusp separation, and a recording of their mobility and excursion during systole.


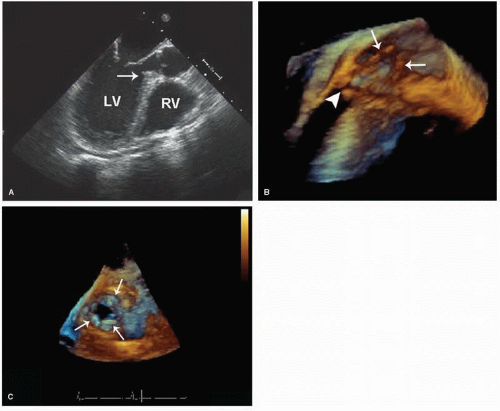
FIGURE 20.32. A transesophageal echocardiogram, using both two-dimensional and three-dimensional imaging, is recorded in a patient with a fibromuscular ridge. A: In the long-axis view, fibrous thickening of the basal septum, just below the aortic valve is indicated by the arrow. B: The same long-axis view is shown using three-dimensional imaging. The relationship between the aortic cusps (arrows) and the narrowed outflow tract (white arrowhead) is demonstrated. C: Recorded from a short-axis view just above the aortic valve, this three-dimensional echocardiogram illustrates the subaortic orifice located just below the aortic cusps (indicated by the three white arrows).

Whereas the short-axis view is useful for determining the number of commissures and the degree, if any, of commissural fusion, movement of the cusps out of the imaging plane during systole precludes accurate determination of the presence and severity of stenosis. In fact, normal systolic excursion of the bodies of the cusps recorded from the short-axis view may lead to underestimation of the severity of congenital aortic stenosis. Thus, the short-axis view is useful when evaluating aortic valve anatomy but should never be used to exclude the possibility of congenital aortic stenosis. The long-axis views have several advantages for this purpose. The thickness and excursion of the cusps can be assessed. Normally, they appear as thin, delicate structures that appear to open completely in systole and are aligned parallel to and against the aortic walls. With congenital aortic stenosis, the cusps are thickened and appear to dome during systole, the result of restricted motion of the tips relative to the more mobile bodies of the cusps (Fig. 20.35). A qualitative estimate of severity is possible, based on the thickness and immobility of the cusps, the extent of leaflet tip separation in systole, the degree of left ventricular hypertrophy, and the presence of poststenotic aortic root dilation.

Doppler imaging should be used to complete the noninvasive assessment of aortic stenosis and to provide a quantitative evaluation of severity. The apical, right parasternal, and suprasternal windows should be used to ensure that the maximal velocity is obtained. Then, through the use of the modified Bernoulli equation, the peak pressure gradient can be calculated. Both peak instantaneous and mean pressure gradients can be derived, and in children, the mean gradient is often used for clinical decision making. The values obtained with this approach correlate well with catheterization-derived gradients. Inherent differences exist between the two methods, and discrepancies should not necessarily be viewed as an error on the part of one or the other technique. In children especially, anxiety and increased activity during the examination will lead to an increase in flow velocity (both proximal and distal to the valve) and will thereby increase the measured pressure gradient. To calculate aortic valve area, the continuity equation can be used. It should be emphasized that the application of Doppler imaging to quantify aortic stenosis is similar in children and adults. The basic
principles underlying these applications are covered in detail in Chapters 9 and 11.


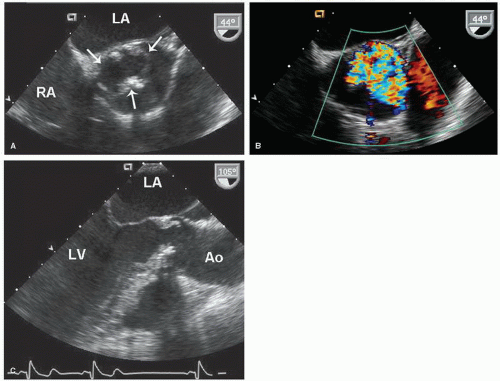
FIGURE 20.33. A unicuspid aortic valve is evaluated with transesophageal echocardiography. A: From a short-axis view, the eccentric, oval-shaped orifice is shown during systole (arrows). B: Color flow imaging demonstrates turbulent, eccentric antegrade flow. C: From a long-axis view, the systolic doming of the aortic valve is apparent.


Supravalvular Aortic Stenosis

The least common site for congenital aortic stenosis is in the supravalvular area. Three morphologic types of supravalvular aortic stenosis have been described: (1) fibromuscular thickening producing an hourglass-shaped narrowing above the sinuses (the most common form), (2) a discrete fibrous membrane in a normal-sized aorta, usually located near the sinotubular junction, and (3) diffuse hypoplasia of the ascending aorta, often involving the origins of the brachiocephalic arteries. Because of the presence of stenosis above the aortic valve and coronary ostia, two additional features often accompany these anomalies: (1) dilation of the coronary arteries, sometimes with ostial obstruction and (2) thickening and fibrosis of the aortic cusps, usually with an element of aortic regurgitation. Williams syndrome includes supravalvular aortic stenosis, elfin facies, mental retardation, and, occasionally, peripheral pulmonary stenosis. Isolated supravalvular aortic stenosis with or without
peripheral pulmonary stenosis may be inherited as an autosomal dominant trait.


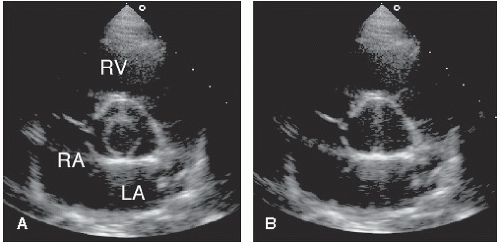
FIGURE 20.34. A bicuspid aortic valve is demonstrated from the short-axis view. The systolic frame (A) demonstrates a circular orifice. B: During diastole, a vertical commissure is seen between the two cusps.


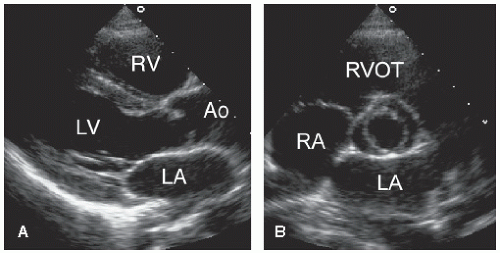
FIGURE 20.35. A functionally normal bicuspid aortic valve from a young patient. A: Long-axis view demonstrates doming of the valve in systole. B: Basal short-axis view confirms that the valve is bicuspid but with no evidence of stenosis.


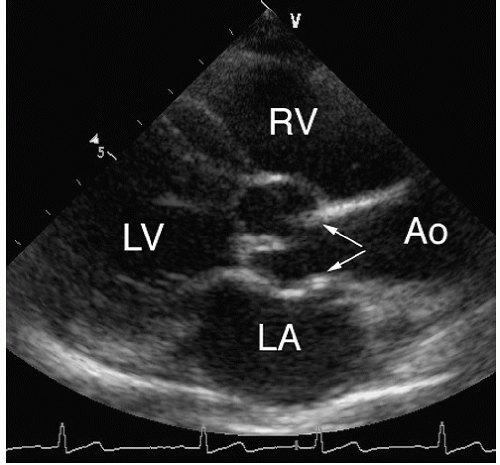
FIGURE 20.36. A child with supravalvular aortic stenosis. The narrowing begins at the sinotubular junction (arrows) and is associated with increased echogenicity of the vessel walls. (Courtesy of T. R. Kimball, MD, and S. A. Witt, RDCS.)

The parasternal long-axis view or a high right parasternal view is most helpful for diagnosing supravalvular aortic stenosis. In the normal aorta, the vessel diameter is greatest at the level of the sinuses. At the sinotubular junction, the diameter decreases slightly and approximates the size of the aortic annulus. With supravalvular aortic stenosis, an hourglass deformity occurs that is characterized by a segment of gradual tapering and then widening of the lumen (Fig. 20.36). The aortic walls usually appear thickened and echogenic. Aortic cusp fibrosis is often present, but poststenotic dilation of the ascending aorta is not a feature of this anomaly. A hypoplastic aorta is characterized by more diffuse and extensive narrowing with variable involvement of the branch vessels.

Assessing the severity of supravalvular aortic stenosis relies on two-dimensional echocardiography for accurate visualization of the magnitude and linear extent of the narrowing. Careful assessment of the aortic valve and the coronary arteries is an essential part of the evaluation of these patients. Proximal coronary artery dilation or ostial stenosis may be detected from the parasternal short-axis view at the base of the heart. Doppler imaging can be used to estimate the peak pressure drop across the site of aortic narrowing. In the presence of a discrete, isolated stenosis, the pressure gradient derived from Doppler imaging is an accurate reflector of severity. As noted previously, however, if the stenoses are multiple or tubular, the correlation between Doppler imaging and catheterization-derived gradients may be poor.


Coarctation of the Aorta

This relatively common condition is the result of localized narrowing of the descending aorta near the origin of the ductus arteriosus. The lesion consists of a ridgelike indentation of the posterolateral wall of the aorta resulting from thickening and infolding of the aortic media. It is typically located just distal to the origin of the left subclavian artery and the specific location may be “preductal” or “postductal” depending on the position of the ridge of tissue relative to the ductus (or ligamentum) arteriosus. It is often associated with other forms of congenital heart disease, especially bicuspid aortic valve and mitral valve malformations.

Echocardiographic detection of coarctation requires both an index of suspicion and careful recording of the descending aorta from the suprasternal window. In children, the evaluation of this portion of the aorta is relatively straightforward. In adults, however, the assessment can be technically demanding and both false-negative and false-positive results occur. The goal is to record the arch and descending aorta in the long axis from the suprasternal notch. False-negative results usually result from an inability to image the most distal portion of the arch (where the narrowing occurs). False-positive findings are the result of a tangential imaging plane through the vessel, creating the illusion of narrowing. The origins of the carotid and subclavian arteries serve as landmarks when localizing the juxtaductal area. The location of the left subclavian artery relative to the coarctation is an important factor in surgical management. If an area of stenosis is suspected, care should be taken to ensure proper beam alignment. If the aortic lumen can be seen beyond the narrowing, the likelihood of a false-positive result is reduced (Fig. 20.37). Dilation and exaggerated pulsation of the proximal aortic arch are further evidence of significant coarctation.

An example of coarctation of the aorta in an adult patient is shown in Figure 20.38. Note the location of a shelflike constriction just beyond the origin of the left subclavian artery. Dilation of the ascending aorta is also apparent. When two-dimensional echocardiographic imaging is diagnostic of (or suspicious for) coarctation, Doppler imaging should be performed to aid in the diagnosis and to provide an estimation of the pressure gradient. As a first step, color Doppler imaging can be used to detect acceleration and turbulence within the region of narrowing. The absence of Doppler evidence of acceleration and turbulence of flow should alert the examiner to the possibility of a false-positive two-dimensional echocardiographic result. Color Doppler imaging also permits more accurate alignment of the continuous wave Doppler beam. Figure 20.39 includes two examples of Doppler recordings of flow across an aortic coarctation. To estimate the peak pressure gradient, the Bernoulli equation can be used. When this equation is applied to aortic coarctation, however, it may be inappropriate to ignore the proximal aortic flow velocity. As a general rule, if this proximal velocity is less than 1.5 m/sec, it can be ignored and the simplified equation can be used. If it is greater than 1.5 m/sec, the expanded Bernoulli equation is necessary. In this way, a more accurate pressure gradient is obtained. The persistence of a high-velocity flow signal into diastole is another useful clue to the severity of the stenosis. A pressure gradient throughout the cardiac cycle indicates a more severe form of obstruction compared with a pressure gradient that is confined to systole (Fig. 20.40). In this example, color Doppler imaging reveals persistence of turbulent antegrade flow across the coarct. Then, the presence of a diastolic gradient is confirmed with continuous wave Doppler imaging. Because coarctation gradients are flow dependent, low-level exercise, usually in the form of leg lifts, can be performed to assess the response to stress. In many cases, exercise will not cause a significant increase in the peak gradient but will result in the development or increase in the diastolic gradient. In borderline cases, this response can be helpful in clinical decision making.

Although Doppler imaging is sensitive for the detection of coarctation, false-negative results can occur in the presence of a patent ductus arteriosus. Left-to-right runoff of blood flow through the ductus reduces the jet velocity through the coarctation and leads to an underestimation of the pressure gradient. This can also occur in the presence of welldeveloped collaterals. In such cases, the Doppler gradient will be an underestimation of the actual severity of obstruction.
False-positive results are even less common. Occasionally, a mild increase (1.5-2 m/sec) in descending aortic flow velocity will be misinterpreted as evidence of coarctation. In the absence of turbulence or echocardiographic evidence of vessel narrowing, this should generally be attributed to normal acceleration around the arch. Long-term follow-up after repair of aortic coarctation relies heavily on echocardiographic methods for the detection of restenosis. Estimation of the restenosis gradient by Doppler imaging is possible and correlates well with catheterization-derived values (Fig. 20.41).


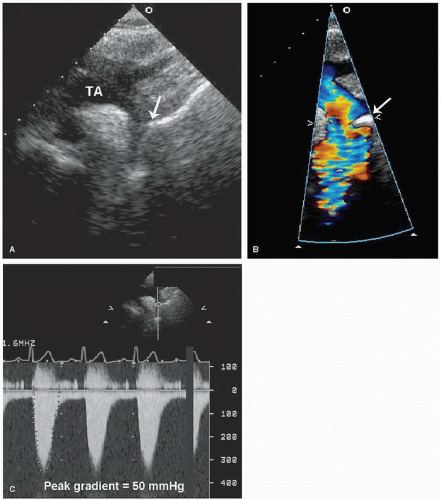
FIGURE 20.37. Coarctation of the aorta is evaluated from the suprasternal window. A: A long-axis view of the aortic arch suggests tapering of the descending aorta just beyond the origin of the left subclavian artery (arrow). B: Color flow imaging is useful to confirm turbulence and acceleration of flow at the level of the coarct (arrow). C: Then, continuous wave Doppler imaging is used to quantify the pressure gradient. In this case, a peak systolic gradient of 50 mm Hg was recorded. TA, transverse aorta.


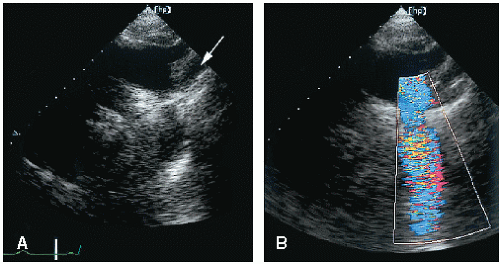
FIGURE 20.38. A: The location of the coarctation relative to the branch arteries. The left subclavian artery (arrow) is seen proximal to the site of obstruction. B: Color Doppler imaging demonstrates turbulence at the site of the coarctation.

Aortic atresia and interrupted aortic arch are severe and uncommon forms of left ventricular outflow obstruction. They may be diagnosed in utero or shortly after birth by using echocardiographic techniques. Interruption of the aortic arch may be thought of as an extreme form of coarctation. The length of the “missing” segment varies, as do the relative insertion sites of the arch vessels. With echocardiography, the diagnosis rests on visualization of the aortic arch as it abruptly terminates, and

it is usually best seen from the suprasternal window. A patent ductus arteriosus (usually large) will also be present. When aortic arch interruption is suspected, a careful search for a right aortic arch should be undertaken to avoid confusion between these two entities.


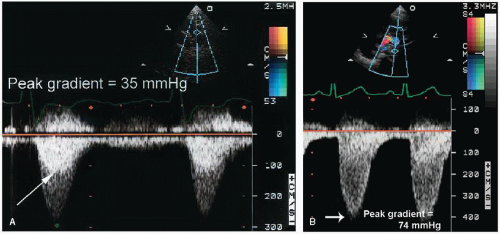
FIGURE 20.39. A: Continuous wave Doppler imaging demonstrates a peak systolic pressure gradient of 35 mm Hg across the coarctation. Superimposed within the systolic flow signal is a darker jet (arrow) that corresponds to flow proximal to the stenosis. Note the absence of flow during diastole. B: A more severe case of coarctation, with a peak gradient of 74 mm Hg. Note the persistence of low velocity flow throughout diastole.


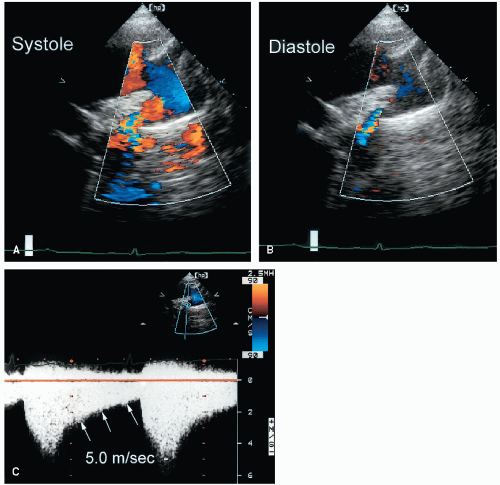
FIGURE 20.40. A case of severe coarctation of the aorta. Color Doppler images during systole (A) and diastole (B) demonstrate a high-velocity turbulent jet at the level of obstruction. The persistence of the jet throughout diastole is an indicator of its severity. C: Continuous wave Doppler imaging demonstrates a peak gradient of approximately 100 mm Hg. Note the persistence of the gradient throughout diastole (arrows).

Only gold members can continue reading. Log In or Register to continue

Stay updated, free articles. Join our Telegram channel

Jun 22, 2016 | Posted by in CARDIOLOGY | Comments Off on Congenital Heart Diseases

Full access? Get Clinical Tree

Get Clinical Tree app for offline access