Comparisons between transcatheter aortic valve implantation without replacement (TAVI) and tissue aortic valve replacement (AVR) in clinical trials might not reflect the outcomes in standard clinical practice. This could have important implications for the relative cost-effectiveness of these alternatives for management of severe aortic stenosis in high-risk patients for whom surgery is an option. The mean and variance of risks, transition probabilities, utilities, and cost of TAVI, AVR, and medical management derived from observational studies were entered into a Markov model that examined the progression of patients between relevant health states. The outcomes and cost were derived from 10,000 simulations. Sensitivity analyses were based on variations in the likelihood of mortality, stroke, and other commonly observed outcomes. Both TAVI and AVR were cost-effective compared to medical management. In the reference case (age 80 years, the perioperative TAVI and AVR mortality was 6.9% vs 9.8%, and annual mortality was 21% vs 24%), the utility of TAVI was greater than that of AVR (1.78 vs 1.72 quality-adjusted life years) and the lifetime cost of TAVI exceeded that of AVR ($59,503 vs $56,339). The incremental cost-effectiveness ratio was $52,773/quality-adjusted life years. Threshold analyses showed that variation in the probabilities of perioperative and annual mortality after AVR and after TAVI and annual stroke after TAVI were important determinants of the favored strategy. Sensitivity analyses defined the thresholds at which TAVI or AVR was the preferred strategy with regard to health outcomes and cost. In conclusion, TAVI satisfies current metrics of cost-effectiveness relative to AVR and might provide net health benefits at acceptable cost for selected high-risk patients among whom AVR is the current procedure of choice.
Aortic stenosis (AS) is 1 of the most frequently encountered cardiovascular diseases and has great socioeconomic burden; without valve replacement, symptomatic patients with severe AS have a mortality >70% within a few years of symptom onset. Transcatheter aortic valve implantation without replacement (TAVI) is more effective than standard medical management in patients who are unsuitable for surgery because of age and co-morbidities. In patients of high, but not prohibitive, surgical risk, TAVI appears to provide similar outcomes to those of surgical aortic valve replacement (AVR), as demonstrated by the Placement of Aortic transcatheter Valve (PARTNER) cohort A, and a recent analysis from this randomized controlled trial estimated the incremental cost-effectiveness of TAVI versus AVR. Because variations in the apparent effect of TAVI can be modulated by the prevalence and effect of co-morbid disease, stricter inclusion/exclusion criteria in this circumstance could lead to potential inflation of the relative benefit. Therefore, despite the risk of selection bias, prospective, registry data could provide additional insights to randomized studies. We sought to perform a cost analysis of TAVI and AVR strategies using a decision-analytic model informed by existing registry data, with the goal of further defining a practical role for TAVI in a setting in which surgical intervention is currently the standard of care.
Methods
The present decision-analytic model evaluated the outcomes and costs inherent in transfemoral TAVI with the Edwards SAPIEN valve (Edwards Lifesciences, Irvine, California) and tissue AVR for the treatment of high-risk patients with severe AS. We informed our decision-analytic model using TAVI and AVR registries of high-risk patients, defined by a logistic European system for cardiac operative risk evaluation >15% and/or Society of Thoracic Surgeons score >10% ( Table 1 ).
| Variable | AVR | TAVI | p Value |
|---|---|---|---|
| Patients (n) | 1,199 | 747 | |
| Age (years) | 77 ± 4 | 82 ± 1 | <0.001 |
| New York Heart Association functional class III-IV (%) | 90 ± 7 | 86 ± 9 | 0.07 |
| Ejection fraction (%) | 50 ± 4 | 54 ± 2 | 0.37 |
| Logistic European system for cardiac operative risk evaluation (%) | 21 ± 9 | 26 ± 1 | <0.001 |
| Society of Thoracic Surgeons score (%) | 14 ± 2 | 9 ± 2 | <0.001 |
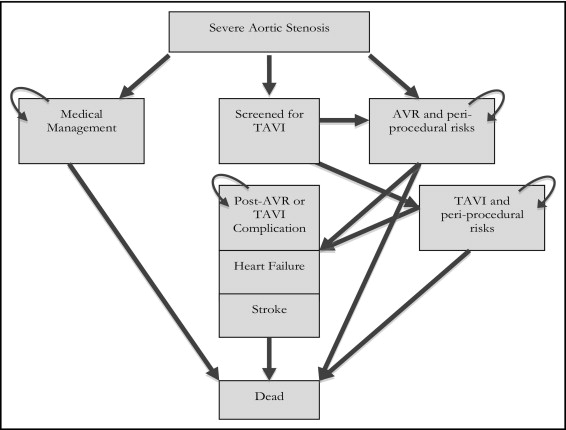
A Markov model with Monte Carlo simulations was developed using standard commercial software (TreeAge Pro 2008, TreeAge, Williamstown, Massachusetts) to study a hypothetical cohort of 10,000 patients through a number of health states that arose as consequence of TAVI, AVR, or medical management ( Figure 1 ) . The model estimated the quality-adjusted life years (QALYs) and lifetime cost to permit examination of the incremental cost-effectiveness ratio (ICER) of the technique with the most favorable outcomes. Discounting (at 5% annually) was used to compare the present and future outcomes, estimated in 2011 American dollars. The cycle length was assumed to be 1 year. The patients had a mean initial age of 80 years, and the rest of life was simulated.
All patients entered the model with severe AS and were deemed candidates for AVR. Data on the transitions between health states and outcomes were obtained from published reports, using weighted averages and standard deviations ( Table 2 ). Although medical management would be unsuitable for these patients, we included it in the model to define the incremental cost-effectiveness of both intervention types. There are limited data that reflect the transitions in operable patients who receive medical treatment. We used data from a registry that compared the outcomes of patients offered intervention with AVR or TAVI versus medical management. Given the limited data for the medical management arm, these transitions were subject to sensitivity analysis.
| Variable | AVR | TAVI | Medical Management |
|---|---|---|---|
| Perioperative events | |||
| Death (%) ⁎ | 9.8 ± 3.6 | 6.9 ± 3.7 | 15.4 |
| Transcatheter aortic valve implantation access site complications (%) | — | 21.8 ± 6.7 | — |
| Perioperative stroke (%) | 2.7 ± 0.8 | 4.0 ± 0.9 | — |
| Follow-up events | |||
| Death (%) | 24.3 ± 5.6 | 21.2 ± 2.3 | 55.1 |
| Heart failure (%) | 11.3 | 100 | |
| Postoperative stroke (%) | 2.1 ± 0.7 | 7.0 | — |
| Postaortic valve replacement/transcatheter aortic valve implantation complications (%) † | 4.8 ± 0.7 | — | |
| Reoperation (%) | 0.24% | 1.16 ± 1.39 | — |
| Complication mortality ‡ | |||
| Transcatheter aortic valve implantation access site complications (%) | — | 11.8 | — |
| Postaortic valve replacement/transcatheter aortic valve implantation complications (%) | 25.9 | — | |
| Stroke, perioperative (%) | 11 ± 2 | — | |
⁎ Assumed to be 30-day mortality in medical management group.
† Complications included endocarditis, hemorrhage, valve thrombosis, and noncerebral.
‡ Annual mortality related to stroke and heart failure was assumed the same as that after AVR, thromboembolism, or TAVI.
Given the patient age and co-morbidities, mechanical AVR was not considered. As with existing registries, only a proportion of patients who underwent workup would proceed to TAVI. The proportion of patients evaluated for TAVI and then found unsuitable for implantation would include those converted to AVR.
Because the AVR group was significantly younger ( Table 1 ) and age has a significant influence on follow-up mortality of the AS population, we used expected age-specific mortality to adjust annual mortality to the same age. This process increased annual mortality after AVR by 3.3%.
Given the substantial mortality of the post-AVR and post-TAVI groups without heart failure, those with heart failure were assessed as having the same mortality as their counterparts without heart failure. Patients in the medical management group were assumed to have heart failure, given their predefined high-risk status.
Stroke is defined as any new temporary or permanent, focal or global neurologic deficit, as described in published guidelines. Given the substantial mortality of the post-AVR and post-TAVI groups without stroke, the patients with stroke were assessed as having the same mortality as their counterparts without stroke. Moreover, given the high annual mortality in the medical management group, the effect of stroke with regard to both cost and quality of life would be minor. Therefore, we did not include the risk of stroke in the medical management group in our analysis of outcomes.
The risk of post-AVR complications was estimated using linearized event rates noted in a large registry of AVR recipients. These particular complications have not been adequately assessed in the TAVI population. Thus, we assumed that tissue AVR and TAVI, both of which are tissue valves, have similar postprocedure complication rates. Mortality related to post-AVR complications was assessed using a weighted average of the data in a meta-analysis studying prognosis after bioprosthetic AVR.
Given overlap between bleeding and vascular complications in published reports, they were assessed as a singular complication. The mortality of vascular complications was derived from that mentioned in the 1-year outcomes of the Edwards SAPIEN aortic bioprosthesis European outcome (SOURCE) Registry. Unlike post-AVR/TAVI complications, access site complications were assumed to occur only in the first cycle after TAVI.
TAVI patients undergoing valve replacement underwent only repeat TAVI. The reoperation rate for AVR and TAVI was anticipated to follow a previously described Weibull distribution for tissue valves.
Information regarding health outcomes was obtained from published reports, with utilities defined in Table 3 . Utility weights were multiplied by the duration in each health state to calculate the QALYs. Utility was age-adjusted, declining by 0.3%/year of age. We applied a 10% reduction in utility for AVR from that predicted of an age-matched population, independent of the post-AVR complications previously described.
| Health State | Utility value |
|---|---|
| Heart failure | 0.67 ± 0.01 |
| Stroke | 0.46 ± 0.01 |
| After aortic valve replacement | 0.69 based on 10% disutility |
| After transcatheter aortic valve replacement | 0.62 ± 0.31 |
| Medical management | 0.57 ± 0.32 |
| Transcatheter aortic valve replacement access site complications | −1 QAL week |
| Postaortic valve replacement/transcatheter aortic valve replacement complications | 0.67 ± 0.01 ⁎ |
⁎ Assumed to be similar to that of New York Heart Association functional class II and III.
We implemented the utility weight from the Cardiovascular Outcomes Research Consortium measured with EQ-5D in New York Heart Association functional class II and III patients with heart failure. Given that our population is significantly older than the population assessed by this consortium, this utility value was subject to sensitivity analysis.
The utilities of stroke survivors vary widely. Based on a comprehensive systematic review, we used a utility for disabling stroke derived from time tradeoff and standard gamble methods. In this decision-analytic model, patients with stroke could not proceed to reoperation.
The utility of the medical management group was assessed as being equivalent to the pre-TAVI EQ-5D assessment in the European PARTNER transcatheter heart valve study. Post-TAVI utility was assessed with EQ-5D in the European PARTNER transcatheter heart valve study.
We used the utility from access site complications that was previously assumed in evaluation of the cost-effectiveness of coronary artery stenting. Utilities regarding postprocedural complications, aside from stroke, are not well established. For the purposes of the present analysis, this utility was deemed equivalent to that of heart failure.
The analysis took the perspective of the healthcare provider and, consequently, used the amount reimbursed to the provider as the cost of care. Information regarding costs was obtained primarily from published reports, including diagnostic related groups and Medicare payments for current procedural terminology codes ( Table 4 ).
| Health State | Mean Cost (US$) |
|---|---|
| Heart failure (yearly costs after diagnosis) | 10,832 |
| Stroke | |
| Acute treatment | 14,155 ± 453 |
| Annual follow-up costs | 14,561 ± 14,690 |
| Transcatheter aortic valve implantation | 49,106 ± 1,283 |
| Cost of additional workup | 374.35 ± 500 |
| Annual follow-up costs | 336.41 ⁎ |
| Aortic valve replacement | 49,106 ± 1283 |
| Annual follow-up costs first 5 years | 99.01 † |
| Annual follow-up costs thereafter | 336.41 ⁎ |
| Medical management (yearly costs after diagnosis) | 10,832 |
| Transcatheter aortic valve implantation access site complications | 3,392.60 ± 1,000 |
| Postaortic valve replacement/transcatheter aortic valve implantation complications (yearly costs) | 300 |
⁎ Follow-up costs for transthoracic echocardiogram plus 1 outpatient visit.
The weighted national estimates from the Healthcare Cost and Utilization Project nationwide inpatient sample 2011 were used to identify the costs associated with AVR. The International Classification of Diseases, 9th revision, procedure codes were used to identify the costs associated with procedures. AVR patients were assessed as having follow-up costs resembling standard clinical practice.
We assumed that payers would provide reimbursement for TAVI in an identical fashion to that for AVR, and we constructed the base case scenario with equivalent costs of implantation and ensuing hospitalization. Given the assumption that the patients in the medical management group would incur outcomes similar to those of the heart failure population, according to the severity of AS in a high-risk group, these patients incurred the costs related to heart failure.
The costs of heart failure include the cost of procedures and provider visits. The cost for the acute treatment and follow-up of perioperative stroke was as defined from the Healthcare Cost and Utilization Project data and a study of Medicare beneficiaries. The average cost of access site complications related to TAVI was approximated from a cost-minimization analysis of a vascular closure device after percutaneous coronary intervention. The average annual cost of post-AVR and post-TAVI complications was based on a weighted average of the relative incidence of these complications starting at age 80 years.
One-way sensitivity analyses were performed to identify the critical sources of variation in the input data. Probabilistic sensitivity analyses were performed from the Markov model using a Monte Carlo analysis. Beta distributions were assigned to probabilities and utility weights, and gamma distributions were assigned to the costs according to the standard errors derived from associated published reports.
The mean and 95% confidence intervals for each of the posterior distributions were computed on the basis of 10,000 iterations. Cost-effectiveness acceptability curves were constructed from the simulations. An ICER of ≤$100,000/QALYs gained was used as the willingness-to-pay threshold of acceptable cost-effectiveness.
Results
In the reference case (age 80 years, transition probabilities and outcome rates as cited in Table 2 , 50% suitability for TAVI after screening), the lifetime costs of TAVI and AVR were greater than those with medical management, although the outcomes of TAVI and AVR were greatly superior to those of medical management. The cost-effectiveness ratio of TAVI and AVR was $39,964/QALYs and $39,280/QALYs, respectively. The use of TAVI is associated with a QALY gain of 0.06 compared to AVR after adjustment and discounting (expected QALYs after TAVI and AVR of 1.78 and 1.72, respectively; Table 5 ). However, the cost of TAVI was greater than that of AVR ($59,503 vs $56,339), yielding an ICER of $52,773/QALYs.


