Lower Extremities Vasculature
Tim Leiner
Dominik Fleischmann
Neil M. Rofsky
Introduction
Spectrum and Prevalence of Diseases
Atherosclerotic Peripheral Arterial Occlusive Disease
The vast majority (>80%) of lower extremity arterial disease is due to atherosclerotic peripheral arterial occlusive disease (APAOD). APAOD is a major health care problem in Western society with an estimated prevalence in the general population of 2.5% in persons over 50 years of age. In persons over 70 years of age, the prevalence is estimated at about 7% (1).
Patients who have complaints of APAOD usually present with a history of intermittent claudication. This term is derived from the Latin claudicatio and means “to limp.” Intermittent claudication is caused when blood flow to exercising leg and calf muscles is insufficient compared to metabolic demands. Significant disease in the aortoiliac arteries (Fig. 21-1) typically leads to cramping and pain in buttocks and thighs, while more distally located disease (e.g., tibioperoneal occlusive disease) is often associated with cramping in the foot. Upon cessation of exercise, complaints usually disappear rapidly. The clinical course of intermittent claudication in terms of progression of disease in the symptomatic limb is usually benign since only about a quarter of patients will ever significantly deteriorate (1). With an intervention rate of approximately 5%, only 1% to 3% of all patients with intermittent claudication will ever undergo a major amputation (1).
About 5% or less of patients with intermittent claudication progress to chronic critical ischemia, that is, the oxygen and nutrient supply of the distal lower extremity fall below the level for maintenance of normal cellular processes in resting conditions. Clinically, this is manifested by rest pain and tissue loss (i.e., nonhealing ulcers and gangrene).
The incidence of chronic critical ischemia is estimated to be between 300 and 1,000 per million per year in the general population (1). Because of the severity of complaints, an invasive intervention is attempted in all but the worst cases. Despite advances in endovascular and vascular surgical therapy, however, the rate of major amputation in the general population remains in excess of 0.03% in industrialized countries (2).
Table 21-1 Clinical Categories of Peripheral Arterial Occlusive Disease Severity According to Fontaine | ||||||||||||||||||||||||||||
|---|---|---|---|---|---|---|---|---|---|---|---|---|---|---|---|---|---|---|---|---|---|---|---|---|---|---|---|---|
| ||||||||||||||||||||||||||||
 Figure 21-1 Proximal stenosis in a claudicant. This MIP image from a 3D gadolinium-enhanced MR angiogram shows a single focal high-grade stenosis in the distal, left common iliac artery (arrow) in this patient with left buttock claudication. |
The diagnosis of APAOD is made on the basis of the typical history, physical examination (palpation of arterial pulsations), and measurement of the ankle-brachial index (ABI) (1,3). The severity of APAOD is commonly classified according to Fontaine (Table 21-1). More recently, the Society for Vascular Surgery and the International Society for Cardiovascular Surgery introduced a classification, named after Rutherford, that also incorporates hemodynamic and performance criteria (4) (Table 21-2).
Table 21-2 Clinical Categories of Peripheral Arterial Occlusive Disease Severity According to Rutherford | |||||||||||||||||||||||||||||||||||||||||||||
|---|---|---|---|---|---|---|---|---|---|---|---|---|---|---|---|---|---|---|---|---|---|---|---|---|---|---|---|---|---|---|---|---|---|---|---|---|---|---|---|---|---|---|---|---|---|
| |||||||||||||||||||||||||||||||||||||||||||||
When a patient presents to the general practitioner or the vascular surgeon with complaints of APAOD, the first-line treatment consists of modification of obvious cardiovascular risk factors such as smoking, hypertension, hypercholesterolemia, and the institution of exercise training (5,6,7). Generally, options for invasive intervention are considered when complaints become too limiting to pursue ordinary activities.
For patients with intermittent claudication, the decision to intervene is largely dependent on relative criteria (patient and surgeon preference), but for patients with chronic critical ischemia, the need to intervene is more urgent since tissue perfusion does not meet basic metabolic demands, even at rest.
Although only a small minority of patients with APAOD eventually undergo invasive treatment, the estimated annual number of percutaneous and surgical procedures performed for PAOD in the United States alone was over 100,000 in 1986, with sharp increases expected (8), illustrating the large scope of the problem and impact on people’s lives.
In contrast to the gradual course of disease perceived with intermittent claudication and chronic critical ischemia is the entity of acute limb ischemia. Acute limb ischemia denotes a sudden and rapid decline in limb perfusion, usually producing new or worsening signs and symptoms; often, limb viability is threatened. In patients with APAOD, acute limb ischemia is most often caused by either an embolus or thrombosis. The severity of acute limb ischemia depends on the location and extent of occlusion and the degree to which pre-existing collaterals can be recruited (1).
Other Causes of Peripheral Arterial Disease
Approximately 20% of chronic arterial occlusions are based on diseases other than atherosclerosis that cause luminal narrowing and/or occlusion. The presence, location, and progression of arterial stenoses and occlusions may reflect an underlying systemic disease or may be an expression of regional inflammatory or degenerative processes.
Lower extremity arterial diseases other than APAOD include aneurysmal disease, popliteal entrapment syndrome, cystic adventitial disease, arterial fibrodysplasia, nonspecific aortoarteritis (Takayasu disease), and a host of uncommon vasculitides, the most important of which is thromboangiitis obliterans (Buerger’s disease) (9). In addition, congenital connective tissue diseases such as Marfan syndrome, Ehlers-Danlos syndrome, pseudoxanthoma elasticum, homocystinuria, and neurofibromatosis may have peripheral arterial involvement.
Congenital and acquired clotting disorders may also manifest themselves with symptoms of peripheral arterial disease. Rare causes of peripheral arterial disease are primary tumors, radiation therapy, and the iliac syndrome in cyclists. An acute arterial occlusion always necessitates a prompt search for atrial fibrillation, ulcerative endocarditis, and mural thrombi overlying the site of myocardial infarction.
Global View of Unique Aspects and Considerations of Imaging of Coronary Arteries
Given the predominance of APAOD in lower extremity vascular disease, the role of imaging is often one of delineating the anatomy in preparation for an endoluminal (e.g., stent/angioplasty) or surgical (e.g., bypass graft) intervention and to assess whether options for such interventions are feasible. These considerations are well served when information about the number, length, and severity of vascular lesions is accurately detailed (10).
Conventional angiography with the use of iodinated contrast media and, in particular, intra-arterial digital subtraction angiography (IA DSA) has long served as the reference in this regard. However, magnetic resonance angiography (MRA) and computed tomographic angiography (CTA) have emerged as compelling alternatives. The relatively noninvasive nature of these techniques avoids the definable risks associated with catheter-related complications (10,11).
Because both techniques are able to provide an accurate “road map” of the peripheral vasculature, the referring clinician can confidently inform patients that either an angiogram should be performed and percutaneous transluminal angioplasty (PTA) carried out at the same time or, conversely, that the disease is too diffuse and long-segmented or that an occlusive lesion is present that requires a more extensive or complex procedure such as aortofemoral bypass. Some patients, as well as some surgeons, will only be interested in treatment if angioplasty is possible. The use of noninvasive angiography can spare those patients who are not angioplasty candidates and those who do not desire major reconstructive surgery the risks of intra-arterial angiography for diagnostic purposes.
At the other end of the clinical spectrum are patients with chronic critical ischemia. Many of these patients suffer from multilevel disease such as stenoses and obstructions in inflow (aortoiliac) and outflow (femoropopliteal and lower leg) arteries. In patients with chronic critical ischemia, the primary aim is to provide sufficient blood flow to relieve rest pain and heal skin lesions. This can be achieved by PTA and/or arterial reconstructive bypass surgery (12).
The ability to successfully bypass stenoses and obstructions of the lower leg and to perform distal anastomoses of bypass grafts to arteries around the ankle or in the foot has important implications for limb salvage (13). In contradistinction to patients with intermittent claudication, imaging outflow arteries is therefore an essential part of the imaging workup and potentially limb-saving in patients with chronic critical ischemia, particularly when it is taken into account that IA DSA is known to fail in visualizing patent crural and foot arteries, which are demonstrated with other modalities (14,15,16).
The anatomic coverage from the infrarenal aorta down to the pedal arch in the feet in an average patient demands well over 100 cm and encompasses a wide range in the course and caliber of the relevant vessels. The advent of multistation CE MRA imaging protocols and the introduction of multidetector (MD) row CT scanners allows for the routine and successful acquisition of the complete peripheral vascular tree.
What Do Computed Tomography and Magnetic Resonance Bring over Other Imaging and Nonimaging Diagnostic Testing?
In the diagnostic workup of patients with peripheral arterial disease, physical signs and symptoms often guide the clinician toward a diagnosis and suggest the likely disruption of the disease. The battery of available diagnostic tests can often add substantial insights to the disease. Ultimately, an accurate portrayal of the vasculature best guides the treatment management while providing a set of alternatives in the event of complications during the therapeutic intervention.
The available diagnostic tests can be divided into those aimed at a physiological assessment of the peripheral circulation and those aimed at providing an anatomical road map of the peripheral vasculature, showing the exact location, extent, and severity of the disease process in relation to commonly used anatomical landmarks during interventional radiological and surgical procedures. Table 21-3 provides an overview of these techniques.
Duplex ultrasonography (DU) with color flow is often used to gauge the extent and severity of peripheral arterial disease. This test combines a local anatomical image, obtained in B-mode, with information about the direction, pattern, and magnitude of arterial and venous flow (obtained by Doppler frequency analysis) (17). The severity of stenoses can be derived from peak systolic and end-diastolic velocity measurements, whereby higher peak systolic velocities indicate more severe stenoses (18). Major drawbacks of DU are the long duration of the examination, the operator dependency (19), and the limited ability to ensure that the anatomic coverage is complete. Experienced vascular laboratories with rigorous quality controls are needed for reliable characterization of vascular disease with DU.
Relative to DU, both MD CTA and CE MRA excel in their ability to provide images of the peripheral vascular tree analogous to intra-arterial digital subtraction techniques (20,21). Furthermore, the truly three-dimensional (3D) nature of these data sets allows for evaluations from an infinite number of viewpoints. Another advantage of MD CTA and CE MRA is that examination times are short, and patient tolerance is high. In a recently published study, 41% of patients preferred CE MRA over DU in their workup for suspected peripheral arterial disease, 9% preferred DU, and 50% did not have a preference (22).
Invasive therapy for peripheral arterial disease can be divided into interventional radiological and vascular surgical procedures. The choice of therapy for a range of conditions
has been extensively researched in the recently published Trans-Atlantic Inter-Society Consensus (TASC) document. In the TASC document, arterial lesions and their preferred treatment are classified according to location, severity, and length (1). The strength and popularity of both MD CTA and CE MRA derive from the fact that both are uniquely suited to guide therapeutic management and arterial access.
has been extensively researched in the recently published Trans-Atlantic Inter-Society Consensus (TASC) document. In the TASC document, arterial lesions and their preferred treatment are classified according to location, severity, and length (1). The strength and popularity of both MD CTA and CE MRA derive from the fact that both are uniquely suited to guide therapeutic management and arterial access.
Table 21-3 Commonly Used Diagnostic Tests for Detection and Grading of Peripheral Arterial Disease | ||||||||||||||||||
|---|---|---|---|---|---|---|---|---|---|---|---|---|---|---|---|---|---|---|
|
Imaging Strategies
Computed Tomographic Angiography
Lower extremity (peripheral) CTA is a fairly new technique when compared with both ultrasound (US) and MRA. Peripheral CTA became possible only after the introduction of multidetector-row CT technology (MDCT) in 1998, which—for the first time—allowed scanning of the entire lower extremity inflow and runoff vessels in a single CT acquisition and with a single contrast-medium injection at adequate spatial resolution (23). With rapidly developing scanner capabilities and increasing availability of MDCT systems, peripheral CTA gradually entered clinical practice (24,25,26,27,28), and evolved into a robust and reliable modality (29,30). Current state-of-the art 16- through 64-channel CT systems allow the routine acquisition of high-resolution near-isotropic 3D data sets of the peripheral arterial tree (31).
Scanning Technique
Peripheral CT angiograms can be obtained with any MDCT scanner (4-channel and above). No special hardware is required. With a standardized scanning protocol programmed into the scanner, peripheral CTA is a robust technique for elective and emergency situations. When patients are mobile, the study can easily be performed in 10 to 15 minutes of room time. The short acquisition time of 25 to 50 seconds makes it possible to scan acutely ill patients (e.g., in the emergency room setting) as well.
In general, peripheral CTA acquisition parameters follow those of abdominal CTA. Unless automated tube-current modulation is available (which is strongly recommended), a tube voltage of 120 kV and tube amperage of up to 300 mA (depending on the scanner) is used for peripheral CTA, which results in a similar radiation exposure and dose (12.97 mGy, 9.3 mSv) as abdominal CTA (24). Breath holding is required only at the beginning of the CT acquisition through the abdomen and pelvis. Lower amperage (and/or voltage) can and should be used in slim patients. In obese patients, tube voltage and tube current often need to be increased. A medium to small imaging field-of-view (FOV) (using the greater trochanter as a bony landmark) and a medium-soft reconstruction kernel are generally used for image reconstruction.
Scanning Protocol
One (or more) dedicated “peripheral CTA” acquisition and contrast medium injection protocol(s) should be established for each scanner and programmed into the scanner. A full scanning protocol consists of (a) the digital radiograph (“Scout” or “Topogram”); (b) an optional nonenhanced acquisition; (c) one series for a test bolus or bolus triggering; (d) the actual CTA series; and (e) a second, optional (“late phase”) CTA acquisition (only initiated on demand) in the event of nonopacification of distal vessels (Fig. 21-2).
Patient Positioning and Scanning Range
The patient is placed feet first and supine on the couch of the scanner. In order to keep the image reconstruction FOV small, and also to avoid off-center stair-step artifacts (32), it is important to carefully align the patient’s legs and feet close
to the isocenter of the scanner. Tape may be required to hold a patient’s knees together. While cushions can be used to stabilize the extremities to the patient’s comfort, large cushions under the knees should not be used to keep the FOV small.
to the isocenter of the scanner. Tape may be required to hold a patient’s knees together. While cushions can be used to stabilize the extremities to the patient’s comfort, large cushions under the knees should not be used to keep the FOV small.
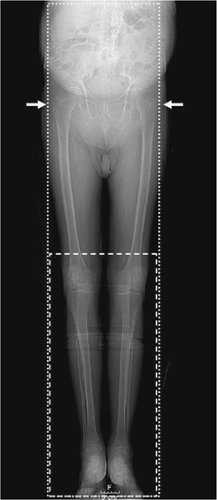 Figure 21-2 Digital CT radiograph (“topogram” or “scout view”) for prescribing a peripheral CTA. The patient’s legs and feet are aligned with the long axis of the scanner. Scanning range (from the T12 vertebral body through the feet) and reconstruction FOV (determined by the greater trochanters [arrows) are indicated by the dotted line. A second, optional CTA acquisition is prescribed for the crural/pedal territory (dashed line). (Reprinted with permission from Fleischmann D, Hallett RL, Rubin GD. CT angiography of peripheral arterial disease. J Vasc Interv Radiol. 2006;17:3–26.) |
Also—as in conventional angiography—excessive plantar-flexion of the feet is avoided to prevent an artifactual stenosis or occlusion of the dorsalis pedis artery (“ballerina sign”) (33). The standard anatomic coverage extends from the T12 vertebral body level (to include the renal artery origins) proximally through the patient’s feet distally (Fig. 21-2). The average scan length is between 110 and 130 cm. Smaller scan ranges (e.g., mid-thigh to feet) or a smaller FOV (one leg only) may be selected in specific clinical situations, such as in popliteal arterial entrapment syndrome, or trauma.
In patients with suspected popliteal arterial entrapment syndrome, we use a sling of bedsheet under the patient’s forefoot to allow for a provocation maneuver with contraction of the calf muscles against the sheet, which is pulled by the patient during the scan time (Fig. 21-3). Two contrast medium injections (80 mL each) and three CT acquisitions (arterial phase with provocation for the first injection, arterial and venous phases for the second injection, respectively) are given.
Image Acquisition and Reconstruction Parameters
The choice of acquisition parameters (detector configuration/pitch) and the corresponding reconstruction parameters (section thickness/reconstruction interval) depends largely on the type and model of the scanner. Table 21-4 provides an overview of peripheral CTA acquisition parameters for a wide range of MDCT scanners and reflects our clinical
experience with 4-, 16-, and 64-channel Siemens MDCT scanners (Siemens Medical Solutions, Erlangen, Germany), and 4-, 8,- and 16-channel General Electric MDCT scanners (General Electric Healthcare, Milwaukee, WI). Detector configuration is denoted as number of channels times channel width (e.g., 4 ÷ 2.5 mm); section thickness (STh) and reconstruction interval (RI) are expressed as STh/RI (e.g., 3 mm/1.5 mm).
experience with 4-, 16-, and 64-channel Siemens MDCT scanners (Siemens Medical Solutions, Erlangen, Germany), and 4-, 8,- and 16-channel General Electric MDCT scanners (General Electric Healthcare, Milwaukee, WI). Detector configuration is denoted as number of channels times channel width (e.g., 4 ÷ 2.5 mm); section thickness (STh) and reconstruction interval (RI) are expressed as STh/RI (e.g., 3 mm/1.5 mm).
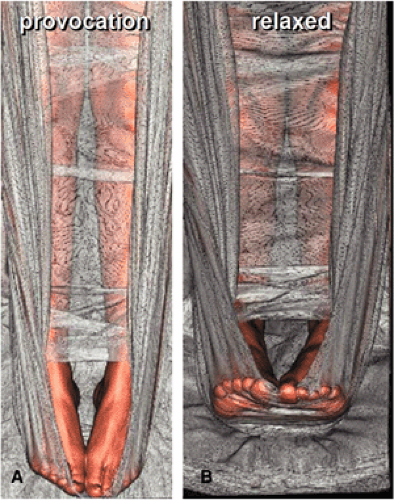 Figure 21-3 Provocation maneuver. VR images demonstrate scanning range and provocation maneuver in popliteal arterial entrapment syndrome. A bedsheet is used as a sling under the patient’s forefoot. A: During the provocation maneuver, the patient extends his or her feet against the resistance of the bedsheet, which is pulled up by the patient at the same time to contract the calf muscles. B: Relaxed position. |
Table 21-4 Multidetector Computed Tomography Acquisition Parameters for Peripheral Computed Tomography—Angiography | ||||||||||||||||||||||||||||||||||||||||||||||||||||||||||||||||||||||||||||||||||||||||||||||||||||||||||||||||||||||||||||||||||||||||||||||||||||||||||||||||||||||||||||||||||||||||
|---|---|---|---|---|---|---|---|---|---|---|---|---|---|---|---|---|---|---|---|---|---|---|---|---|---|---|---|---|---|---|---|---|---|---|---|---|---|---|---|---|---|---|---|---|---|---|---|---|---|---|---|---|---|---|---|---|---|---|---|---|---|---|---|---|---|---|---|---|---|---|---|---|---|---|---|---|---|---|---|---|---|---|---|---|---|---|---|---|---|---|---|---|---|---|---|---|---|---|---|---|---|---|---|---|---|---|---|---|---|---|---|---|---|---|---|---|---|---|---|---|---|---|---|---|---|---|---|---|---|---|---|---|---|---|---|---|---|---|---|---|---|---|---|---|---|---|---|---|---|---|---|---|---|---|---|---|---|---|---|---|---|---|---|---|---|---|---|---|---|---|---|---|---|---|---|---|---|---|---|---|---|---|---|---|
| ||||||||||||||||||||||||||||||||||||||||||||||||||||||||||||||||||||||||||||||||||||||||||||||||||||||||||||||||||||||||||||||||||||||||||||||||||||||||||||||||||||||||||||||||||||||||
Four-channel Multidetector Computed Tomography
With 4-channel MDCT, the detector configuration is usually set to 4 ÷ 2.5 mm. The corresponding thinnest effective section thickness is approximately 3 mm. With overlapping image reconstruction every 1 to 2 mm, these “standard resolution” data sets are adequate for visualizing the aortoiliac and femoropopliteal vessels and also provide enough detail to assess the patency of crural and pedal arteries if no or only minimal vessel calcification is present. Four-channel MDCT thus provides adequate imaging in patients with intermittent claudication; in acute embolic disease, aneurysms, and anatomic vascular mapping; and also in the setting of trauma.
Such “standard resolution” data sets may not be fully diagnostic, however, when visualization of small arterial branches (crural or pedal) is clinically relevant, such as in patients with critical limb ischemia and predominantly distal disease, notably in the presence of excessive arterial wall calcifications. If higher-resolution imaging is required and if the clinical situation permits a smaller anatomic coverage (e.g., limited to the legs or to popliteal-to-pedal vessels only), exquisite “high-resolution” imaging (Fig. 21-4) can also be achieved with 4-channel systems with 4 ÷ 1 mm or 4 ÷ 1.25 mm detector collimation (24) within acceptable acquisition times.
Eight-channel Multidetector Computed Tomography
A detector configuration of 8 ÷ 1.25 mm permits anatomic coverage of the entire peripheral arterial tree within the same scan time as a 4 ÷ 2.5 mm 4-channel MDCT
acquisition at substantially improved resolution. Images with a nominal section thickness of 1.25 mm, reconstructed at 0.8 mm (“high-resolution”), can routinely be acquired. Crural and even pedal arteries can be reliably identified with these settings. With faster gantry rotation speed (0.5 seconds/360° rotation) and maximum pitch, 8-channel MDCT allows for extended volume coverage—for example, to visualize the entire thoracic, abdominal, and lower extremity arteries within a single acquisition.
acquisition at substantially improved resolution. Images with a nominal section thickness of 1.25 mm, reconstructed at 0.8 mm (“high-resolution”), can routinely be acquired. Crural and even pedal arteries can be reliably identified with these settings. With faster gantry rotation speed (0.5 seconds/360° rotation) and maximum pitch, 8-channel MDCT allows for extended volume coverage—for example, to visualize the entire thoracic, abdominal, and lower extremity arteries within a single acquisition.
 Figure 21-4 Comparison of spatial resolution with 4-channel MDCT. A: MIP of the left calf in a patient with femorocriral bypass to the posterior tibial artery was obtained with 4 ÷ 2.5 mm and 3.0 mm/1.0 mm acquisition. Note the blurry appearance of vessel calcifications and the poor visualization of the small arterial branch distal to the anastomosis (arrow). B: Corresponding DSA with contrast medium injection into the bypass graft. C: VR image (posterior view) of another patient’s popliteocrural arteries obtained with 4 ÷ 1 mm detector configuration and 1 mm/1 mm section thickness/reconstruction interval. Note the excellent visualization of very small popliocrural vessels. D: Corresponding DSA. |
Sixteen-channel Multidetector Computed Tomography
When a detector configuration of 16 ÷ 1.25 mm or 16 ÷ 1.5 mm is used, similar “high-resolution” data sets of the peripheral arterial tree can be acquired, if 1.25- to 2-mm thick sections are reconstructed at 0.8- to 1-mm intervals. The acquisition speed with these parameter settings, however, is substantially faster when compared with both 4- and 8-channel systems. In fact, it may be too fast for patients with altered flow dynamics. Sixteen-channel MDCT also allows—for the first time—the routine acquisition of submillimeter “isotropic” data sets of the entire peripheral arterial tree.
With detector configuration settings such as 16 ÷ 0.625 mm or 16 ÷ 0.75, it is possible to reconstruct less than 1-mm thick sections spaced every 0.5 to 0.8 mm. With these settings, the acquisition is “slow,” in the range of 40 to 50 seconds, which is comparable to routine 4- (4 ÷ 2.5) and 8- (8 ÷ 1.25) channel system acquisitions. These submillimeter “isotropic” resolution data sets further improve the visualization of small crural or pedal vessels; however, image noise and increased dose and tube-current requirements may be problematic in the abdomen unless automated tube-current modulation is available.
It is important to bear in mind, however, that submillimeter acquisition (16 ÷ 0.625 mm, 16 ÷ 0.75 mm) does
not necessarily require submillimeter image reconstruction (i.e., reconstructing the thinnest possible images). For example, one might routinely choose to reconstruct thicker “high-resolution” (e.g., 1.25 mm) data sets from a submillimeter acquisition. This strategy still allows the user to go back and reconstruct another “isotropic submillimeter” data set at maximum spatial resolution, if clinically necessary.
not necessarily require submillimeter image reconstruction (i.e., reconstructing the thinnest possible images). For example, one might routinely choose to reconstruct thicker “high-resolution” (e.g., 1.25 mm) data sets from a submillimeter acquisition. This strategy still allows the user to go back and reconstruct another “isotropic submillimeter” data set at maximum spatial resolution, if clinically necessary.
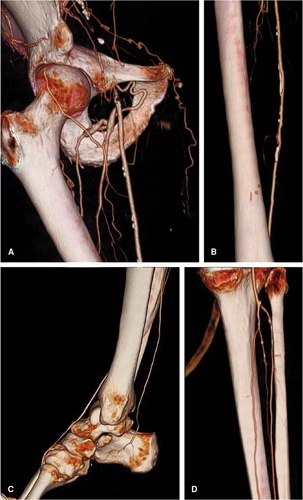 Figure 21-5 16-channel MDCT (16 ÷ 1.25 mm, 1.25 mm/0.8 mm) peripheral CT angiogram in a 70-year-old man with right thigh claudication and right iliofemoral artery occlusion demonstrates exquisite detail of small collateral vessels (A) as well as femoropopliteal (B), pedal (C), and crural arteries (D). (Reprinted with permission from Fleischmann D, Hallett RL, Rubin GD. CT angiography of peripheral arterial disease. J Vasc Interv Radiol. 2006;17:3–26.) |
It is our experience that the reconstruction of a single “high-resolution” (∼1.25 to 1.5 mm section thickness) data set obtained with 8- and 16-channel CT and 1-mm section thickness with 64-channel MDCT provides both adequate spatial resolution for the entire peripheral arterial tree while keeping the noise level in the abdomen and pelvis within an acceptable range (Fig. 21-5).
64-channel Multidetector Computed Tomography
Data acquisition with 64-channel MDCT normally ensues on a submillimeter scale (64 ÷ 0.6 mm or 64 ÷ 0.625 mm). Because of peripheral arterial enhancement dynamics, it is important to deliberately “slow down” the acquisition speed with these scanners by selecting a low pitch and refraining from using the maximum gantry rotation speed, most notably in patients with occlusive disease.
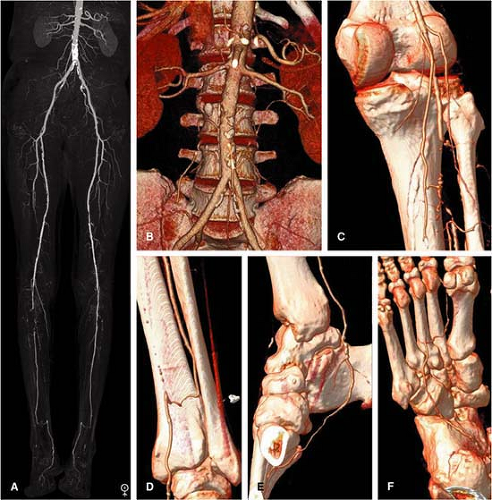 Figure 21-6 Sixty-four channel MDCT (64 ÷ 0.6 mm, 1.0 mm/0.7 mm) peripheral CT angiogram in an 83-year-old man with right greater than left calf and foot claudication. Automated tube current modulation (CareDose 4D, Siemens Medical Solutions, Forchheim, Germany) allows submillimeter acquisition and reconstruction with acceptable image noise level in the abdomen and unprecedented spatial resolution down to the plantar arch and metatarsal branches. MIP of the entire data set (A); VR views of the abdomen (B), occlusion of the right popliteal trifurcation with reconstitution of the peroneal artery (C), which reconstitutes the right posterior tibial artery above the ankle via a communicating branch (D), and supplies the foot through the common and lateral plantar arteries (E), which fill the plantar arch (F). (Reprinted with permission from Fleischmann D, Hallett RL, Rubin GD. CT angiography of peripheral arterial disease. J Vasc Interv Radiol. 2006;17:3–26.) |
Again, one can use the raw data from the submillimeter acquisition to routinely reconstruct data sets with a section thickness of 1.0 to 1.5 mm (“high-resolution”) (Fig. 21-6). “Submillimeter isotropic” images with a section thickness as
small as 0.6 to 1.0 mm spaced every 0.4 to 0.7 mm may be reconstructed from the same acquisition. This maximum spatial resolution may translate into improved visualization and treatment planning of patients with advanced PAOD.
small as 0.6 to 1.0 mm spaced every 0.4 to 0.7 mm may be reconstructed from the same acquisition. This maximum spatial resolution may translate into improved visualization and treatment planning of patients with advanced PAOD.
Peripheral CTA data sets are generally large, ranging from 900 to 2,500 images. At Stanford, all images are saved and stored in the Picture Archiving and Communication System (PACS), but this may not be feasible for all institutions. One potential solution to reduce file sizes is to permanently archive 1.5- to 2-mm thick images and to use thinner sections (e.g., submillimeter) only for data viewing and for the generation of permanent high-quality reformatted images.
Contrast Medium Injection Technique
Intravenous iodinated contrast medium is injected into an antecubital vein (20 gauge or larger IV cannula) by using a power injector. The basic principles of contrast medium injection for CTA, such as the relationship of the injection flow rate and the injection duration on arterial enhancement, also apply to peripheral CTA—at least for its aortoiliac portion (34). Peripheral CTA is more complex, however, with respect to synchronizing the enhancement of the entire lower extremity arterial tree with the CT data acquisition speed.
In general, 1.0 to 1.5 g of iodine injected per second (I/s) usually achieves adequate arterial enhancement for an average (75 kg) person. Body weight based adjustments of the injection flow rate and volume are recommended, at least for those subjects with more than 90 kg and those with less than 60 kg of body weight. The injection duration also affects the time course of arterial enhancement. With a continuous IV injection of contrast medium over a prolonged period of time (e.g., 35 seconds), arterial enhancement continuously increases over time (35). This explains why the attenuation values observed in peripheral CT angiograms are usually lowest in the abdominal aorta and peak at the level of the infragenicular popliteal artery (24). In general, biphasic injections result in more uniform enhancement over time, notably with long scan and injection times (>25 to 30 seconds) (32).
Principles of Scan Timing
The time interval between the beginning of the intravenous contrast medium injection and the arrival of the bolus in the aorta—referred to as the contrast medium transit time (tCMT)—is very variable between patients with coexisting cardiocirculatory disease and may range from 12 to 40 seconds. Individualizing the scanning delay is thus generally recommended in peripheral CTA. A patient’s individual tCMT can be reliably determined with a small test-bolus injection or estimated by using automated bolus-triggering techniques. The scanning delay may then be chosen to equal the tCMT (the scan is thus initiated as soon as contrast medium arrives in the aorta), or the scanning delay may be chosen at a predefined interval after the tCMT. For example, the notation “tCMT + 5s” means that the scan starts 5 seconds after contrast medium has arrived in the aorta.
Aortopopliteal Bolus Transit Times
The additional challenge in patients with PAOD is related to the well-known fact that arterial stenoses, occlusions, or aneurysms anywhere between the infrarenal abdominal aorta and the pedal arteries may substantially delay downstream vascular opacification (36,37). More specifically, in a group of 20 patients with PAOD, it was found that the transit times of IV-injected contrast medium to travel from the aorta to the popliteal arteries ranged from 4 to 24 seconds (average: 10 seconds), which corresponds to bolus transit speeds as fast as 177 mm/second to as slow as 29 mm/second, respectively (38).
The clinical implication for peripheral CTA is that when a table speed of ∼30 mm/second is selected, it is very unlikely (though not impossible) that the data acquisition is faster than the intravascular contrast medium bolus. With increasing acquisition speeds, however, the scanner table may move faster than the intravascular contrast medium column, and the scanner may thus outrun the bolus (Fig. 21-7). Of note, “outrunning-the-bolus” has only been reported in one study, which used a table speed of 37 mm/second (26),
but it has not been reported in five other published studies on peripheral CTA, all of which used table speeds of 19 to 30 mm/second (24,25,27,28,39).
but it has not been reported in five other published studies on peripheral CTA, all of which used table speeds of 19 to 30 mm/second (24,25,27,28,39).
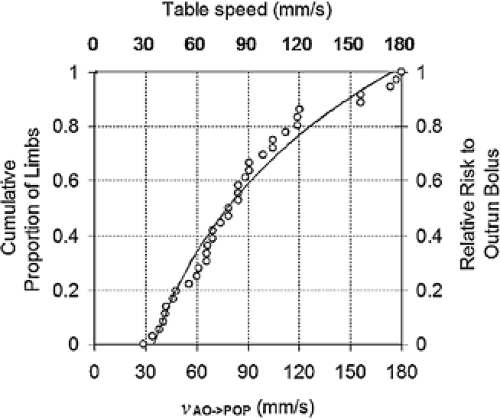 Figure 21-7 Plot shows cumulative proportion of limbs as a function of aortopopliteal bolus transit speed (vAO–>POP), with a logarithmic trendline (y = -0.6207Ln(x) + 3.203) fitted to the data (R2 = 0.97). The data can also be interpreted as the relative risk of outrunning the contrast medium bolus as a function of the table speed of the CT scanner, as indicated by the secondary x- and y-axes of the plot, respectively: an increase of the table speed (secondary x-axis) relates to an increased risk of outrunning the contrast medium bolus (secondary y-axis). (Reprinted with permission from Fleischmann D, Hallett RL, Rubin GD. CT angiography of peripheral arterial disease. J Vasc Interv Radiol. 2006;17:3–26.) |
For the following discussion, it is thus useful to arbitrarily categorize injection strategies for peripheral CTA into those for “slow” acquisitions (≤30 mm/second table speed) and those for “fast” acquisitions (>30 mm/second table speed). Sixty-four-channel MDCT injection strategies will be discussed separately.
Injection Strategies for “Slow” Acquisitions
Detector configuration settings of 4 ÷ 2.5 mm, 8 ÷ 1.25 mm, and 16 ÷ 0.625 mm all translate into an acquisition speed of approximately 30 mm/second. Such a table speed usually translates into a scan time of approximately 40 seconds for the entire peripheral arterial tree. Because the data acquisition follows the bolus from the aorta down to the feet, the injection duration can be chosen approximately 5 seconds shorter than the scan time. For example, for a 40-second acquisition, a 35-second injection duration is sufficient. This would translate into 140 mL of contrast medium if a constant injection rate of 4 mL/second was used. If the beginning of the data acquisition is timed closely to the contrast arrival time in the aorta (using a test bolus or bolus triggering), biphasic injections achieve more favorable enhancement profiles, with improved aortic enhancement. As an example, our current protocol for a submillimeter acquisition with a Siemens 16-channel scanner is shown in Table 21-5). A similar concept is used for the 64-channel Siemens scanner at our institution as well.
Table 21-5 Peripheral Computed Tomographic Angiography Injection Protocol for “Slow” Acquisitions | ||||||||||||||||
|---|---|---|---|---|---|---|---|---|---|---|---|---|---|---|---|---|
| ||||||||||||||||
Injection Strategies for “Fast” Acquisitions
Detector configuration settings of 8 ÷ 2.5, 16 ÷ 1.25, or 16 ÷ 1.5 translate into acquisition speeds of 45 to 65 mm/second, which—in some individuals—may be faster than the contrast medium bolus travels through a diseased peripheral arterial tree. In order to prevent the CT acquisition to outrun the bolus, it is necessary to allow the bolus a “head start.” This is accomplished by combining a fixed injection duration of 35 seconds to fill the arterial tree and a delay of the start of the CT acquisition relative to the time of contrast medium arrival in the aorta (tCMT). The faster the acquisition, the longer this “diagnostic delay” should be chosen. We use such a strategy with a GE 16-channel scanner with a 16 ÷ 1.25 mm protocol, pitch 1.375, and
0.6-second gantry rotation period (table speed: 45mm/second). The protocol as well as its generalization to other “fast” acquisitions is shown in Table 21-6. An example of arterial opacification using this approach by using fast scans is shown in Figure 21-5. The limitation of using a very long “diagnostic delay” (>15 seconds between contrast medium arrival and scan initiation) is undesirable opacification of the renal and portal veins and the inferior vena cava.
0.6-second gantry rotation period (table speed: 45mm/second). The protocol as well as its generalization to other “fast” acquisitions is shown in Table 21-6. An example of arterial opacification using this approach by using fast scans is shown in Figure 21-5. The limitation of using a very long “diagnostic delay” (>15 seconds between contrast medium arrival and scan initiation) is undesirable opacification of the renal and portal veins and the inferior vena cava.
Injection Strategy for 64-channel Multidetector Computed Tomography
While 32-, 40-, and 64-channel CT systems theoretically allow acquisition speeds of 80 mm/second and more, we deliberately acquire our peripheral CT angiograms at a much slower pace, by prescribing a fixed scan time of 40 seconds for each scan. For a 40-second scan time, we select a gantry rotation of 0.5 seconds and a pitch <1. Automated tube-current modulation is used in this setting to avoid increased radiation dose and also to control image noise (within and across patients). The advantage of always selecting the same 40-second scan time is that it can be combined with fixed (biphasic) injections of 35 seconds duration. The injection flow rates and volumes are then individualized to patient weight, such as shown in Table 21-7. Examples of image quality and opacification are shown in Figure 21-6.
Table 21-6 Peripheral Computed Tomographic Angiography Injection Protocol for “Fast” Acquisitions in Patients with Peripheral Arterial Occlusive Disease | ||||||||||||||||||
|---|---|---|---|---|---|---|---|---|---|---|---|---|---|---|---|---|---|---|
| ||||||||||||||||||
All of the above acquisition and contrast medium injection strategies reduce the risk of outrunning the bolus but do not eliminate it. An example of a patient with extremely delayed flow, most likely caused by decreased cardiac output and altered flow dynamics due to his bilateral iliac and popliteal artery aneurysms, and diffuse arteriomegaly is demonstrated in Figure 21-8. The risk of obtaining nondiagnostic studies is addressed by preprogramming a second CTA acquisition (covering the popliteal and infrapopliteal vasculature) into the scanning protocol. This acquisition is initiated by the CT technologist immediately following the main CTA acquisition only if he or she does not see any contrast medium opacification in the distal vessels.
Other Injection Strategies
The above injection strategies combine individual scan timing (using bolus tracking/test-bolus) in the aorta, with empiric (non-individualized) parameter selection to adjust for a broad range of possible bolus transit speeds down to the feet. Other approaches—using more or less individualization—are also possible. For example, protocols with a fixed, long scanning delay (28s) have been used successfully in the past, notably before automated bolus tracking technique was available on the first 4-channel scanners (28).
Table 21-7 Integrated 64-Channel Peripheral Computed Tomographic Angiography Acquisition and Injection Protocol | ||||||||||||||||||||||||||||||||||||||||||
|---|---|---|---|---|---|---|---|---|---|---|---|---|---|---|---|---|---|---|---|---|---|---|---|---|---|---|---|---|---|---|---|---|---|---|---|---|---|---|---|---|---|---|
| ||||||||||||||||||||||||||||||||||||||||||
On the other end of the spectrum are attempts to individualize both the scanning delay and the scanning speed based on both aortic and the popliteal transit times, determined individually with two test boluses (40). All of the above injection protocols can also be used in patients without occlusive disease, but deliberately delaying the scan or slowing down the acquisition is not imperative in this setting. For example, two small injections (60 to 80 mL/ second) with short scan times (5 to 6 seconds) for the two arterial acquisitions in popliteal entrapment syndrome are sufficient.
Venous Enhancement
Opacification of deep and superficial veins can be observed in peripheral CTA (24) and is more likely to occur with longer scan times and in patients with active inflammation (e.g., from infected or nonhealing ulcers). Given the rapid arteriovenous transit times observed angiographically in some patients (41), venous opacification cannot be completely avoided. As arterial enhancement is always stronger than venous enhancement when the injection is timed correctly (24), and with adequate anatomic knowledge and postprocessing tools, venous enhancement rarely poses a diagnostic problem.
Visualization and Image Interpretation
Visualization, image interpretation, and effective communication of findings are demanding in peripheral CTA. A powerful medical image postprocessing workstation as well as standardized workflow and visualization protocols are required when peripheral CT angiograms are performed on a regular basis.
Various two-dimensional (2D) and 3D postprocessing techniques are available on today’s state-of-the-art workstations. For patients with atherosclerotic disease, a combination of 3D-overview techniques with at least one 2D cross-sectional technique is generally required. The selection of postprocessing techniques not only depends on the type of disease but also on the specific visualization goal: interpretation versus documentation. In the context of interactive exploration of the data sets—usually done by the radiologist interpreting the study during readout—fast navigation and flexible visualization tools are preferred. In the setting of creating standardized sets of static images and measurements for documentation and communication, techniques that allow a protocol-driven generation of predefined views are preferred.
The typical protocol for postprocessing of peripheral CTA in the Stanford 3D laboratory consists of curved
planar reformations (CPRs); thin-slab maximum-intensity projections (MIPs) through the renal and visceral arteries; bone removal; full-volume MIPs and volume renderings (VRs) of the abdomen, pelvis, and each leg; and filming and archiving of these views. While the creation of such sets of images may be time-consuming even for an experienced technologist, the clinical interpretation is fast and straightforward for the image recipient.
planar reformations (CPRs); thin-slab maximum-intensity projections (MIPs) through the renal and visceral arteries; bone removal; full-volume MIPs and volume renderings (VRs) of the abdomen, pelvis, and each leg; and filming and archiving of these views. While the creation of such sets of images may be time-consuming even for an experienced technologist, the clinical interpretation is fast and straightforward for the image recipient.
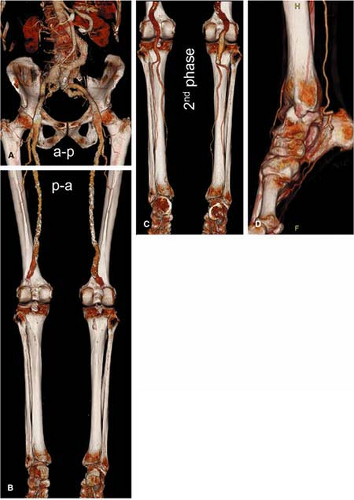 Figure 21-8 Peripheral CT angiogram (16 ÷ 1.25 mm, 1.25 mm/0.9 mm) in an 82-year-old man with arteriomegaly, bilateral common iliac artery aneurysms, and diffuse ectasia of the femoropopliteal arteries. Frontal VR image (A) demonstrates good aortoiliac opacification. Posterior view VR image (B) shows gradually decreasing enhancement of the femoropopliteal arteries bilaterally, with complete lack of enhancement of the popliteal trifurcation and crural arteries. A second phase CTA acquisition was obtained from above the knees down to the feet immediately following the first acquisition. Posterior view of second phase CTA (C) shows interval opacification of the bilateral popliteal and crural arteries, down to the feet (D). (Reprinted with permission from Fleischmann D, Hallett RL, Rubin GD. CT angiography of peripheral arterial disease. J Vasc Interv Radiol. 2006;17:3–26.) |
Transverse Source Image Viewing
Reviewing of transverse CT slices is mandatory for the assessment of extravascular abdominal or pelvic pathology. This is facilitated by reconstructing an additional series of contiguous 5-mm thick sections through the abdomen and pelvis. Browsing through the stack of source images is also helpful to gain a first impression on vascular abnormalities, and in select cases—such as in patients with only minimal or no disease, in patients with trauma, or in patients with suspected acute occlusions, source image viewing may be sufficient. Relevant extravascular anatomy, such as the course and position of the medial head of the gastrocnemius muscle in popliteal entrapment syndrome, is readily depicted on the axial images and often inapparent on projection (e.g., MIP) images. Source images may also serve as a reference when 2D- or 3D-reformatted images suggest artifactual lesions. For the majority of cases with vascular disease, however, transverse image viewing is both inefficient and less accurate (27) than viewing reformatted images.
Postprocessing Techniques
Maximum Intensity Projection
Assessment of vascular abnormalities is facilitated when the arterial tree is displayed in an “angiographic” fashion. This can be accomplished with either MIP or VR technique. MIP provides the most “angiographylike” display of the vasculature—particularly when no or only minimal vessel calcifications are present. The disadvantage of MIP is that it requires bone removal from the data set, a time-consuming task. Additionally, inadvertent removal of vessels in close vicinity to bony structures may lead to spurious lesions.
Volume Rendering
Because VR preserves 3D depth information, unlike MIP, bone editing may not be required. Clip planes, volume slabs, and appropriate viewing angles are used to expose the relevant vascular segment. VR is the ideal tool for fast interactive exploration of peripheral CTA data sets. While “snapshot” views obtained during data exploration can be invaluable for communicating a specific finding or detail, VR is somewhat less suited for standardized documentation of images. In part, this is due to the fact that most PACS workstations do not display the color information on high-resolution grayscale monitors.
Multiplanar Reformation and Curved Planar Reformation
In the presence of calcified plaque, diffuse vessel wall calcification, or endoluminal stents, cross-sectional views are essential to assess the vascular flow channel (Fig. 21-9). Transverse source images, such as sagittal, coronal, or oblique multiplanar reformations, are useful in an interactive setting, for example in conjunction with VR.
Alternatively, longitudinal cross sections along a predefined vascular centerline, so-called CPRs, can be created (Fig. 21-10). CPRs provide the most comprehensive cross-sectional display of luminal pathology but require either manual or (semi-) automated tracing of the vessel centerlines (43,44). CPR does not require bone editing, but at least two CPRs per vessel segment (e.g., sagittal and coronal views) have to be created in order to fully evaluate eccentric disease.
One problem of (single) CPR images in the context of visualizing the peripheral arterial tree is their limited spatial perception. With bony landmarks out of the curved reconstruction plane, the anatomic context of a vascular lesion may be ambiguous unless clear annotations are present. This limitation has recently been alleviated by an extension of standard CPR to so-called multipath CPR images (43). Multipath CPRs provide simultaneous longitudinal cross-sectional views through the major conducting vessels (Fig. 21-11) without obscuring vessel wall calcifications and stents while maintaining spatial perception (45). This technique is a convenient visualization, documentation, and endovascular treatment-planning tool for peripheral CTA; however, it is not generally available on commercial workstations.
Thin-slab Maximum-intensity Projection, Thin-slab Volume Rendering, and Thick Multi- and Curved Planar Reformation
If applied to subvolumes of the data sets, either by using clip planes, or “slabs” of the volume to focus on a particular area of interest, the resulting images are referred to as thin-slab MIPs or thin-slab VRs, or thick MPRs (or CPRs) (46,47). Interactive real-time variation of the viewing direction, the thickness of the rendered volume, adjustments to
window-level settings or opacity transfer-functions, and the like is ideal for interactively exploring the data sets.
window-level settings or opacity transfer-functions, and the like is ideal for interactively exploring the data sets.
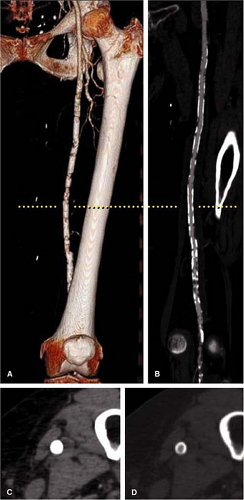 Figure 21-9 Peripheral CTA (16 x 1.25 mm, 1.25 mm/0.9 mm) of a 72-year-old woman with a nonhealing left forefoot ulcer. A: VR image of the left superficial femoral artery shows excessive vessel wall calcifications, precluding the assessment of the flow channel. Cross-sectional views are required to visualize the vessel lumen. Axial CT images (B, C) through mid superficial femoral artery (dotted line in A and B) with viewing window settings (level/width) of 200 HU/600 HU (B) does not allow to distinguish between opacified vessel lumen and vessel calcification, which can be distinguished only when an adequately wide window width (300 HU/1200 HU) is used (C). Similar wide window settings are also used for a CPR through the same vessel (D), displaying several areas of wall calcification with and also without stenosis. (Reprinted with permission from Fleischmann D, Hallett RL, Rubin GD. CT angiography of peripheral arterial disease. J Vasc Interv Radiol. 2006;17:3–26.) |
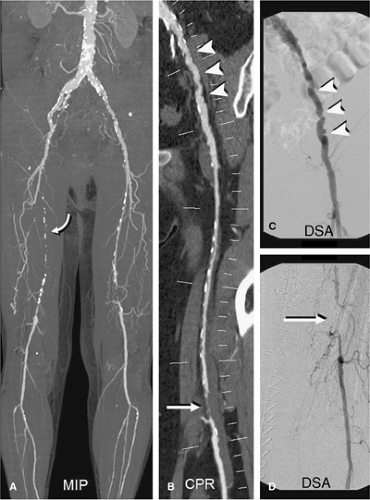 Figure 21-10 Peripheral CTA (16 ÷ 0.75 mm, 2.0 mm/1.0 mm) of a 73-year-old woman with intermittent claudication bilaterally. MIP (A) shows long right femoropopliteal occlusion (curved arrow) and diffuse disease of the left superficial femoral artery with a short distal near-occlusion. CPR (B) through left iliofemoral arteries demonstrates multiple mild stenoses of the external iliac artery (arrowheads), a diffusely diseased left superficial femoral artery, and short (<3 cm) distal left SFA occlusion (arrow). Corresponding selective DSA images of the left external iliac artery (C) and the distal left superficial femoral artery (D) obtained immediately before PTA/stenting. (Reprinted with permission from Fleischmann D, Hallett RL, Rubin GD. CT angiography of peripheral arterial disease. J Vasc Interv Radiol. 2006;17:3–26.) |
Automated Techniques for Segmentation and Visualization
While fully automated detection of vessel centerlines, automated segmentation of bony structures, and detection (and subtraction) of vessel wall calcification is highly desirable, no such algorithms have yet been developed. This is not surprising when considering the complex manifestations of vascular disease; the wide range of vessel sizes; the wide overlap in CT density values of opacified blood, plaque, and low-attenuation bone; and the inherently limited spatial resolution and image noise in peripheral CTA data sets. Several software tools for improved and faster editing and for creating centerlines through the arteries have been developed and are available on modern 3D workstations.
Interpretation and Pitfalls
Vascular abnormalities have to be interpreted in the context of a patient’s symptoms, stage of disease, and with respect to the available treatment options. For those familiar to reading
conventional angiograms, the clinical aspect of interpreting a peripheral CTA is usually straightforward. However, visual perception and interpretation of well-known abnormalities in a new and different format (such as VR or CPR images) requires adaptation and familiarity with the specific techniques used.
conventional angiograms, the clinical aspect of interpreting a peripheral CTA is usually straightforward. However, visual perception and interpretation of well-known abnormalities in a new and different format (such as VR or CPR images) requires adaptation and familiarity with the specific techniques used.
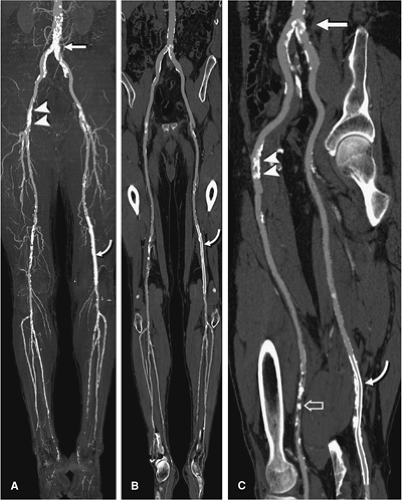 Figure 21-11 Peripheral CTA (16 ÷ 0.75 mm, 2.0 mm/1.0 mm) of a diabetic man with bilateral claudication. MIP (A) shows arterial calcifications near the aortic bifurcation (arrow) as well as in the right (arrowheads) and left common femoral arteries, in the right femoropopliteal region, and in the crural vessels. A long stent is seen in the left femoropopliteal segment (curved arrow). Frontal view (B) and magnified 45° left anterior oblique (LAO) (C) multipath CPR images provide simultaneous CPRs through the aorta and bilateral iliac through crural arteries. Note that prominent calcifications cause luminal narrowing in the proximal left common iliac artery (arrow) and in the right common femoral artery (arrowheads). The left common femoral artery is normal; the long femoropopliteal stent is patent (curved arrow). A mixed calcified and noncalcified occlusion of the right distal femoral artery is noted (open arrow). (Reprinted with permission from Fleischmann D, Hallett RL, Rubin GD. CT angiography of peripheral arterial disease. J Vasc Interv Radiol. 2006;17: 3–26.) |
Probably the most important pitfall related to the interpretation of peripheral CT angiograms is related to using narrow viewing window settings in the presence of arterial wall calcifications or stents. Even at wider-than-normal “CT-angiographic” window settings (Window level/width: 150 Hounsfield units [HU]/600 HU), high-attenuation objects (calcified plaque, stents) appear larger than they really are (“blooming”—due to the point-spread-function of the scanner), which may lead to an overestimation of a vascular stenosis or suggest a spurious occlusion.
When scrutinizing a calcified lesion or a stented segment by using any of the cross-sectional grayscale images (transverse source images, MPR, or CPR), a viewing window width of at least 1500 HU may be required (Fig. 21-9). Interactive window adjustment on a PACS viewing station or on a 3D workstation are most effective because when printed on film, window settings are usually too narrow.
In the setting of extensive atherosclerotic or media calcification within small crural or pedal arteries, such as those found in diabetic patients and in patients with end-stage renal disease, the lumen may not be resolved regardless of the window/level selection. In these circumstances,
other imaging techniques, notably MRI, may be preferable to CTA.
other imaging techniques, notably MRI, may be preferable to CTA.
Other interpretation pitfalls result from misinterpretation of editing artifacts (inadvertent vessel removal) in MIP images and pseudostenosis and/or occlusions in CPRs due to inaccurate centerline definition. Most of these artifacts are obvious or easily identified when additional views, complementary viewing modalities, or source images are reviewed.
Magnetic Resonance Angiography
Equipment Considerations
Imaging the lower extremity vasculature demands anatomic coverage of well over 100 cm. As the typical maximum FOV in current commercially available MR scanners is on the order of 40 to 45 cm, the peripheral vascular tree exceeds this by a factor of two to three times. In conventional intra-arterial imaging where the imaging FOV is even smaller, this problem is solved by using a stepping table approach with multiple injections of contrast material or a bolus-chase approach, whereby the bolus of contrast material is filmed and followed down the lower extremity by rapid table translation between several contiguous locations (48). Contrast-enhanced (CE) peripheral MRA essentially uses the same two strategies to image the peripheral vasculature.
When planning a peripheral MRA study, the relative needs for temporal resolution, spatial resolution, and signal-to-noise ratio (SNR) must be balanced. In general, higher main magnetic field strengths, higher maximum gradient amplitudes, and faster gradient systems allow for better imaging protocols to depict peripheral arterial disease. These system attributes are more important for CE MRA, which is currently considered the state-of-the-art for imaging the peripheral vascular tree, than for nonenhanced MRA.
A minimal main magnetic field strength of 1.0 T is needed for peripheral MRA. Systems with powerful gradients offer the greatest efficiency and flexibility.
The use of surface coils increases the SNR and is most important for imaging the tibial vessels, particularly at 1.0 T and 1.5 T. This SNR boost can be invested in temporal or spatial resolution or in combinations of the two. An increase in spatial resolution increases arterial conspicuity and improves disease characterization in small, distal, diseased arteries. An increase in temporal resolution helps to avoid venous enhancement and can display collateral filling patterns to good vantage.
Phased-array surface body- or torso coils can be used to image the lower leg. In addition, dedicated multistation peripheral vascular coils with coverage exceeding 100 cm are widely available (Fig. 21-12). In cases where a protocol targets a single foot, a head or knee coil can be effective (Fig. 21-13). Several authors have shown that the use of such coils benefits signal-to-noise and anatomical coverage (49,50,51).
 Figure 21-12 Lower extremity coil. Commercially available three-station, 12-element phased-array lower extremity coil (Philips Medical Systems; Best, the Netherlands). In each station (aortoiliac, upper legs, and lower legs), there are two anterior and two posterior elements that can be used for signal reception. This coil design also permits parallel imaging. Note that the feet are covered as well, allowing depiction of pedal vasculature with high SNR. |
An important technical advance for CE MRA, enabled with the use of localized coils, is parallel imaging (52,53,54). Parallel imaging speeds up data acquisition by replacing the relatively slow spatial encoding through the use of gradients with a faster spatial encoding that uses coil sensitivity profiles. In theory, acquisition duration can be decreased by a factor R equal to the number of coil elements. However, the acceleration is offset by a reduction in the SNR equal to √R.
 Figure 21-13 Pedal vessels obtained by using a head coil. This sagittal MIP, generated from an ECG-triggered 2D TOF sequence, has excellent signal and contrast, demonstrating good-quality pedal vessels. |
Different Magnetic Resonance Angiography Techniques for Imaging Peripheral Arterial Disease
Several different MRA techniques have been described to image the peripheral vascular tree. These are (a) phase contrast (PC) MRA, (b) time-of-flight (TOF) or inflow MRA, (c) 3D half-Fourier fast spin echo MRA, (d) balanced steady state free precession (bSSFP) MRA and, (e) CE MRA. The latter technique is currently by far the most widely used, although noncontrast techniques are being re-examined to address recent concerns about nephrogenic systemic fibrosis associated with gadolinium administration. A discussion of this reaction can be found in Chapter 22. A summary of the relative merits and shortcomings of MRA techniques can be found in Table 21-8, and detailed descriptions are found in Chapter 2.
Phase Contrast
In PC MRA, vessel-to-background contrast is generated by displaying the accumulated phase difference in transverse magnetization between moving protons in blood and stationary background tissues (55).
In addition to anatomical display of the peripheral vasculature, PC MRA provides physiological studies with flow quantification. However PC MRA is optimized with a priori knowledge about the maximum blood flow velocity in the vessel of interest, information that is rarely available. If maximum flow exceeds the maximum velocity encoding (VENC) value, aliasing artifacts reduce the signal in the vessel of interest. To avoid this problem, multivelocity encoded PC MRA sequences can be used (56,57). The main advantage of PC MRA is that it is less sensitive to in-plane saturation than TOF MRA.
Table 21-8 Advantages and Disadvantages of Different Magnetic Resonance Angiography Techniques for Imaging Peripheral Arterial Occlusive Disease | |||||||||||||||||||||||||||
|---|---|---|---|---|---|---|---|---|---|---|---|---|---|---|---|---|---|---|---|---|---|---|---|---|---|---|---|
| |||||||||||||||||||||||||||
Steffens et al. (58) compared PC MRA with IA DSA to detect aortoiliac and femoropopliteal APAOD in 115 patients. A sensitivity of 95% and specificity of 90% with near perfect interobserver agreement (kappa value of 0.92) was reported (58). PC MRA is not often used for detection and grading of lower extremity arterial disease because of the success of CE techniques.
Time of Flight
In TOF MRA, vessel-to-background contrast is generated by the inflow of fresh, unsaturated blood to a saturated tissue slice. Saturation of stationary background tissue is achieved when radio frequency (RF) pulses with a repetition time much shorter than tissue T1 values are employed. This results in a relatively low longitudinal magnetization producing relatively lower SI. When inflowing unsaturated blood with its large longitudinal magnetization vector (having not been exposed to the RF pulses) enters the imaging slice, it will be seen as much higher signal intensity. Intravascular protons are also subject to saturation effects, proportional to the time those protons reside in the imaging
slice. Short repetition time (TR), slow flow, and course of the blood vessel in the imaging slice plane all unfavorably affect vessel-to-background contrast (59).
slice. Short repetition time (TR), slow flow, and course of the blood vessel in the imaging slice plane all unfavorably affect vessel-to-background contrast (59).
With slower flow demand, the use of higher TR values allows for the best possible image quality. If protons in arterial blood are subjected to too many successive RF excitations with a short TR, saturation and loss of vessel-to-background contrast will be inevitable. TOF MRA is possible either by imaging successive, independent slices (2D TOF MRA), or by imaging a volume that is later partitioned into separate slices (3D TOF MRA). With 3D TOF MRA, thinner slices can be chosen, but acquisition duration is longer and it is less sensitive to slow flow.
TOF MRA suffers from long imaging times (caused by the use of thin sections, which must be oriented perpendicular to the blood flow) and a number of artifacts inherent to TOF MRA that can overestimate the degree and length of stenoses. Artifacts that may mimic vascular stenosis or occlusion are (a) in-plane saturation (Fig. 21-14), (b) accelerated intravoxel phase dispersion (Fig. 21-15) due to turbulent flow (seen in vicinity of high grade stenoses), (c) signal loss due to saturation bands that eliminate signal from retrograde arterial flow, and (d) slice misalignment due to patient motion between acquisitions of successive slices when 2D TOF techniques are used (Fig. 21-14).
With turbulent flow, as is the case distal to stenoses, the dephasing of spins causes signal loss on MRA images, which can lead to an overestimation of the degree and length of stenosis. This artifact is minimized by choosing the shortest echo time (TE) values. For TOF, the shortest TE that can accommodate first-order flow compensation (velocity) is recommended. On the other hand, data from in vitro studies have shown that the magnitude of the signal void artifact
directly correlates with the pressure gradient across a stenosis (60).
directly correlates with the pressure gradient across a stenosis (60).
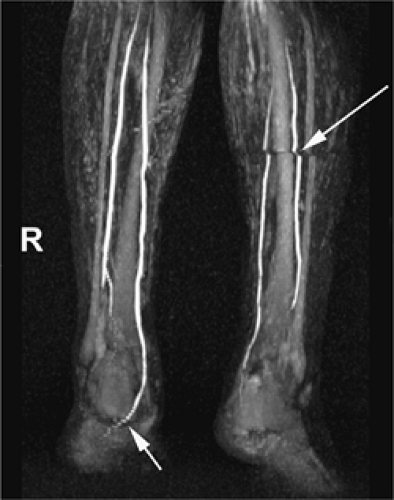 Figure 21-14 Slice misalignment artifact (upper arrow) due to left lower leg movement during acquisition. The artifact can be differentiated from a stenosis by the typical displacement of the distal arteries with respect to the proximal arteries. Also note gradual extinction of intra-arterial signal in the right foot due to in-plane saturation (lower arrow). |
 Figure 21-15 TOF disease overestimation. TOF (A) and gadolinium-enhanced (B) MR angiograms in a patient with high-grade left common iliac artery stenosis. Because of intravoxel phase dispersion due to turbulent flow distal to the stenosis the TOF technique is unable to reliably differentiate high-grade stenoses from occlusions (oblique arrow). In addition, an in-plane saturation artifact suggests a stenosis in the horizontal part of the left external iliac artery, where in reality there is no stenosis (vertical arrow). |
Saturation bands that selectively image flow from one direction are employed to suppress adjacent venous flow (61,62). Because the signal of all blood flowing in a given direction is suppressed, extinction of signal from retrograde arterial flow may have undesirable results. For example, in the case of unilateral iliac artery occlusion or superficial femoral occlusion with retrograde flow, the length of disease may be overestimated and eliminate an angioplasty/stent option that may have been appropriate.
Ghosting artifacts result from large variations in blood flow velocity during the cardiac cycle, typically seen in pulsatile vessels. Their occurrence can be prevented by using systolic cardiac synchronization (63) at the expense of acquisition time and possible exacerbation of phase-dispersion artifacts from rapid systolic flow through high-grade stenosis.
TOF MRA was the first technique to show efficacy in MRA of lower extremity occlusive disease (64,65,66), but selection of optimal imaging parameters is complex (67), and study times are prohibitively long to serve as a routine, comprehensive study of the aorta to the pedal vessels. Despite the disadvantages, TOF MRA has detected run-off vessels in the distal lower leg and foot that were not visualized with conventional x-ray angiographic techniques (15). Furthermore, surgical outcomes for lower extremity bypass grafts based on TOF determined vascular road maps are equivalent to those based on conventional arteriographic road maps (68). At present, the use of nonenhanced TOF MRA is limited to imaging the distal lower leg and foot in patients when CE MRA cannot safely be used or when its image quality is insufficient.
Three-dimensional Half-Fourier Fast Spin Echo
Recently, 3D flow-spoiled, electrocardiogram (ECG)-triggered, half-Fourier fast spin echo imaging has been described for non-CE MRA of the peripheral vasculature (69). With this fresh blood imaging technique in fast-flow vessels, both arteries and veins appear as bright blood when acquired in diastole; however, when acquired in systole, this technique shows black blood arteries and bright blood veins in systole-triggered images (70). Subtraction of systole-triggered images (selective vein) from diastole-triggered images (vein + artery) yields an arterial image.
In peripheral or slow-flow vessels, the technique provides bright blood arteries even in systole, which makes it difficult to separate arteries from veins. Applying the readout direction parallel to the vessel orientation and adding a flow-spoiled gradient pulse in that same direction offer some solutions to this issue (70).
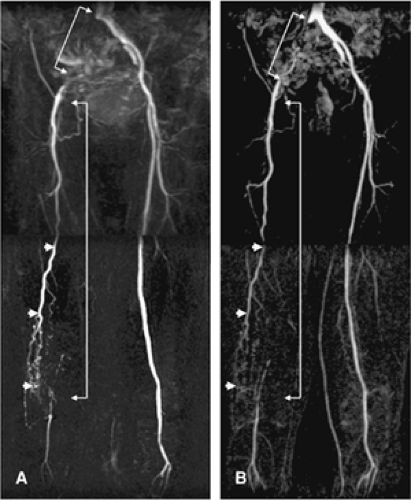 Figure 21-16 A 69-year-old female with severe intermittent claudication. Both flow-spoiled MRA (A) and CE MRA (B) demonstrate complete obstructions of the right common iliac artery and the right superficial femoral artery as well as bridging collaterals. (Image courtesy of Joji Urata, MD, Saiseikai Kumamoto Hospital, Kumamoto, Japan.) |
Promising results using this technique were reported in healthy volunteers and in preliminary studies in patients (Fig. 21-16). The accuracy of the technique remains to be determined in larger studies.
Balanced Steady State Free Precession
bSSFP can be used for MRI and MRA. A variety of acronyms are used to describe bSSFP pulse sequences; the most used terms are true fast imaging in steady state free precession (TrueFISP; Siemens Medical Solutions, Erlangen, Germany), balanced fast field echo (bFFE; Philips Medical Systems, Best, the Netherlands), and fast imaging employing steady state excitation (FIESTA, General Electric, Waukesha, Wisconsin).
These sequences are characterized by a very high SNR and image contrast that is primarily determined by the ratio of T2 to T1. The different T2/T1 ratios of blood and surrounding tissue allow for angiographic, bright blood imaging with bSSFP. Efficient fat saturation is necessary in cases where arteries are surrounded by bright signal fat. Injection of gadolinium chelate contrast media can be helpful to further increase contrast between arteries and surrounding tissue (71).
Contrast-enhanced Magnetic Resonance Angiography
Background
CE MRA of the peripheral vasculature has evolved into the preferred technique for evaluation of patients with different forms of PAOD in patients for whom its administration is safe. The variety of approaches to peripheral CE MRA allows a tailored strategy to suit the particular clinical question.
A readily available and straightforward approach is the acquisition of three consecutive, identical coronal imaging volumes during injection with a fixed dose (0.2 to 0.3 mmol/kg) or volume (30 to 45 mL) of 0.5 M gadolinium chelate (73,74,75). This approach is fast and reliable in the vast majority of claudicants. However, image quality of the distal arteries can be contaminated by disturbing venous enhancement for a substantial number of patients (76). Furthermore, the spatial resolution that is usually sufficient for characterizing atherosclerotic aortoiliac lesions is often insufficient for an accurate depiction of the tibial and pedal vessels, particularly when assessing patients with limb-threatening ischemia.
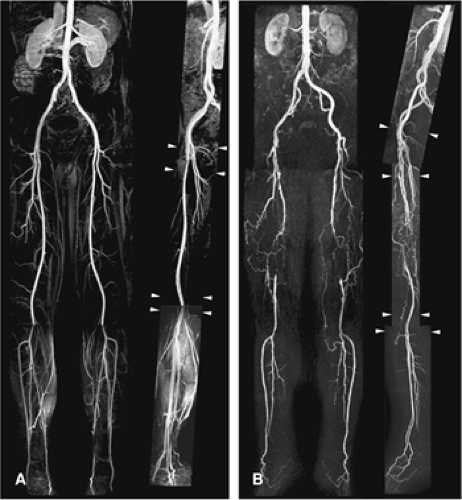 Figure 21-17 Tailoring 3D slabs. Coronal and sagittal MIP images of three-station CE MRA examinations 3D moving-bed infusion-tracking peripheral MR angiograms in a 26-year-old healthy male volunteer. The left data set (A) was obtained with a fixed-parameter technique (identical imaging parameters for aortoiliac, upper leg, and lower leg arteries); the right data set (B) was obtained by using a technique with optimized parameters for each station. Use of flexible parameters permits standard depiction of pedal vasculature (B). On sagittal images, note that volumes for the pelvis and upper and lower legs (containing a different number of partitions) are of different thicknesses (arrowheads). |
The three-consecutive-station approach does not work well in patients with diabetes mellitus, who are known to primarily have very distal disease (77) and in patients with chronic critical ischemia who have severe stenoses and occlusions from the aorta down to the feet (“multilevel” disease).
As an alternative, tailored prescriptions for each location along with the reordering of the center of k-space can optimize imaging for each station, that is, lower resolution for aortoiliac arteries and higher resolution and more anatomical coverage (to include the pedal arch) for lower leg arteries (78) (Fig. 21-17). Such customization on a per-station basis is the clear preference for performing high-quality peripheral MRA.
The execution of peripheral CE MRA necessitates a compromise between the desire for high spatial resolution and volumetric coverage (requiring long acquisition duration), the desire to avoid disturbing venous enhancement (best achieved with shorter acquisition duration), and the desire for high vessel-to-background contrast. Below, the
different steps of the peripheral CE MRA examination as well as the practical trade-offs that one is likely to encounter are discussed.
different steps of the peripheral CE MRA examination as well as the practical trade-offs that one is likely to encounter are discussed.
Practical Aspects of Peripheral Contrast-enhanced Magnetic Resonance Imaging
Localizer Scans
Adequate planning of 3D CE MRA volumes ensures optimal image quality in the shortest possible imaging time. Scout scans are usually transverse, thick-slice, low-resolution TOF or, more recently, SSFP acquisitions. Scout views in sagittal or coronal orientation can also be useful. The advantage of using TOF images is that the vascular anatomy can be selectively outlined on MIPs (Fig. 21-18). When the 3D CE MRA volume is planned, transverse source images should always be reviewed to ensure that all relevant vascular structures are included in the imaging volume. Failure to do so can result in the exclusion of relevant anatomy from the imaging volume (Fig. 21-19).
Considerations with Regard to Vascular Anatomy
In most patients, peripheral arteries are slightly curved in the anteroposterior direction, and the coverage needed in that dimension is usually less than 10 cm. In the presence of an aortic aneurysm, iliac arterial elongation, collaterals bridging iliac, or superficial femoral arterial obstructions or a femorofemoral crossover bypass graft, the AP coverage needed to depict these vessels may be increased (up to 15 to 20 cm).
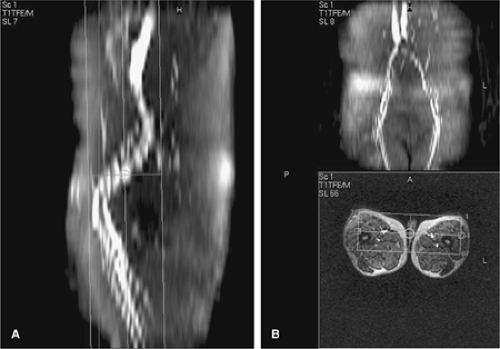 Figure 21-18 Low spatial resolution TOF localizer sequence. Image shows orthogonal MIPs (sagittal, left; AP, upper right; transverse, lower right) used to prescribe the 3D CE imaging volume (box enclosed by thin white line in left and lower right panels). |
In the aortoiliac segment, it is important to keep the acquisition duration to within the capacity of a reasonable breath hold for the individual being studied. By practicing the breath-hold instructions, one can determine a reasonable time frame and avoid confusion during the critical moments of acquisition. In cases where scan duration is incompatible with the breath-holding capabilities of the patient, it is advisable to shorten acquisition duration by increasing slice thickness, by using half-Fourier imaging, or by increasing the parallel imaging factor.
A review of the transverse localizer images ensures that salient structures are included in the 3D CE MRA imaging volume. This is particularly important if a patient has a femorofemoral crossover bypass graft, because these grafts are usually not seen on TOF MIPs due to in-plane saturation artifacts (59).
Other patients who demand special attention are those with (thoraco-) abdominal aortic aneurysms, where flow may be markedly slower compared with patients without
aneurysms. If insufficient delay time is observed between injection of contrast and imaging, this will result in incomplete enhancement of the aneurysm at the time of imaging (Fig. 21-20). To avoid this problem, either a longer delay between injection and start of acquisition or a multiphasic acquisition should be used (79).
aneurysms. If insufficient delay time is observed between injection of contrast and imaging, this will result in incomplete enhancement of the aneurysm at the time of imaging (Fig. 21-20). To avoid this problem, either a longer delay between injection and start of acquisition or a multiphasic acquisition should be used (79).
 Figure 21-19 Exclusion of pelvic arteries from imaging volume. With faulty placement of imaging volume, important vascular anatomy may be excluded. Coronal (A) and sagittal (B) MIP images of distal aorta and pelvic arteries in a patient with an AAA. On the coronal image, an occlusion in the left common iliac artery cannot be ruled out (arrow in A). However, review of the sagittal image shows exclusion of part of the left common iliac artery from the imaging volume (arrow in B). This part of the iliac arteries suffered from in-plane saturation in the TOF scan and was not depicted on the sagittal TOF MIP, which led to erroneous planning of the subsequent 3D acquisition. (Modified from Leiner T, Ho KY, Nelemans PJ, et al. Three-dimensional contrast-enhanced moving-bed infusion-tracking [MoBI-track] peripheral MR angiography with flexible choice of imaging parameters for each field of view. J Magn Reson Imaging. 2000;11:368–377.) |
Synchronization of Three-dimensional Contrast-enhanced Magnetic Resonance Angiography Acquisition with Contrast Arrival
A careful synchronization of peak arterial enhancement with the acquisition of the center of k-space is needed in order to obtain a study of diagnostic quality. The time of peak arterial enhancement is a function of many variables, the most important of which are injection rate and volume of contrast media and saline flush (80) as well as cardiac output (81). Because the time of peak arterial enhancement
can vary substantially between patients, the CE MRA examination needs to be tailored to the individual contrast arrival time. This is important for two main reasons: (a) to prevent ringing artifacts and suboptimal opacification of arteries in the FOV due to starting the acquisition too early (82) and (b) to prevent venous overlay (59).
can vary substantially between patients, the CE MRA examination needs to be tailored to the individual contrast arrival time. This is important for two main reasons: (a) to prevent ringing artifacts and suboptimal opacification of arteries in the FOV due to starting the acquisition too early (82) and (b) to prevent venous overlay (59).
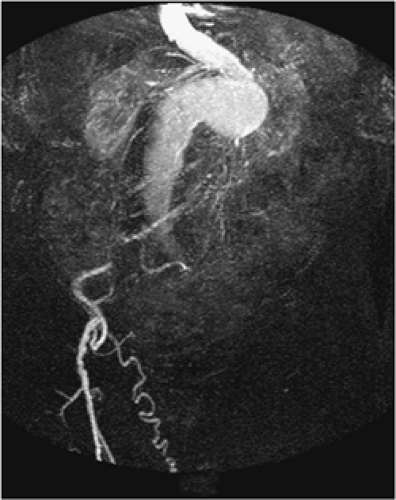 Figure 21-20 Incomplete enhancement due to aneurysm. The data acquisition was initiated too early yielding inadequate enhancement of the distal abdominal and iliac vasculature in this patient with thoracoabdominal aortic aneurysm and mimicking occlusions. |
To determine the delay between the start of injection of contrast medium and the acquisition of central k-space profiles, a 2D TR (1 to 2 seconds per image) test bolus technique can be used (83,84). The optimal scan delay time can be determined by measuring the arrival time in the infrarenal aorta of a small bolus (1 to 3 mL) of contrast medium followed by 25 to 35 mL of saline, injected at the same rate as the full-contrast bolus will be injected later on. A temporal resolution of about 1 to 2 seconds per image should be used.
The scan delay should be chosen to coincide with the frame in which maximum enhancement is observed. Acquisition orientation of the timing bolus in the coronal or sagittal plane provides the exact time at which enhancement commences as well as the rate at which enhancement progresses along the 40 to 45 cm of the arterial tree in the FOV (Fig. 21-21). Maki et al. (85) have proposed a further extension of the test-bolus technique by rapidly translating the table to the calf station in order to also determine the bolus arrival time and the time to venous enhancement in the lower leg. Knowledge about the duration between arterial and venous enhancement can then be used to tailor the subsequent 3D CE MRA examination in order to minimize the chance for venous enhancement (85).
More recently, so-called real-time bolus monitoring software packages have been introduced by all major MRI system vendors, and these are now considered by many as the state-of-the-art for peripheral CE MRA (BolusTrak, [Philips Medical Systems, Best, the Netherlands; CareBolus, Siemens Medical Solutions, Erlangen, Germany; and Fluoro Trigger General Electric, Waukesha, WI). Rather than injecting a small amount of contrast material in a separate test-bolus scan, real-time bolus monitoring allows the operator to inject the total volume of contrast material and to proceed with the 3D CE MRA acquisition when the desired signal enhancement in the peripheral arteries has been detected by the scanner or by visual feedback (86,87,88).
Chapter 5 provides an extensive discussion of the different strategies to appropriately synchronize contrast injection with image acquisition.
Strategies to Optimize Vessel-to-background Contrast
In order to present data in an easily understandable format with the vasculature readily depicted, the signal of background tissues, and fat specifically (because it has the shortest T1), needs to be eliminated.
The most commonly used technique to suppress background signal is subtraction of nonenhanced “mask” images that are identical to the 3D CE MRA volumes (Fig. 21-22). Although subtraction decreases the SNR by a factor of about 1.4 (√2– when the number of signals acquired is 1), vessel-to-background contrast improves to the extent that whole-volume MIPs become clinically useful. This has particular benefit when using injection rates below 1.0 mL/ second (89). A disadvantage of subtraction is the reliance on coregistration of the mask and CE data sets demanding table repositioning with accuracy on the order of 1 mm or less.
Another way to suppress background tissue is by spectral saturation of signal from protons in fat. Although a fat saturation prepulse can be integrated into the 3D CE MRA sequence, this may take a substantial amount of time, which may force a sacrifice in the achievable spatial resolution for a given acquisition duration. Results of using fat-saturation pulses are mixed, and their use is not universally recommended (90,91).
Strategies to Decrease Venous Enhancement
Venous enhancement is particularly challenging when imaging the lower legs and is quite prevalent in patients with cellulitis (92) and AV communications. Both are often seen in the context of diabetes mellitus (which also comprises a large subgroup of the patients with chronic critical ischemia). The depiction of the lower leg arteries is often paramount in diabetes patients, who are frequent candidates for distal bypass surgery.
Several general acquisition strategies can be used to decrease the chance for disturbing venous enhancement. These are:
increasing acquisition speed
use of a separate acquisition for the lower leg station
use of specialized k-space filling algorithms
use of a TR acquisition strategy
use of infrasystolic venous compression
The most straightforward way of preventing venous enhancement is by shortening acquisition duration first by reducing the TR and TE to the shortest possible values without excessively increasing bandwidth. In addition, partial or fractional echo should be used.
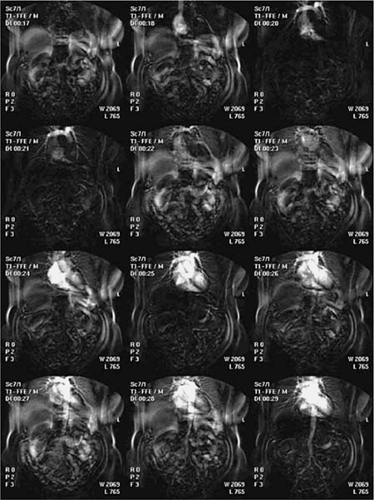 Figure 21-21 Bolus monitoring. Individual frames of TR acquisition showing contrast medium arrival and passage through the pulmonary circulation and subsequent enhancement of the systemic circulation (acquisition performed with Philips Medical Systems BolusTrak software). When the injection is started together with the start of image acquisition, the scan delay can be derived from the time displayed in the left upper corner (only frames immediately prior to and after contrast medium arrival are shown). |
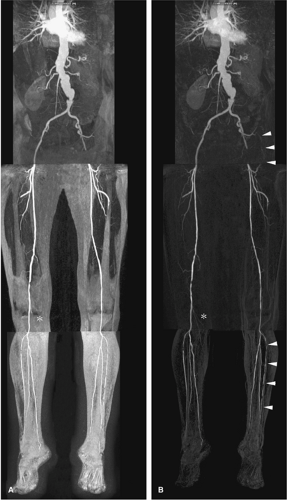 Figure 21-22 Subtraction to improve vessel depiction. Multistation CE MRA MIPs of nonsubtracted (A) and subtracted (B) data sets in a patient with an AAA and occlusion of left external iliac artery. Vessel-to-background contrast is clearly improved when image subtraction of nonenhanced “mask” scans is used. No fat-saturation prepulses were used. Note better visibility of collateral bridging occlusion and lower leg arteries (arrowheads). |
When the three-consecutive-station approach is used, it is particularly important to image the first two stations (i.e., aortoiliac and upper legs) as fast as reasonably possible. With centrically ordered k-space strategies in the lower station, relatively long (and thus high-resolution) scans can be obtained provided that no or minimal venous enhancement precedes the start of the acquisition.
Multielement (peripheral) surface coils and parallel imaging allow for further increases in acquisition speed (54,93,94). Another way to obtain venousfree images of the lower legs is to switch from a 3D high-resolution acquition to a 2D projectional acquisition, analogous to IA DSA (95). A disadvantage of this latter method is that it is generally limited to a single projection; each unique projection demands a separate injection of contrast medium.
An alternative to the sequential three-station approach is to use a dual-injection protocol in which the lower legs are imaged first and the aortoiliac arteries and upper legs are imaged afterward with a separate acquisition. The rationale for this “hybrid” approach (96) is that it is easier to obtain venousfree, high-resolution 3D images of the lower leg station. The initial acquisition of the lower legs is typically done by using up to 15 to 20 mL 0.5 M Gd-DTPA and can be either mono- or multiphasic. After completing the lower legs, a separate moving table acquisition is performed to image the aortoiliac and upper leg arteries by using the remaining volume of contrast agent (Fig. 21-23).
The greatest benefit of using the hybrid approach can obviously be expected in patients with chronic critical ischemia, patients with arteriovenous fistulas (such as in diabetes mellitus), and patients with cellulitis (95).
Another technique uses separate injections for each imaging station (i.e., three separate acquisitions are performed). Although this approach can be used in the absence of software or hardware needed for rapid table motion, a disadvantage of the multiple injection technique is that the total amount of contrast medium has to be divided into three or more separate injections, each with relatively low doses of contrast medium, while contrast material accumulates with each acquisition. Longer examination times and decreased vessel-to-background contrast may result (97).
Centric k-space filling in general allows for longer acquisition times, facilitating high resolution. These techniques can be used even if the period between arterial and venous enhancement is shorter than the total duration of image acquisition. The underlying principle is to collect central k-space profiles, which primarily determine image contrast, at peak enhancement in the arteries of interest at a time that veins are not or are only minimally enhanced (98,99). The peripheral k-space profiles are later obtained that primarily encode details in the image contributing to high resolution. When centric k-space filling is combined with parallel imaging, the chances of disturbing venous enhancement decrease even further (93,94,100) (Fig. 21-24).
Repetitive centric k-space filling can provide high spatial resolution peripheral MR angiograms with a high temporal frame rate (i.e., “TR” imaging at several seconds per frame). One popular version, time-resolved imaging of contrast kinetics (TRICKS), samples the contrast-sensitive central part of k-space more often than the peripheral resolution-sensitive views. After the acquisition is finished, central k-space lines are combined with peripheral lines through a process of temporal interpolation such that a series of TR 3D images of the vasculature are obtained (101). TRICKS can serve as the first acquisition in the tibial station for a hybrid approach to peripheral MRA.
More recently, keyhole contrast-enhanced timing robust angiography (CENTRA) was described. With keyhole CENTRA, temporal resolution is increased by repetitive acquisition of the central part of k-space only. This information is later combined with a data set containing the peripheral part of k-space, which is acquired as part of the last frame of the TR series (102). Subsequently, these “hybrid k-spaces” can be reconstructed as a series of TR 3D CE-MR angiograms (Fig. 21-25). Temporal resolution can be further increased by combining keyhole imaging with parallel imaging (103).
TR acquisitions such as TRICKS and keyhole CENTRA can obviate timing tests and a separate acquisition of precontrast images for subtraction (104). Hany et al. (105) showed that the use of TRICKS improved small, distal vessel conspicuity and reduced venous overlay in a head-to-head comparison with single injection, three-station peripheral CE MRA protocol.
Although all of these techniques have in common that they are able to reduce venous contamination, the drawback is that they all, to some extent, lead to a reduction in vessel-to-background contrast. For additional details of the techniques mentioned above, we refer the reader to Chapter 2.
Another method to reduce venous contamination is by using mid-femoral (106) or infragenual venous compression with infrasystolic pressures of 50 to 60 mmHg (106,107), with promising results (Fig. 21-26). It remains to be determined if patients with critical ischemia and/or ulcers, in which high-quality lower leg images are most important, can tolerate or benefit from this type of compression.
Combinations of the above techniques can be pursued to further reduce the risk of disturbing venous enhancement.
Resolution Requirements
The work by Hoogeveen et al. (108) and Westenberg et al. (109) has shown that at least three pixels are needed across
the lumen of an artery to quantify the degree of stenosis with an error of less than 10%. Thus, higher resolution is needed to accurately characterize stenoses in the distal lower legs or feet as opposed to the larger, proximal iliac arteries. In general, voxel dimensions should be kept as close to isotropic (equal length in all dimensions) as possible to minimize vessel blurring in those projections that introduce lower resolution with more asymmetric voxels. Recommended voxel size resolutions are about 4 to 5 mm3 in the aortoiliac arteries, 3 to 4 mm3 in the upper legs, and 1 mm3 or better in the lower legs.
the lumen of an artery to quantify the degree of stenosis with an error of less than 10%. Thus, higher resolution is needed to accurately characterize stenoses in the distal lower legs or feet as opposed to the larger, proximal iliac arteries. In general, voxel dimensions should be kept as close to isotropic (equal length in all dimensions) as possible to minimize vessel blurring in those projections that introduce lower resolution with more asymmetric voxels. Recommended voxel size resolutions are about 4 to 5 mm3 in the aortoiliac arteries, 3 to 4 mm3 in the upper legs, and 1 mm3 or better in the lower legs.
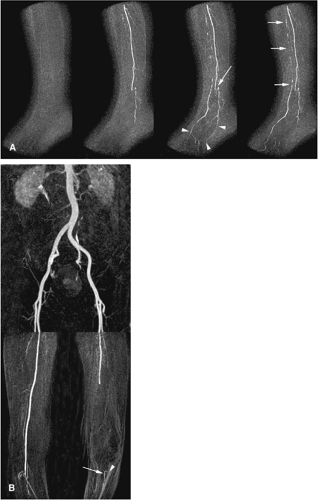 Figure 21-23 Hybrid MRA of a 64-year-old male diabetic patient suffering from chronic critical ischemia and with rest pain, imaged with hybrid approach. In (A), sequential, sagittal MIPs of 3D CE MRA data set obtained in lower leg station using 15 mL of Gd-DTPA are shown. Image acquisition was started together with the injection and lasted 30 seconds per phase. The acquired resolution of the scans is 1.0 ÷ 1.0 ÷ 1.0 mm3 interpolated to 0.5 ÷ 0.5 ÷ 0.5 mm3. In phase 1, there is no arterial enhancement; in phase 2, there is filling of the fibular artery; in phase 3, the fibular artery has filled the pedal arch (arrowheads) through a collateral to the posterior tibial artery (arrow). In phase 4, it can be appreciated that the anterior tibial artery is severely diseased (arrows) and partially is filled by the pedal arch. In (B), a coronal MIP of aortoiliac and upper leg vasculature is shown. There is a complete occlusion of the left superficial femoral artery without significant development of large collaterals. The tibioperoneal trunk (arrow) and origin of the anterior tibial artery (arrowhead) can clearly be identified. |
Contrast Media and Injection Protocols
In nearly all of the reported studies on peripheral CE MRA, conventional 0.5 M extracellular contrast agents have been used. The intravascular half-life of commercially
approved agents is about 90 seconds (110). Enough contrast must be injected to decrease the T1 of blood to values smaller than those of stationary background tissues. To selectively depict the vasculature, this means that the T1 of blood must be reduced to a value well below that of fat (T1 at 1.5 T = 270 ms).
approved agents is about 90 seconds (110). Enough contrast must be injected to decrease the T1 of blood to values smaller than those of stationary background tissues. To selectively depict the vasculature, this means that the T1 of blood must be reduced to a value well below that of fat (T1 at 1.5 T = 270 ms).
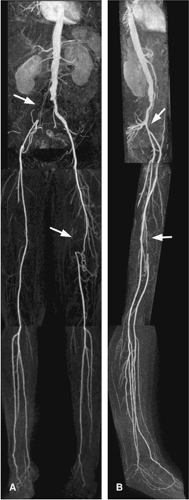 Figure 21-24 Centric k-space acquisition with SENSE. A peripheral MR angiogram was obtained in a 59-year-old patient with severe intermittent claudication. Resolution was adapted in each station, and centric k-space filling was used in the upper and lower leg stations. Parallel imaging (SENSE) was used in all stations (aortoiliac: ÷2; upper and lower legs: ÷3), resulting in acquisition times of 13 seconds, 8 seconds, and 35 seconds for the aortoiliac, upper leg, and lower leg stations, respectively. There are occlusions in the right common iliac artery and left superficial femoral arteries (arrows). |
Typically, between 0.1 and 0.3 mmol/kg of contrast agents is injected (i.e., between 15 and 45 mL for a 75-kg patient), followed by 15 to 30 mL saline injection to flush contrast from injection tubing and veins into the central venous and arterial circulations.
When a TR 2D test-bolus approach is used to image the lower legs and pedal arteries first, usually around 5 to 7 mL of contrast is used, followed by a slightly larger saline flush volume, to make sure that the contrast medium is flushed from tubing and veins into the central circulation. When a hybrid approach is used, the lower legs are usually imaged with 15 to 20 mL of contrast medium and the aortoiliac and upper leg arteries with 20 to 25 mL.
An empirical strategy that works well in clinical practice is to prescribe the contrast injection duration to last for about 40% to 60% of the acquisition duration.
The amount of contrast to be injected as well as injection speed and amount of saline flush depend on variables such as the scan duration and technique used (i.e., single vs. multiple injection). Various single and multiple-phase injection rates and different saline flush volumes have been used successfully.
In general, either a fixed rate of about 1.0 mL/s is used or dual-phase injections with higher initial injection rates of up to 2.0 mL/second for 10 to 20 mL of the contrast medium with a lower rate for the remaining contrast (as low as 0.5 mL/second) (51,111). On older and slower systems, the injection rate is usually kept to well below 1.0 mL/second (73,74).
In a recently published study, Boos and associates (80) found that increasing the amount of contrast injected as well as saline flush volume increases bolus length and improves small vessel conspicuity but does not necessarily result in higher vessel-to-background contrast (80). Conversely, injecting a fixed amount of contrast agent faster leads to a more compact and shorter bolus duration. In another study, Czum et al. (112) demonstrated that by using a dual-phase injection in which the first part of the contrast bolus is injected slowly (0.7 mL/second) and the second part of the injection is faster also improves vessel conspicuity. Sample injection protocols for standard three-sequential-station imaging, a hybrid protocol, and a 2D test bolus protocol are listed in Table 21-9. More details about MR contrast media and administration can be found in Chapter 5.
 Figure 21-25 Keyhole CENTRA. Successive frames of lower leg vasculature (A) obtained with TR (10.4 seconds/frame) keyhole CENTRA imaging technique. More proximal, the right common and external iliac arteries are occluded (B). (Image courtesy of Bernd Tombach, MD, Department of Clinical Radiology, Westfalian Wilhelms-University of Muenster, Muenster, Germany.) |
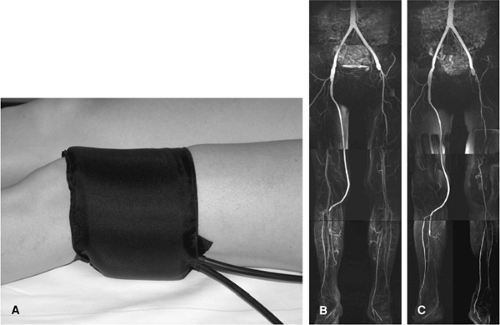 Figure 21-26 Venous compression. Supragenual placement of pressure cuff to reduce venous enhancement (A). Intraindividual comparison of three-station CE MRA with (B) and without (C) venous compression. Use of compression clearly results in less venous enhancement in the lower leg station. (Images B and C courtesy of Christoph U. Herborn, MD, Department of Radiology, Essen University Hospital, Essen, Germany.) |
Table 21-9 Suggested Injection Protocols for Commercially Available 0.5 M Gadolinium Chelates | ||||||||||||||||||||||||||||
|---|---|---|---|---|---|---|---|---|---|---|---|---|---|---|---|---|---|---|---|---|---|---|---|---|---|---|---|---|
| ||||||||||||||||||||||||||||
Novel Contrast Media
Vessel-to-background signal can also be improved by using other contrast agents than the currently used 0.5 M gadolinium chelates. Recently, the first 1.0 M agent (Gadobutrol, Schering AG, Berlin, Germany) has been approved for clinical use in and has a Europeanwide registration for CE MRA.
Gadobutrol is formulated at higher concentration of 1.0 mol/L and about 20% higher relaxivity (T1 relaxivity in blood: 5.2 mM-1s-1 at 37°C and 1.5 T), which generates lower blood T1 values compared with other commercially available contrast agents, thus offering an attractive method to increase intravascular signal (113).
 Figure 21-27 1.0 M gadolinium contrast agent. Intraindividual comparison of (A) 0.5 M (Gd-DTPA) and (B) 1.0 M (Gadobutrol; both agents: Schering, Berlin) contrast agents in a healthy volunteer. Note better visibility of branch vessels with use of 1.0 M agent. (Image courtesy of Mathias Goyen, MD, University Medical Center Hamburg-Eppendorf, Hamburg, Germany.) |
In a direct head-to-head comparison between 1.0 M and 0.5 M agents for pelvic MRA, Goyen et al. (114) found that the use of the 1.0 M agent led to significantly higher signal- and contrast-to-noise ratios and better delineation of especially small pelvic arteries (Fig. 21-27). Several other higher relaxivity contrast agents are now in phase II studies or pending approval. An overview of these contrast agents is given by Knopp et al. (115).
Magnetic Resonance Angiography Protocols and Practical Tips
Detailed recommendations for basic imaging parameters can be found in Table 21-10. Since imaging capabilities and
options vary across vendors, it is advisable to first use the vendor-specified protocols. After gaining experience, customized modifications often evolve as one learns the nuances of a given system. The recommendations below provide a useful framework and should not be regarded as absolute.
options vary across vendors, it is advisable to first use the vendor-specified protocols. After gaining experience, customized modifications often evolve as one learns the nuances of a given system. The recommendations below provide a useful framework and should not be regarded as absolute.
Table 21-10 Recommended Three-dimensional Contrast-enhanced Magnetic Resonance Angiography Sequence Parameters for Three-station Peripheral Contrast-enhanced Magnetic Resonance Angiography | ||||||||||||||||||||||||||||||||||||||||||||||||||||||||||||||||||||||||||||||||||||||||||||||||||||||||||||||||||||||||||||||
|---|---|---|---|---|---|---|---|---|---|---|---|---|---|---|---|---|---|---|---|---|---|---|---|---|---|---|---|---|---|---|---|---|---|---|---|---|---|---|---|---|---|---|---|---|---|---|---|---|---|---|---|---|---|---|---|---|---|---|---|---|---|---|---|---|---|---|---|---|---|---|---|---|---|---|---|---|---|---|---|---|---|---|---|---|---|---|---|---|---|---|---|---|---|---|---|---|---|---|---|---|---|---|---|---|---|---|---|---|---|---|---|---|---|---|---|---|---|---|---|---|---|---|---|---|---|---|
| ||||||||||||||||||||||||||||||||||||||||||||||||||||||||||||||||||||||||||||||||||||||||||||||||||||||||||||||||||||||||||||||
It is important to be aware of the patient’s ability to undergo the examination and, when needed, to have a low threshold for use of anxiolytic and analgesic agents. Given that the best MRA exams are dependent on pre- and postcontrast data set coregistration, appropriate medications to keep the patient calm and minimize the motion that can result with rest pain can substantially improve the yield of high-quality, diagnostic studies. In addition, baseline instructions to the patient regarding the importance of maintaining a consistent position are beneficial.
Tailored 3D slabs maximize the efficiency of acquisitions. Because of the relatively limited deviation of the main upper leg arteries in the anteroposterior direction, a volume with fewer partitions (hence, decreased scan time) can be used to encompass the femoral-popliteal segment when compared with the aortoiliac vasculature (Fig. 21-28). This is often facilitated by using an oblique coronal acquisition (Fig. 21-28). When the choice for less AP coverage is made, it is possible that collaterals arising from the profunda femoris artery may be (partly) excluded from the imaging volume.
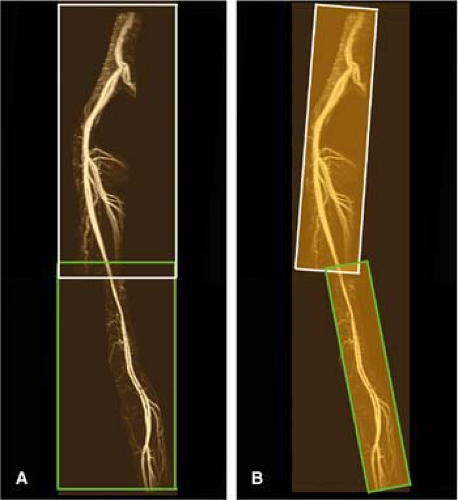 Figure 21-28 Tailored slab positioning for efficiency. A: With a fixed-slab approach, the anterior–posterior coverage must be set large enough to accommodate two distinct anatomic paths for the aortoiliac (white box) and femoropoliteal (green box) segments. B: With tailored prescriptions, the segments can be covered independently, with enhanced efficiency. Note the relative requirements of the anatomic coverage: fixed slab > tailored aortoiliac slab > femoropopliteal slab. With equivalent section thickness, scan time diminishes. |
For the below-knee segment, patient preparation involves fixation of feet with Velcro straps or rolled gauze secured with tape. The foot should be no more than 20- to 30-degrees plantar flexion, and 20- to 30-degrees exorotation is the most comfortable position. As for CT and DSA, it is important to avoid extreme plantar flexion, a position that is known to produce pseudostenosis of the dorsalis pedis from tensing of the overlying retinaculum (31). By placing soft foam padding in the popliteal fossa, the calves are suspended, which often results in less potential for venous contamination. In addition, it is useful to apply a tourniquet or blood pressure cuff just above the knee in order to delay venous enhancement (106,116).
Typical imaging parameters for the different approaches discussed previously can be found in Table 21-11. Acquisition durations, as mentioned, were empirically determined from our practices and represent a compromise between the best possible spatial resolution, temporal resolution, and desire to avoid disturbing venous overlay.
When using a 2D thick-slab technique, a temporal resolution of 3 to 5 seconds per phase ensures images free of disturbing venous overlay. The recommended default imaging period is 60 to 90 seconds (approximately 15 to 30 dynamic phases).
When the lower leg is imaged as the last acquisition of a conventional three-station run-off examination, it is safe to limit the duration to no more than 30 seconds. However,
when elliptical centric sequences in the distal station are combined with methods to reduce venous contamination, longer scan times are often successful.
when elliptical centric sequences in the distal station are combined with methods to reduce venous contamination, longer scan times are often successful.
Table 21-11 Recommended Imaging Parameters for Lower Leg and Pedal Magnetic Resonance Angiography | ||||||||
|---|---|---|---|---|---|---|---|---|
|


