Left and Right Atrium, and Right Ventricle
Left Atrium
In the early history of echocardiography, the left atrium was one of the first cardiac structures to be identified, recorded, and analyzed. A relatively oval-shaped chamber with thin, muscular walls, the left atrium is easily visualized posterior to the aortic root and superior to the left ventricle. With the advent of twodimensional echocardiography and Doppler, the shape, size, and function of the chamber could be assessed. More recently, using three-dimensional and transesophageal echocardiography, the ability to thoroughly interrogate the left atrium, including its appendage, became possible, and a complete assessment of its structure and function is now routinely performed.
Left Atrial Dimensions and Volume
The left atrium serves as a reservoir for blood draining the pulmonary veins during ventricular systole and as a conduit for that blood during early diastole. In late diastole, the left atrium becomes a muscular pump to complete the process of left ventricular filling before ventricular contraction and mitral valve closure. Thus, changes in left atrial dimensions and volumes mirror this continuous process of filling and emptying and have been a topic of intense study using echocardiographic techniques.
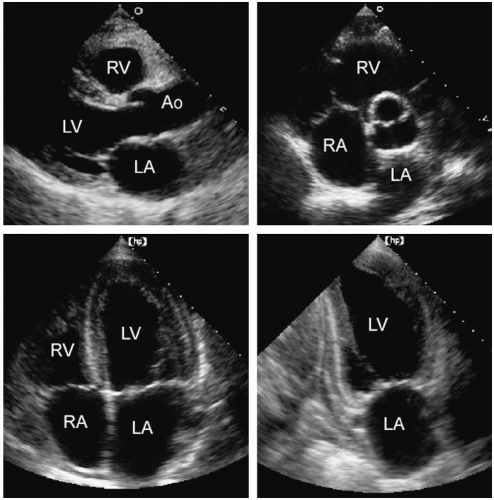 FIGURE 8.1. The left atrium can be visualized from several different echocardiographic views. |
The left atrium can be visualized in a number of echocardiographic views including the parasternal long- and short-axis and the apical four- and two-chamber views (Fig. 8.1). The major and minor dimensions, area, and volumes have been measured from each of these perspectives. Because no single tomographic view conveys complete information about a threedimensional structure, it is recommended that a combination of two or more imaging planes be used for these purposes.
In each plane, one or more linear dimensions can be measured and the area of the left atrium can be traced. Historically, left atrial size was determined using M-mode echocardiography from the parasternal window (Fig. 8.2). A linear dimension
approximating the anteroposterior plane was measured at end-systole, just before mitral valve opening (when the left atrial volume was maximal). To standardize this approach, the plane should pass through the aortic valve. In most cases, this provides a reproducible and accurate reflection of left atrial size. Because the position of the left atrium relative to the scan plane could not be determined with M-mode echocardiography, the assumption that this dimension corresponded to a true anteroposterior measurement represented a significant limitation. For example, if the recording was made from a lower interspace, an oblique dimension was obtained, and the left atrial size was overestimated. This problem can be avoided using twodimensional echocardiography, ensuring that the measurement plane is properly oriented relative to the chamber. An example of these two approaches to left atrial measurements is provided in Figure 8.3. In Figure 8.3A, dimension X (7.0 cm) is correctly aligned relative to the left atrial chamber. If a dimension along a raster line had been used, as would occur with M-mode echocardiography, dimension Y (7.8 cm) would be the result. Figure 8.3B is another example of proper alignment from a patient with a dilated left atrium.
approximating the anteroposterior plane was measured at end-systole, just before mitral valve opening (when the left atrial volume was maximal). To standardize this approach, the plane should pass through the aortic valve. In most cases, this provides a reproducible and accurate reflection of left atrial size. Because the position of the left atrium relative to the scan plane could not be determined with M-mode echocardiography, the assumption that this dimension corresponded to a true anteroposterior measurement represented a significant limitation. For example, if the recording was made from a lower interspace, an oblique dimension was obtained, and the left atrial size was overestimated. This problem can be avoided using twodimensional echocardiography, ensuring that the measurement plane is properly oriented relative to the chamber. An example of these two approaches to left atrial measurements is provided in Figure 8.3. In Figure 8.3A, dimension X (7.0 cm) is correctly aligned relative to the left atrial chamber. If a dimension along a raster line had been used, as would occur with M-mode echocardiography, dimension Y (7.8 cm) would be the result. Figure 8.3B is another example of proper alignment from a patient with a dilated left atrium.
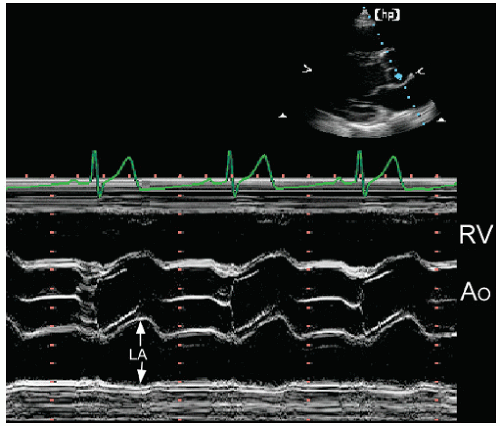 FIGURE 8.2. An M-mode echocardiogram through the base of the heart offers one approach to measuring left atrial size. By convention, the measurement is performed at end-systole when left atrial volume is greatest. |
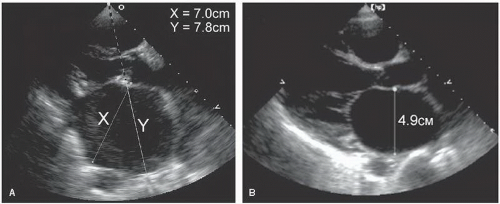 FIGURE 8.3. A limitation of M-mode echocardiography is the lack of spatial orientation. This can result in inaccurate measurement of true left atrial dimension. A: Measurement Y (7.8 cm) represents a measurement that would have been recorded using the M-mode approach. The true left atrial dimension is better approximated by measurement X (7.0 cm). Two-dimensional echocardiography provides spatial orientation and avoids the problem of oblique measurements. B: Correct orientation of a left atrial minor axis measurement is demonstrated. |
An additional challenge in measuring the left atrial size involves the precise definition of the posterior left atrial wall. In many patients, hazy, amorphous echoes can often be seen lining the posterior wall. These may be due to stagnant blood and can sometimes be eliminated by changing the gain or adjusting the angle of the transducer. Side lobes from a calcified annulus or highly reflective atrioventricular groove can also obscure the location of the posterior left atrial wall.
Although a relationship between this measurement and left atrial volume clearly exists, no single dimension can provide complete information about the true left atrial size. For example, although the left atrium usually dilates as a sphere, asymmetric enlargement can occur. Dilation of the ascending aorta can distort the anteroposterior dimension, whereas dilation of the descending aorta can encroach on the left atrium posteriorly (Fig. 8.4). Additionally, other mediastinal masses can alter left atrial shape and geometry. Figure 8.5 is an example of left atrial compression from a mediastinal lymphoma. The left atrium is completely distorted. The left atrial size cannot be assessed and the chamber’s function is obviously impaired. Thus, an accurate assessment of left atrial size requires visualization of the chamber from multiple views and an appreciation of the limitations of relying on any single plane.
Despite these potential sources of error, left atrial linear dimensions correlate reasonably well with left atrial volume derived from angiography or magnetic resonance imaging (MRI). If desired, a more direct measurement of left atrial volume can be obtained. This is typically performed at end-systole, just before mitral valve opening. A common approach involves the area-length technique from the apical four- and two-chamber views. Using this approach, the area of the left atrium is measured by planimetry of both apical views (Fig. 8.6A). Then, a linear dimension, or length, is measured from the center of the mitral annulus to the superior border of the chamber (and assumed to be the same from both projections). Left atrial volume is then calculated as
where A1 is the area in one plane and A2 is the area in the orthogonal plane, and L is the linear dimension (Fig. 8.6B). Several other formulas have been proposed and most yield similar results. Another practical approach assumes that the left atrium can be approximated by a prolate ellipse (Fig. 8.6C). The
formula for this structure is
formula for this structure is
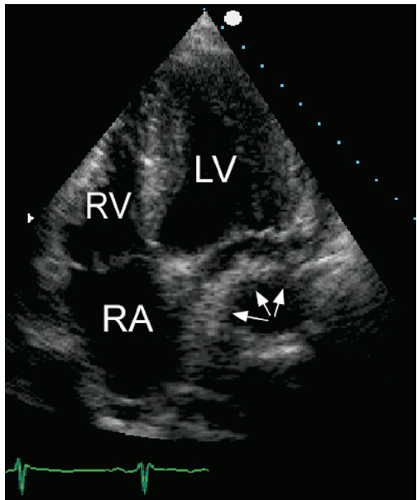 FIGURE 8.4. An apical four-chamber view is shown in a patient with a thoracic aortic aneurysm. The descending aorta (arrows) distorts the left atrial shape and creates the appearance of a mass within the chamber. |
The three diameters include the anteroposterior diameter from the parasternal long-axis and two orthogonal diameters from a four-chamber view. Three-dimensional echocardiography is being utilized with increasing frequency for this purpose and will likely become the technique of choice in the near future. Recent studies using these methods confirm the powerful prognostic value of left atrial volume in a variety of situations.
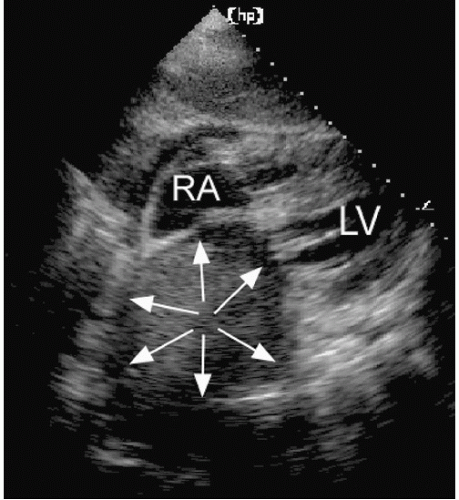 FIGURE 8.5. A subcostal four-chamber view in a patient with a mediastinal lymphoma is shown. External compression of the left atrium by the tumor creates the appearance of a mass (arrows). |
Other indirect measures of left atrial size are also available. For example, the ratio of the aortic root diameter to the left atrial
short-axis dimension provides a qualitative estimate that is often used in practice. In normal subjects, the ratio of these two dimensions is approximately 1:1. A significant change in this ratio is a useful visual indicator of an abnormal left atrial size. Similarly, bowing of the atrial septum into the right atrial cavity indicates left atrial dilation and/or elevated left atrial pressure (Fig. 8.7). This is most easily appreciated using the apical four-chamber view. Finally, isolated dilation of the left atrial appendage has been reported. Although transesophageal echocardiography is most useful for detecting left atrial appendage aneurysms, this abnormality can also be seen from a transthoracic approach.
short-axis dimension provides a qualitative estimate that is often used in practice. In normal subjects, the ratio of these two dimensions is approximately 1:1. A significant change in this ratio is a useful visual indicator of an abnormal left atrial size. Similarly, bowing of the atrial septum into the right atrial cavity indicates left atrial dilation and/or elevated left atrial pressure (Fig. 8.7). This is most easily appreciated using the apical four-chamber view. Finally, isolated dilation of the left atrial appendage has been reported. Although transesophageal echocardiography is most useful for detecting left atrial appendage aneurysms, this abnormality can also be seen from a transthoracic approach.
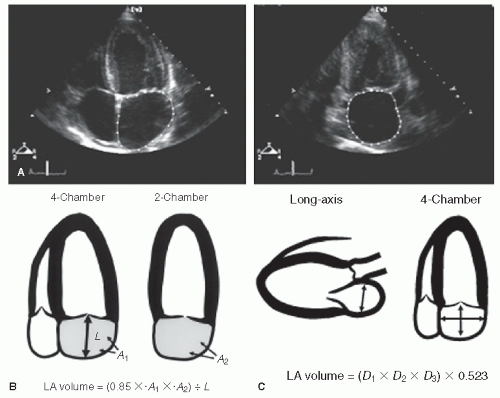 FIGURE 8.6. Left atrial volume can be measured in various ways. A: Planimetry of left atrial size from the four- (left) and two-chamber (right) views. Volume can be determined either using the area-length technique (B) or using the prolate ellipse method (C). See text for details. |
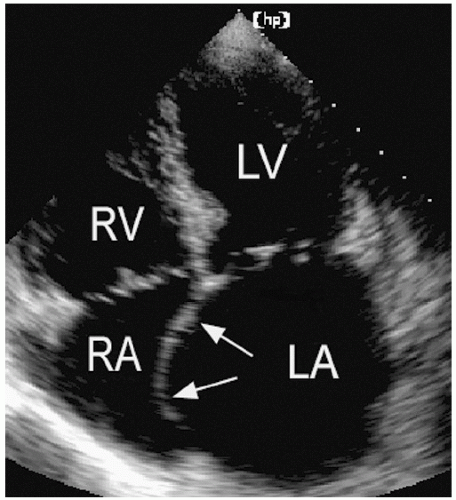 FIGURE 8.7. The interatrial septum reflects the relative pressure difference between the atria. In this example, the septum bows into the right atrial cavity indicating elevated left atrial pressure. |
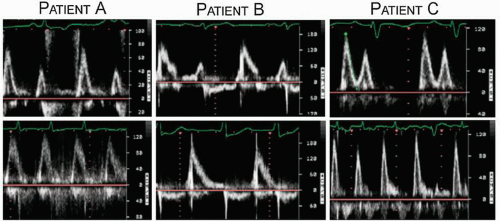 FIGURE 8.8. Three patients with atrial fibrillation are shown before (bottom) and after (top) cardioversion. Mitral inflow in each case demonstrates the absence of atrial contraction (A wave) while in atrial fibrillation, but a variable degree of recovery of atrial function after sinus rhythm is restored. |
In summary, some measure of left atrial size should be a part of most echocardiographic examinations. Linear measurements provide limited and potentially misleading data on chamber size but are easy to perform and have traditionally been reported in clinical studies. If the normally spherical left atrium is distorted, for example, linear dimensions may not accurately reflect chamber size. As a result, measuring and reporting left atrial volume is now considered a more accurate and clinically relevant approach. While this is currently performed using twodimensional imaging, it is quite likely that three-dimensional echocardiography ultimately will prove superior for this purpose.
Left Atrial Function
Although not routinely reported, left atrial function has relevance in several disease states and can be assessed using both two-dimensional imaging and Doppler techniques. Contraction of the left atrium, represented by the P wave on the electrocardiogram, occurs in late diastole and corresponds to the final phase of left ventricular filling before mitral valve closure. This is recorded using Doppler as the A wave of mitral flow. Both the maximal A-wave velocity and the A-wave time velocity integral correlate with the degree of contractility. Loss of coordinated left atrial contractility, as occurs in atrial fibrillation, is associated with the absence of the mitral A wave and sometimes the presence of small f waves. Thus, the Doppler A wave and the P wave of the surface electrocardiogram represent, respectively, the mechanical and electric manifestations of atrial systole. In most cases, their presence or absence is correlated; both are present in sinus rhythm and both are absent in atrial fibrillation. Figure 8.8 includes three examples of mitral flow from patients with atrial fibrillation before (bottom) and after (top) cardioversion. Note the prominent A waves in patient C once sinus rhythm is restored. This correlation is not always present, however. For example, immediately after cardioversion, electric activity may return, producing P waves on
the electrocardiogram, before coordinated mechanical function recovers. This results in diminutive or absent Doppler A waves, as is illustrated by patient B.
the electrocardiogram, before coordinated mechanical function recovers. This results in diminutive or absent Doppler A waves, as is illustrated by patient B.
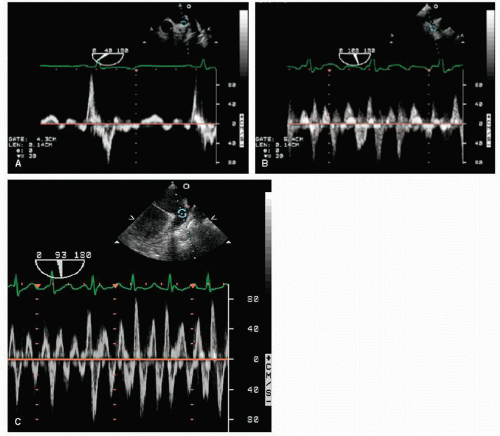 FIGURE 8.9. The left atrial appendage emptying velocity can be recorded using pulsed Doppler imaging. A: In a patient in sinus rhythm, the emptying velocity during atrial systole is approximately 60 cm/sec. In atrial fibrillation (B), the emptying velocity is variable and much lower, indicating a lack of coordinated contractility. C: Another patient during atrial fibrillation. In this case, the velocity is higher. |
With transesophageal echocardiography, left atrial appendage function can also be assessed. Using pulsed Doppler imaging, with the sample volume positioned at the mouth of the appendage, the maximal velocity during atrial contraction can be measured (Fig. 8.9). This velocity corresponds to the force of atrial appendage contraction or emptying. In normal individuals, the left atrial appendage emptying velocity is greater than 50 cm/sec. Significantly, lower velocities occur in patients with atrial fibrillation, and this finding has been associated with a predisposition for the development of left atrial thrombus and the risk of thromboembolism (Fig. 8.10).
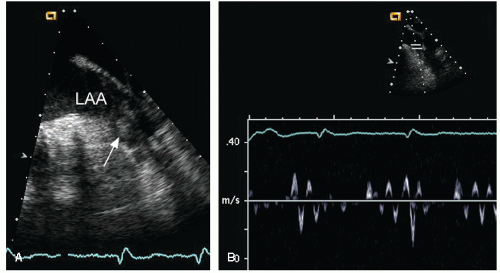 FIGURE 8.10. A: A thrombus within the left atrial appendage is shown. B: The corresponding pulsed Doppler recording demonstrates low left atrial appendage emptying velocity. LAA, left atrial appendage. |
Atrial Septum
Abnormalities of the atrial septum are relatively common and usually congenital in origin. These include a patent foramen ovale (PFO), atrial septal defect (discussed in Chapter 20), and aneurysms of the atrial septum. PFO is very common, occurring in 25% to 30% of all adults. Unlike atrial septal defect, a PFO represents a failure of the primum and secundum septa to fuse, allowing intermittent blood flow in a bidirectional fashion between the atria. Thus, the septum appears structurally intact, but shunting can be demonstrated by either contrast or color flow imaging. Occasionally, a tunnellike gap between the two portions of the septa can be intermittently visualized because the transatrial pressure gradient changes with respiration. A PFO is frequently associated with exaggerated mobility of the atrial septum and, in the extreme form, an atrial septal aneurysm. Although a PFO can be seen from transthoracic imaging (Fig. 8.11), transesophageal echocardiography is more sensitive and provides a more complete assessment. To reliably characterize a PFO, the septum must first be thoroughly examined to exclude an atrial septal defect. Then contrast echocardiography, color Doppler imaging, or both techniques should be performed. Evidence of right-to-left shunting is respiratory cycle dependent and will, therefore, be intermittent. Once contrast appears in the right atrium, shunting should occur within three or four cardiac cycles. Appearance of contrast in the left atrium after more than four beats suggests the possibility of transpulmonary shunting, usually through an arteriovenous malformation. Figure 8.12 is an example of a PFO with right-to-left shunting demonstrated using three-dimensional imaging. In Figure 8.13, a greater degree of shunting is apparent after contrast venous injection. Although precise quantification of shunting is not possible, contrast echocardiography can provide a rough estimate of the magnitude, based on the number of bubbles that appear in the left atrium within three or four beats of appearance. Figure 8.14 shows a PFO with exaggerated septal mobility and a clearly defined tunnel through which shunting is easily demonstrated. Additional information on the use of contrast techniques for the evaluation of shunts may be found in Chapter 4.
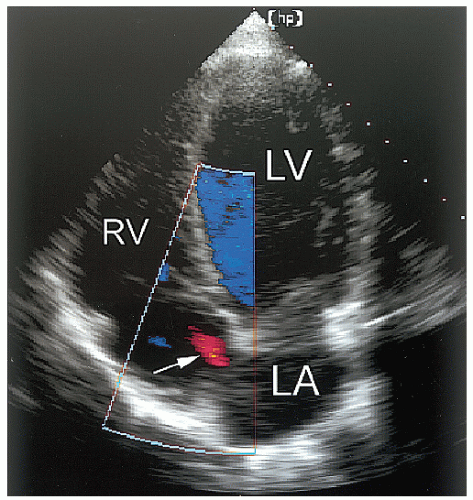 FIGURE 8.11. An apical four-chamber view with color flow mapping reveals a small patent foramen ovale (arrow). In this example, left-to-right shunting is demonstrated. |
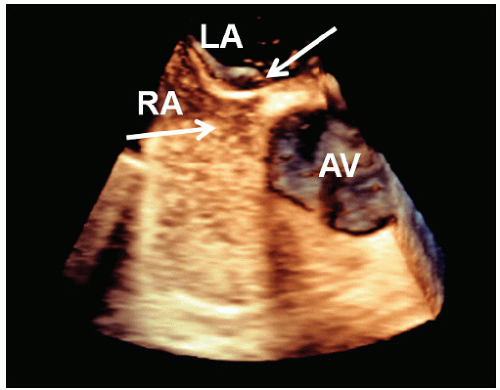 FIGURE 8.12. A contrast-enhanced transesophageal three-dimensional echocardiogram of the interatrial septum demonstrates a small patent foramen ovale (arrow). |
An atrial septal aneurysm is a redundancy of the midportion of the atrial septum that results in excess mobility and billowing of the tissue in this region (Fig. 8.15). Because some motion of the atrial septum is normal, a standardized definition of atrial septal aneurysm requires maximal deviation of the aneurysmal tissue of at least 10 mm from the plane of the septum. The motion of the aneurysm reflects the relative pressure gradient between left and right atria, and thus the outpouching will usually occur in both directions over the course of the cardiac cycle (Fig. 8.16). In the example, redundant tissue in the area of the fossa ovalis billows from left to right, reflecting the changes in relative pressure between the two atria. Figure 8.17 is a similar example, but it also demonstrates a mild degree of shunting through a PFO by color Doppler imaging. In Figure 8.18, an extreme example of atrial septal aneurysm is presented. The redundant aneurysmal tissue nearly protrudes through the tricuspid valve during diastole.
An atrial septal aneurysm can be identified by transthoracic echocardiography from the basal parasternal short-axis view or the apical four-chamber view. However, these aneurysms are more readily visualized using transesophageal echocardiography in the four-chamber view. The total excursion of the aneurysmal tissue can be assessed and the presence or absence of an associated shunt can be detected with either using color flow imaging or, more accurately, using contrast techniques (Fig. 8.19). Thrombi may form in the pouches created by the septum on either the left or the right side and may result in thromboembolic events. Atrial septal aneurysms are associated with either a PFO or an atrial septal defect in as many as 75% of cases. The combination of an atrial septal aneurysm and a PFO has recently been associated with substantial risk of thromboembolism. When an atrial septal aneurysm is detected, it is often appropriate to perform a venous saline contrast injection to search for an associated PFO because its presence may alter management.
The most important pathologic condition affecting the left atrial appendage is the development of a thrombus. This is a common complication of mitral stenosis or atrial fibrillation and is associated with an increased risk of systemic embolic events, especially strokes. Detecting left atrial appendage thrombi is, therefore, of critical importance and is one of the most common reasons to request an echocardiogram. Transthoracic
echocardiography is suboptimal for this purpose and rarely should be relied on to detect or exclude a thrombus in the left atrium. Transesophageal echocardiography, however, is a very accurate technique to interrogate the left atrium for thrombi. From a variety of planes, the appendage can be easily visualized. It lies just below the left upper pulmonary vein and is separated from the vein by a ridge of tissue. This ridge is sometimes quite prominent and may be confused with abnormal masses or thrombi (Fig. 8.20). Color Doppler is often helpful to distinguish the appendage from the pulmonary vein (Fig. 8.21). To reliably exclude the presence of a thrombus, a thorough inspection of the appendage is required. Because the appendage
is multilobed in most patients, multiple views are needed for a complete evaluation. It also contains small pectinate muscles along its surface that must be differentiated from thrombi. This topic is covered in greater depth in Chapter 23.
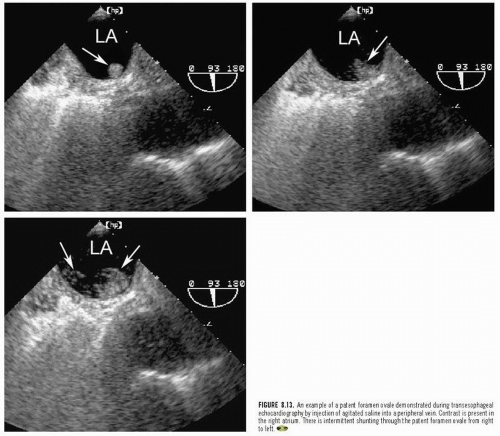 FIGURE 8.13. An example of a patent foramen ovale demonstrated during transesophageal echocardiography by injection of agitated saline into a peripheral vein. Contrast is present in the right atrium. There is intermittent shunting through the patent foramen ovale from right to left. |
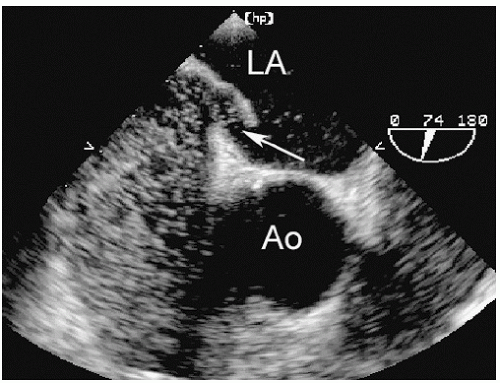 FIGURE 8.14. Contrast injection demonstrates a patent foramen ovale on transesophageal echocardiography. In this case, increased mobility of the atrial septum is present. The tunnellike gap within the interatrial septum is evident (arrow), and bubbles can be seen traversing the patent foramen ovale from right to left. |
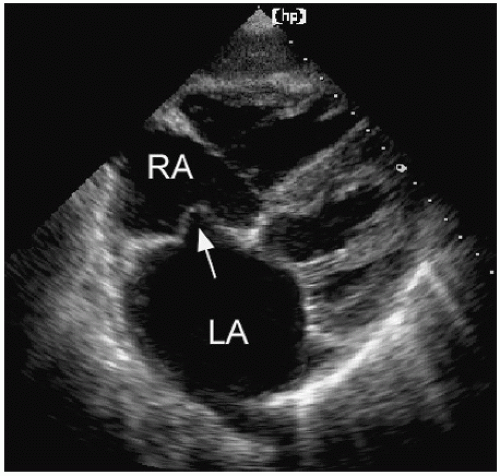 FIGURE 8.15. A subcostal four-chamber view demonstrates an atrial septal aneurysm (arrow), bowing into the right atrium. |
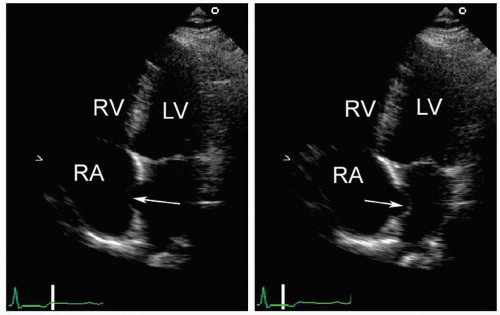 FIGURE 8.16. An atrial septal aneurysm is shown, intermittently bowing into the right and left atria. |
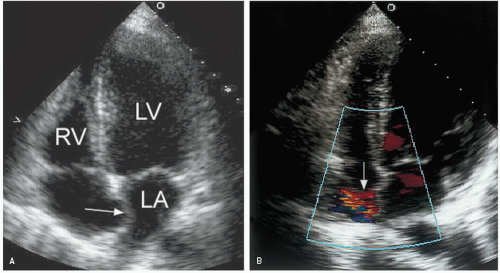 FIGURE 8.17. A: An atrial septal aneurysm (arrow) is demonstrated from the apical four-chamber view. The mobility of the midportion of the septum is evident. B: Color flow imaging confirms a mild degree of left-to-right shunting through a patent foramen ovale. |
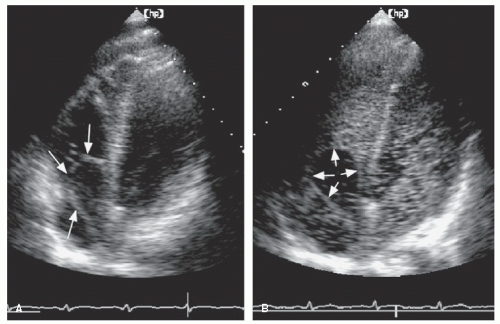 FIGURE 8.18. A: An apical four-chamber view demonstrates an extreme form of an atrial septal aneurysm with a “windsock” appearance of the aneurysmal tissue into the right atrium and partially through the tricuspid valve (arrows). B: After contrast agent injection, the windsock is outlined by the contrast that flows around it from the right atrium to the right ventricle. In addition, the presence of a patent foramen ovale allows some contrast agent to cross into the left heart. |
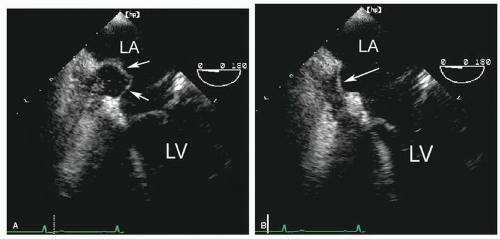 FIGURE 8.19. An example of an atrial septal aneurysm is recorded using transesophageal echocardiography. A: The redundant aneurysmal tissue billows into the left atrium (arrows). B: The arrow indicates motion of the tissue back into the right atrium. Theses images were recorded during contrast agent injection, which can be seen filling the right atrium. A few bubbles are visualized within the left atrium. This is the result of shunting through a patent foramen ovale. |
An acquired abnormality of the atrial septum is lipomatous hypertrophy. This involves fatty infiltration of the superior and inferior portions of the septum, typically sparing the fossa ovalis. Such a distribution creates a “dumbbell-shaped” appearance which, when present, allows a diagnosis of lipomatous hypertrophy to be made with confidence. Less commonly, diffuse septal infiltration of fatty tissue occurs. In these cases, the condition may be confused with malignancy or thrombus, and imaging with MRI may be helpful to distinguish fatty tissue from tumor and/or thrombus.
Pulmonary Veins
In most normal individuals, four distinct pulmonary veins drain blood from the lungs to the left atrium. These four veins enter
the left atrium relatively close together along the superior portion of the posterior wall. The veins from the left lung enter laterally, whereas the veins from the right lung enter more medially. It is often possible to visualize the entrance of one or two pulmonary veins into the left atrium using transthoracic echocardiography from the four-chamber view. An example of this is provided in Figure 8.22. From this same view, a recording of pulmonary venous inflow is possible. This is best accomplished by first using color flow imaging to identify one or more veins and then positioning the pulsed Doppler sample volume within the mouth of the vein as it enters the left atrium. Using this approach, pulmonary venous flow patterns can be recorded routinely, and several examples are provided in Figure 8.23. A unique view to record the pulmonary veins is the “crab view,” which is recorded from the suprasternal notch with some posterior angulation. Directly below the right pulmonary artery, the posterior wall of the left atrium is visualized and the pulmonary veins occasionally can be recorded.
the left atrium relatively close together along the superior portion of the posterior wall. The veins from the left lung enter laterally, whereas the veins from the right lung enter more medially. It is often possible to visualize the entrance of one or two pulmonary veins into the left atrium using transthoracic echocardiography from the four-chamber view. An example of this is provided in Figure 8.22. From this same view, a recording of pulmonary venous inflow is possible. This is best accomplished by first using color flow imaging to identify one or more veins and then positioning the pulsed Doppler sample volume within the mouth of the vein as it enters the left atrium. Using this approach, pulmonary venous flow patterns can be recorded routinely, and several examples are provided in Figure 8.23. A unique view to record the pulmonary veins is the “crab view,” which is recorded from the suprasternal notch with some posterior angulation. Directly below the right pulmonary artery, the posterior wall of the left atrium is visualized and the pulmonary veins occasionally can be recorded.
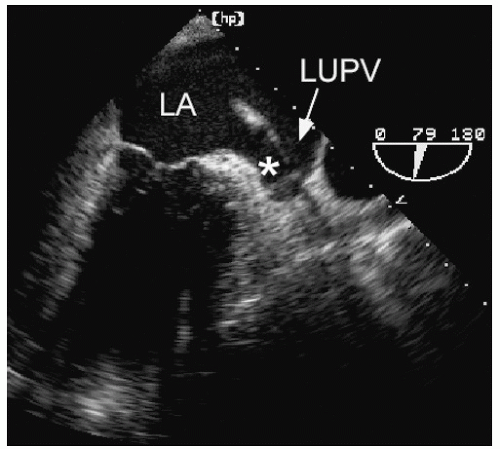 FIGURE 8.20. A transesophageal two-chamber view demonstrates the relationship between the left atrial appendage (*) and the left upper pulmonary vein (LUPV). The ridge of tissue separating the two is sometimes mistaken for a mass or a thrombus. LA, left atrium. |
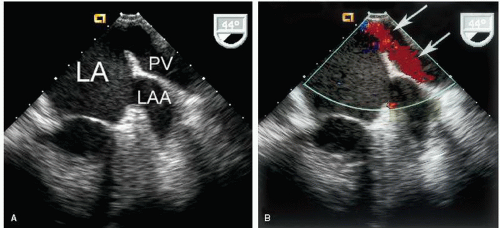 FIGURE 8.21. The relationship between the left atrial appendage (LAA) and the left upper pulmonary vein (PV) is readily demonstrated with transesophageal echocardiography (A). Differentiating between the two structures can often be accomplished using color flow imaging to document flow within the vein (arrows) (B). |
The entrance of the pulmonary veins into the left atrium is more completely recorded using transesophageal echocardiography. In most patients, all four veins can be visualized. To record the left pulmonary veins, a vertical imaging plane is used and the transducer is rotated to the patient’s far left (Fig. 8.24). The atrial appendage may be useful as a landmark to identify the left upper vein. Then, by gradually advancing the probe, the lower vein is seen. To record the right veins, set the imaging plane to 45° to 60° and rotate the shaft of the probe clockwise to the patient’s far right. The right veins are usually seen together, forming a V shape as they drain into the left atrium (Fig. 8.25). Normal pulmonary venous flow has three phases: antegrade flow occurs in systole and early diastole and some retrograde flow occurs after atrial contraction in late diastole (Fig. 8.26A). The ratio of peak flow velocity in systole and diastole and the duration of the retrograde pulmonary venous A wave are useful parameters in the assessment of diastolic dysfunction. This topic is covered in Chapter 7. In addition, retrograde flow into the pulmonary veins in late systole can be observed in patients with severe mitral regurgitation. A variety of pathologic states are also associated with abnormal pulmonary venous flow, including mitral stenosis, constrictive pericarditis, and restrictive cardiomyopathy. Figure 8.26B is an example of abnormal pulmonary venous flow in a patient with ischemic cardiomyopathy and elevated filling pressure. Note that the inflow occurs almost exclusively during diastole, indicating high left ventricular filling pressure and restrictive physiology. Stenosis of the pulmonary veins can be either congenital or acquired. An example of pulmonary vein stenosis occurring as a result of an atrial fibrillation ablation procedure is shown in Figure 8.27. In this example, color Doppler demonstrates increased, turbulent flow and the stenosis is confirmed on the spectral Doppler tracing. Figure 8.28 demonstrates increased pulmonary venous flow velocity from a patient with left-to-right shunting through an atrial septal defect. Finally, transesophageal echocardiography is very useful to demonstrate anomalous pulmonary venous connections, either in isolation or in association with atrial septal defects. This is discussed in detail in Chapter 20.
Stay updated, free articles. Join our Telegram channel

Full access? Get Clinical Tree


