Fig. 7.1
Schematic representation of the total lung capacity and its various subdivisions (for explanation of the abbreviations, see text)
The TLC, RV, and FRC are “static” lung volumes (also referred to as “absolute” volumes), whereas all the others are “dynamic.” The static lung volumes depend on the interactions between the compliance and elastic recoil of the lung and of the chest wall, as well as on the strength of the respiratory muscles. Diseases and conditions affecting the lung parenchyma such as fibrosis, interstitial lung disease, pulmonary edema, atelectasis, etc. are characterized by low lung compliance that limits the distensibility of the lungs, and thus the TLC. The same is true for conditions limiting the expansion of the chest wall, either due to chest wall deformity (severe kyphoscoliosis, asphyxiating thoracic dystrophy, etc.), and/or due to respiratory muscle weakness (e.g., spinal muscular atrophy). The FRC depends on the balance between the elastic recoil of the lungs and of the chest wall. The RV depends on the expiratory muscle strength, the elastic recoil of the lung and of the chest wall, and on the airway closure. Thus, elevated RV can occur both due to premature airway closure as in obstructive lung diseases, but also due to thoracic cage abnormalities or expiratory muscle weakness that prevent the chest wall from returning to its neutral position. In a normal healthy lung the various measured volumes and capacities are in a specific and pretty consistent relationship to each other, that changes relatively little throughout life (Table 7.1).
Table 7.1
Relationships between lung volumes and capacities
Index | Relationship to TLC | Relationship to each other |
|---|---|---|
FVC (or SVC) | FVC/TLC: ~75 % | |
FRC | FRC/TLC: ~50 % | |
IC | IC/TLC: ~50 % | IC/FVC: ~66 % |
RV | RV/TLC: ~25 % | RV/FRC: ~50 % |
ERV | ERV/TLC: ~25 % | ERV/FRC: ~50 % |
IRV | IRV/TLC: ~40 % | IRV/IC: ~80 % |
Lung volumes can be measured with three basic methods. It is beyond the scope of this chapter to explain in detail the theory behind and the technical aspects of each method. However, it is important to know and understand their basic differences because they often have a direct impact on the interpretation of the results. The first method is based on gas dilution. Its two most common applications are the Helium dilution and the Nitrogen washout. In the Helium dilution technique, the patient is breathing a tracer gas (Helium) from a container with known volume. When steady state is achieved, the Helium is equilibrated between the lungs and the container. The difference in the volume of the container before and after the equilibrium has been achieved is assumed to represent the FRC. In the Nitrogen washout, the patient is breathing 100 % oxygen that “washes” the nitrogen out of the lungs. Since the nitrogen exists in a fixed concentration in the lungs and it is not diffused into the blood stream like the oxygen, the measured amount that is washed out can be used to calculate the FRC. Both techniques are performed while the patient breathes with regular tidal breaths and thus they require minimal cooperation from the patient.
The second method is the body plethysmography that measures the compressible thoracic volume during a panting maneuver. The technique is sensitive, reproducible and accurate. However, it requires a certain level of cooperation from the patient that cannot be achieved by young children. Body plethysmography measures the air in the thoracic cavity (TGV), not just in the lungs. The third method is the estimation of lung volume from standard chest radiographs (or from computed tomography) based on mathematical formulas that measure the volume within the perimeter of the thoracic cage and the diaphragm (minus the volume of the mediastinum). This technique is very rarely used in clinical practice especially in pediatrics.
In a healthy normal individual there is very little difference between the measurements made by the gas dilution techniques compared with those obtained by body plethysmography. However, significant differences do exist when measurements are made in patients with obstructive lung disease. This is because the gas dilution techniques are measuring the communicating gas volume whereas the body plethysmography measures the compressible gas volume in the thoracic cavity. Thus, in cases of severe air-trapping or of non-communicating air-filled cystic lesions, the gas dilution techniques tend to underestimate the lung volume. On the other hand body plethysmography may overestimate the lung volume because it may take into account even air that is not in the thoracic cavity (e.g., abdominal “bloating,” or large oropharyngeal cavity). Therefore, when comparing results it is important to know what technique was used for each of the measurements. Ideally, both techniques should be used. In such case, the difference between the TGV and the FRC is assumed to represent the true air-trapping.
Interpretation
The critical parameter for the interpretation of lung volumes is the TLC. If it is below the predicted normal values then there is loss of lung volume. An increased TLC can be found either in cases of generalized hyperinflation or in individuals with large lungs (fairly commonly seen in athletes). What determines the type of a disease process (i.e., restrictive or obstructive) is the relationship of the TLC to its subdivisions. Thus, in a healthy individual the TLC and all of its subdivisions are within the normal range and proportional to each other as outlined in Table 7.1. Similarly, in restrictive lung defects, the TLC and all of its subdivisions are proportionately decreased, so the ratios of the various subdivisions to TLC remain the same as in a healthy lung. In contrast, in obstructive lung diseases the TLC can be normal, increased (in case of generalized hyperinflation) or even decreased (in case of a mixed defect). However, regardless of the actual value of TLC, the ratios of RV/TLC, FRC/TLC are increased and as a result the VC and the IC are going to be decreased.
There are very limited data on lung volumes for non-Caucasians. Blacks are supposed to have smaller lung volumes than whites by approximately 15 %. In some PFT laboratories, the software automatically subtracts 15 % of the predicted normal values for whites but in others this has to be done manually, otherwise all black patients will appear to have a “restrictive lung disease.” Thus, when interpreting a test that was performed in an outside laboratory, it is very important to determine what predicted normal values the laboratory is using. There is very little information on lung volumes for other racial groups (although Hispanics tend to have values that are more similar to whites than blacks).
Evaluation of the Airway Function
Background
The respiratory tract is essentially a continuum that starts from the nose and ends in the alveoli. For purposes of convenience the different segments of the respiratory tree are classified as into “upper” airways, that consist of the nose, pharynx, larynx and the extrathoracic part of the trachea, and the “lower” airways, that include the intrathoracic trachea, and all generations of the bronchii. The intrathoracic airways are further divided into the large or “central” airways (main stem, lobar and segmental bronchii) and the small or “peripheral” airways. These distinctions are useful because different diseases processes and conditions affect primarily or selectively some but not all (or at least not to the same degree) of these groups.
The evaluation of the airway function essentially refers to the direct or indirect measurement of the resistance to airflow posed by the airways. Although direct measurements of the airway resistance can be made, the most commonly used evaluation in clinical practice is the spirometry/maximal expiratory flow–volume curve (MEFVC) (Fig. 7.2). The test is performed with a forced exhalation from TLC to RV, the latter being the point when there is no more flow. The exhaled volume is plotted against time, thus allowing its extrapolation into flow rate. Measurements are being made either on volumes exhaled in a particular unit of time (e.g., FEV1 is the volume exhaled during the first second of exhalation) or in terms of flow rate at specific levels of lung deflation. Although measurements can be made at any level, the standard measurements usually include the maximal expiratory flow (FEFmax), and the forced expiratory flow rates when 25 %, 50 % and 75 % (FEF25, FEF50 and FEF75) of the FVC has been exhaled. The average flow rate between 20 and 75 % of FVC (FEF25–75) is also calculated.
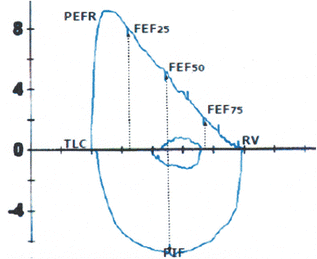

Fig. 7.2
Normal maximal expiratory and inspiratory flow–volume curve depicting the various indices of lung function. Note the difference in the shape of the expiratory and inspiratory curves as well as the small size of the tidal breath relative to FVC
The rationale for and clinical significance of these measurements is based on the fact that the volume of exhaled air and the flow rates measured in the beginning of exhalation (roughly during the first 25 % of the vital capacity) reflect primarily the resistance to airflow posed by the large airways, whereas the flow rates measured towards the end exhalation (generally after 50 % of the vital capacity has been exhaled), reflect primarily the resistance of the small peripheral airways. Thus, the test provides not only a quantitative assessment of the obstruction but it can also specify which part of the tracheobronchial tree is primarily affected. More specifically, the proximal portion of the MEFV curve (approximately between 100 and 75 % of the FVC) reflects the function of the large airways (distal trachea, main stem bronchii, segmental bronchii) and is represented primarily by the PEFR, FEF25 and in part by the FEV1. The middle portion of the curve (reflected by the FEF25, FEF50, and in part by the FEV1 and the FEF25–75) represents the function of the medium sized central airways. The distal portion of the curve (represented by the FEF75 and in part by the FEF25–75) reflects the function of the small peripheral airways.
One of the major advantages of the MEFVCs is that they are in part “effort independent.” The beginning of the forced exhalation (that includes the FEFmax, the FEV1, and the FEF25), depends primarily on the strength of the expiratory muscles and on the overall understanding and cooperation of the patient and therefore it is “effort dependent.” In contrast, the later part of the exhalation depends entirely on the elastic recoil of the lungs, and thus it is “effort independent.” Figure 7.3a, b illustrates this point. Figure 7.3a shows three superimposed curves with the same vital capacity but with different degree of effort during exhalation. Although the FEFmax, the FEF25, and the FEF50 vary significantly between the different curves, the flows at the distal end are virtually identical. Similarly, in Fig. 7.3b there are several superimposed MEFV curves produced with the same amount of effort but from different volumes. The curves are very different in their proximal (effort dependent) limb, but they are virtually identical in their distal end that consists of the effort independent portion. As a result measurements made in the effort dependent portion of the MEFV curve should be interpreted with caution especially if there is doubt about the amount of effort the patient made.
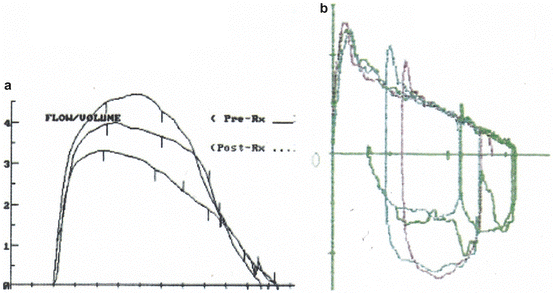

Fig. 7.3
(a) Three superimposed expiratory flow–volume curves with virtually the same FVC, but produced with different effort. As a result there is significant difference in the measured FEFmax and FEF25. However, there are no differences in the distal end of the MEFVC that is the effort-independent portion. (b) Multiple MEFVCs with different volume but produced with the same amount of effort. The MEFVCs differ in the FVC but their distal (effort independent) portion is superimposable
The function of the upper airways can be evaluated with the performance of maximal inspiratory flow–volume (MIFV) curves produced with a maximal breath from RV to TLC. In contrast with the triangular shape of the MEFV curve, the MIFV curve of a person with normal extrathoracic airways has a semicircular shape (Fig. 7.2). As a result, the maximal inspiratory flow occurs at approximately 50 % of the VC, thus corresponding with the FEF50 and not with the FEFmax that is measured in the very beginning of forced exhalation. In a healthy lung with normal airways the ratio of FEF50/FIFmax is approximately 1.
Interpretation of Maximal Expiratory Flow–Volume Curves
Disease processes affect not only the values of measured parameters but the overall shape of the MFVCs as well. Thus, a fairly accurate qualitative assessment of the nature of the problem can be often made by the visual inspection of the curves. The following patterns can be identified.
“Normal” (Fig. 7.2): The expiratory curve that has the shape of a “right triangle,” with a sharp peak and a straight (and occasionally convex) descending limb (in reality, the angle between the ascending limb and the horizontal axis is less than 90°). The inspiratory MFV curve has a very different configuration resembling “half-circle.”
“Obstructive” (Fig. 7.4): The MEFV curve of a patient with obstructive lung disease has a characteristic concave appearance. The degree of concavity varies and it may involve only part or the entire length of the expiratory limb. The small, peripheral airways are the first and more severely affected, whereas the larger airways can be relatively spared. It is not uncommon, to have significant (even severe) decrease in FEF25–75 but “normal” FEV1 and FEFmax. It is important to note that the inspiratory MFVC is usually not affected in obstructive lung defects.
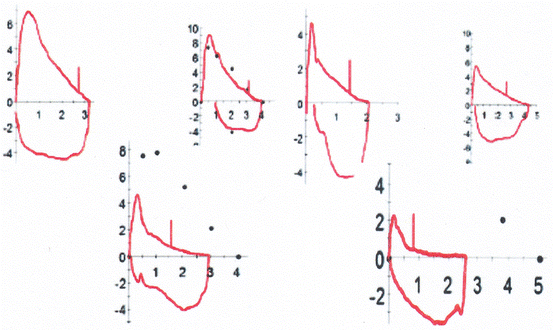
Fig. 7.4
Different variations of lower airway obstruction. All MEFVCs show concavity in their distal end indicating small airway obstruction but only some show significant involvement of the large airways. Note that in all of them the degree of lower airway obstruction has minimal or no effect on the inspiratory flows
“Restrictive” pattern (Fig. 7.5): The MFEV curve in restrictive lung defects may look like a “miniature” normal. However, because they are usually associated with conditions that cause an increase in the elastic recoil of the lungs, the produced expiratory flow rates are higher than normal and the MEFVC has a very tall and narrow shape, almost resembling an “isosceles triangle.” In such cases, the inspiratory MIFV curve may be a “mirror image” of the MEFV curve.
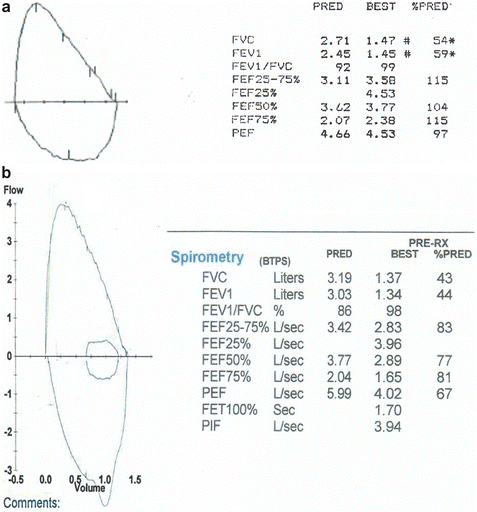
Fig. 7.5
(a) The MEFVC in patients with restrictive lung defect often resembles a “miniature” of a normal MEFVC. (b) Severe restrictive lung defects (often seen in patients with chest wall muscle weakness) present with a characteristic tall and narrow flow–volume curve, in which the inspiratory curve appears like a “mirror-image” of the expiratory curve
“Variable intrathoracic soft tissue obstruction” (Fig. 7.6): Conditions such as tracheobronchomalacia that affect the large and central airways, produce a characteristic flattening of the proximal portion of the MEFVC. In such cases the maximal inspiratory flow–volume curve is usually normal.
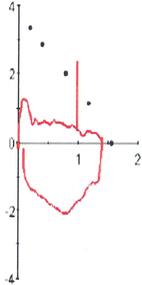
Fig. 7.6
Patient with severe tracheobronchomalacia following repair of tracheoesophageal fistula at birth. The airway closes almost immediately after the beginning of exhalation limiting all the measured expiratory flow rates. However, there is virtually no effect on the inspiratory flows
“Variable extrathoracic soft tissue obstruction” (Fig. 7.7): Affected patients have a very characteristic flattening of the inspiratory portion of the MFVC, whereas the expiratory portion remains unaffected. A ratio of FEF50/FIFmax > 1.2 is highly suggestive of variable extrathoracic soft tissue obstruction.
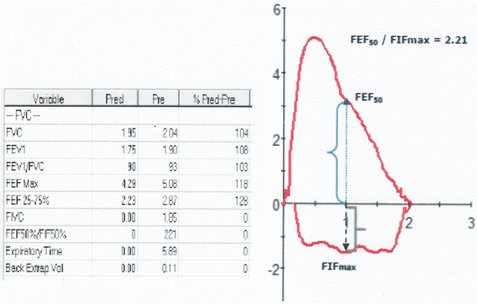
Fig. 7.7
The inspiratory flow–volume curve is flattened limiting the maximal inspiratory flow (FIF50) to less than half of the FEF50 . The expiratory flow–volume curve is normal. Similar picture can be seen in a healthy normal individual due to closure of the vocal cords during inspiration. Thus, it is imperative to document that the flattening of the inspiratory flow–volume curve occurs consistently in all the efforts
“Fixed airway obstruction” (Fig. 7.8): A fixed airway obstruction produces a very characteristic flattening of the inspiratory and expiratory portions of the MFVC (Fig. 7.8a). In such cases the obstruction is in the large intrathoracic airways (e.g., vocal cords, subglottic space, mid-trachea). Affected patients present with a biphasic (inspiratory/expiratory) sound that is a mixture of “harsh wheeze” and “muffled stridor.” The noise will be worse with activity and diminishes during sleep due to the shallow breathing. Although fixed airway obstruction is usually due to a structural abnormality, it can be also caused by functional disorders such as vocal cord dysfunction (Fig. 7.8b). The patient may present with severe inspiratory/expiratory wheezing, not responding to any treatment and they are usually anxious or panicky. If they can perform spirometry they produce a picture of very severe fixed airway obstruction that resolves spontaneously as soon as the patient relaxes (Fig. 7.8c).
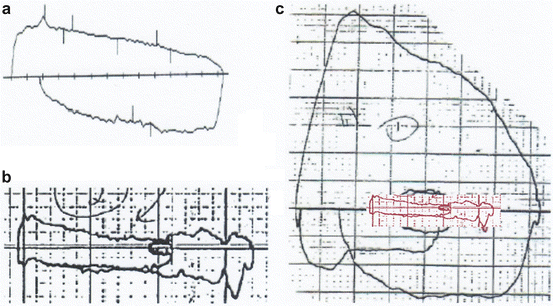
Fig. 7.8
(a) Acquired tracheal stenosis secondary to radiation therapy for lymphoma. The fact that both the expiratory and inspiratory flow–volume curves are flattened to the same degree indicates that the obstruction is very high up in the tracheobronchial tree (mid-trachea). (b) The test shows very severe fixed airway obstruction. The patient had audible inspiratory and expiratory wheezing but no hypoxemia. (c) Repeat effort a few minutes later produced a normal flow–volume curve. The patient had received no medication but she had been distracted through conversation. This is characteristic of vocal cord dysfunction
Pitfalls in the Interpretation of MEFVCs
There are several potential pitfalls in the performance of MFVCs that may affect their interpretation. The most common ones, especially among young children are due to poor technique/effort.
1.
Get Clinical Tree app for offline access

“Incomplete” (Fig. 7.9): the patient stopped the exhalation prematurely, before it reached the point of RV. This is reflected in the abrupt termination of the expiratory flow (vertical drop) and it is a common problem with young children and/or with patients who cannot exhale for several seconds. When this occurs, the computer software, “assigns” the point of the cessation of flow as the RV, thus underestimating the value of the true FVC and overestimating the values of the FEFs. This combination of decreased FVC and increased expiratory flow rates can be easily misinterpreted as “restrictive lung defect” when in fact the lung function may be normal or obstructive. Thus, it is imperative to verify whether the measured parameters correlate with the shape of the MEFVC.
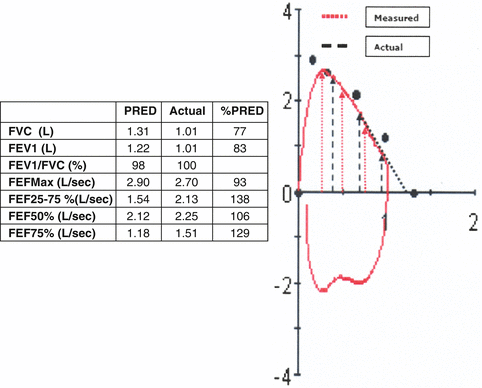

Fig. 7.9


The patient interrupted the exhalation prematurely as indicated by the vertical drop of the descending limb. As a result, the FVC is underestimated and the expiratory flow rates (red dotted arrows) overestimated. The black dashed arrows and line represent what the true flows and FVC would have probably been had the patient exhaled completely. Although most of the measured values are erroneous, one can still infer that the lower airway function is probably within the normal range because the flow–volume curve is convex, the FEV1 and the FEFmax (that are not affected by the premature inspiration) are within the normal range, and even the FVC although underestimated is borderline normal. It should be noted that interpretation of the test without examining the flow–volume curve would have led to the erroneous conclusion of a mild restrictive defect based on the borderline “low” FVC and the disproportionately increased FEFs
Stay updated, free articles. Join our Telegram channel

Full access? Get Clinical Tree


