Fig. 10.1
Height- and age-adjusted spirometry outcomes across the life-span among healthy males. Figure re-drawn from tables published in Stanojevic et al. [7]
Interpretation of Reference Data
Interpretation of reference ranges is often based on the assumption that the values observed in the sample population are normally distributed, such that 95 % of the values will fall within approximately two standard deviations (SD) of the mean. Values outside the reference interval (mean ± 2 SD) do not necessarily indicate abnormality or pathology, but rather they imply that the result is unusual in that it lies outside the range within which approximately 95 % of the reference population lies. Test results outside the reference ranges should be investigated further, with repeat assessments or additional investigations. Reference ranges also facilitate the standardization of results, such that individuals can be monitored over time to identify significant declines in lung function. Accurate identification and interpretation of changes in lung function as a result of disease or treatment require knowledge of normal variability over time within healthy subjects [8]. Since interpretation of longitudinal data may be biased when cross-sectional equations are used to interpret repeated measurements [3], longitudinal reference equations are preferable to understand how an individual lung function should change with growth. However, in the absence of longitudinal growth charts, repeated measurements should be interpreted in the context of the patient’s somatic growth and clinical symptoms.
How Is a Reference Equation Constructed?
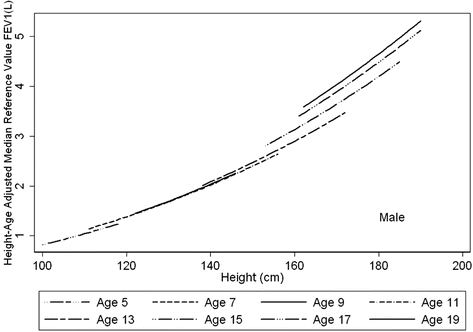
Most spirometry reference equations have been developed using linear regression techniques expressing each outcome (e.g., FEV1, FVC) measurement as a function of both height and age, with separate equations for males and females. The relationship between lung function and age is complex, particularly during adolescents, when somatic growth and lung growth are not synchronized (Fig. 10.2). As a result various strategies have been used to address this asymmetric growth, for example, logarithmic transformations, age-specific equations, and more recently the LMS (Lambda, Mu, Sigma) method.


Fig. 10.2
Height trends in FEV1 at eight specific ages. The age trend demonstrates that, for any given height, age is as important to consider in determining the reference range, especially during puberty. In contrast to adulthood where there is a decline with age, throughout childhood, at any given height an older subject can be expected to have higher values of lung function. This effect is most marked during puberty. Figure adapted with permission of the American Thoracic Society (from Stanojevic et al., AJRCCM 2008 [9]). Copyright 2013 American Thoracic Society
Physicians and parents will be familiar with growth charts for height and weight. The LMS method is a statistical technique designed specifically to construct growth charts (birth weight, height, weight, BMI, blood pressure), and has been used widely for this purpose. The method is an extension of regression analysis that depends on fewer assumptions. When applied to lung function data, the growth charts become three dimensional since lung function measures depend on both height and age.
Obtaining Good-Quality Pulmonary Function Data
Appropriate interpretation of PFT results relies on the assumption that spirometry has been performed according to standard guidelines and that flow-volume curves are inspected for acceptability and reproducibility [10–12]. Poorly performed maneuvers may give the appearance of disease where none is present.
Obtaining a good-quality result in young children (ages 3–6 years) is challenging but not impossible. Indeed, children of preschool age generally have short attention spans and are easily distracted, and at one time they were also thought to lack the coordination to perform tests which required active participation [13]. Young children, typically those under 6 years, are unable to meet the quality standards set for adults [14, 15]. This is partly due to the fact that spirometry measures the volume and speed (flow) with which air can be forcefully expired from the lungs after a maximal inspiration and therefore depends on both the coordination and strength of the chest wall muscles to maintain pressure. Many preschool children have not developed the chest wall strength necessary to maintain prolonged exhalation. Furthermore, the natural development of the lungs means that young children have relatively large airways compared to their lung volumes, increasing the likelihood that they will expire to residual volume in less than 1 s [16]. This means that attempts to maintain a forced expiration for 6 s, as specified by adult quality control criteria [11], are not feasible, and in some cases nor is the assessment of FEV1. Consequently, measures of the forced expiratory volume in 0.75 s (FEV0.75) may be more relevant in young children with small lung volumes [17, 18]; it has been shown that FEV0.75 provides similar information to FEV1 [15, 19].
Manufacturers of PFT equipment have also developed age-appropriate breath-activated software animations that help to maintain the child’s interest during measurements. The animations help to break down the technique into components, so that the child learns in a way that is appropriate to its development. Furthermore, the level of difficulty is adjusted for lung volume and experience, to encourage an appropriate effort for each individual child [20]. There are now published and accepted standards for preschool children, which will facilitate future studies [10]. Since these adaptations have been implemented, there has been an increasing volume of literature demonstrating the feasibility of performing spirometry in preschool children and the clinical utility of these techniques.
Interpretation of Pulmonary Function Data
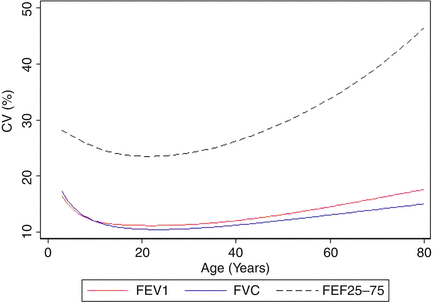
Clinicians in respiratory medicine have become familiar with the concept of expressing lung function as percent predicted ([observed/predicted] × 100), where the predicted value is derived from reference equations. The limitation of using percent predicted is that it does not take into account the natural variability of the measurement in healthy individuals, which is different depending on the lung function parameter, age, height, and sex. For example, as shown in Fig. 10.3, for FEV1 in 20–30-year-old adults, the between-subject coefficient of variation (CV) is 10 %, so the normal range (encompassing 95 % of the population at that age) corresponds to 80–120 % predicted. However, for older individuals and younger children the coefficient of variation is higher, leading to a wider range of normal (60–140 % predicted) (Fig. 10.4).


Fig. 10.3
Between-subject variability, expressed as the coefficient of variation (CV) for each of the three spirometric outcomes (FEV1, FVC, and FEF25–75). A CV of 10 % corresponds to the 95 % limits of normal (80–120 % predicted). As can be seen, the CV for FVC and FEV1 is near 10 % only over the age range of 15–35 years. The variability at other ages and for FEF25–75 at all ages is considerably greater. Figure adapted with permission of the American Thoracic Society (Stanojevic et al., AJRCCM 2009 [7]). Copyright 2014 American Thoracic Society

Fig. 10.4
Age-dependent lower limit of normal, in contrast to a fixed cutoff of 80 % predicted. Despite considerable debate on the limitations of percent predicted to express PFT results [21–23], its usage remains commonplace in clinical settings. Overdependence on fixed cutoffs to define abnormality, irrespective of well-recognized age-related changes, further magnifies these problems [11, 24–27]. Figure adapted with permission of the European Respiratory Society (Quanjer et al. [28])
A better approach to reporting lung function measures is to express results as z scores (or standard deviation (SDS) scores). The z score is a mathematical combination of the percent predicted and the between-subject variability to give a single number that accounts for age- and height-related lung function variability expected within comparable healthy individuals. For clinical interpretation of spirometric results a one-sided approach is used, where the 5th centile or −1.645 z score defines the lower limit of normal (LLN). Unlike percent predicted the same cutoff of −1.64 for z scores applies across all ages, genders, ethnic groups, and spirometric pulmonary function indices. z Scores also facilitate more appropriate interpretation of repeated measurements in the same individual.
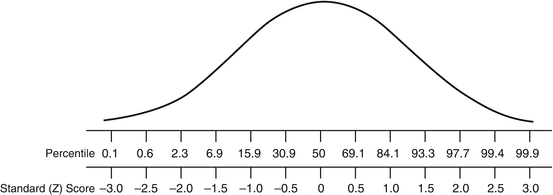
z Scores or SD scores quantify how far from the population mean an individual observation is reported. z Scores provide the direction and magnitude of an individual observation, in the context of the natural variability of measurements within the population. Alternatively, z scores can be converted into centiles, such as are employed in pediatric growth charts, which are more intuitive and easier to explain to patients, such that a z score of 0 equates to the 50th centile. Centiles and z scores are equivalent (Fig. 10.5); however at the extremes of the distribution, z scores are more informative.


Fig. 10.5
Comparison of percentiles and z scores (SDS scores)
Both the American Thoracic Society and European Respiratory Society recommend the use of the lower limit of normal (LLN), or upper limit where appropriate (i.e., plethysmographic lung volumes), to delineate between health and suspected disease. Since by convention the LLN is set at the 5th centile, whereby 90 % of the healthy population falls within the normal range, it must be appreciated that using this cutoff results in a 5 % false-positive rate.
Regardless of whether z scores, centiles, or percent predicted are used to express results, the age-specific normal range should always be included in the lung function report. In addition, the cutoffs for abnormal results do not necessarily need to be ±1.645 z scores, but any clinically or physiologically appropriate threshold. When interpreting results, it is important to remember that there will always be a degree of within-person variability, so that by chance a measurement may be just outside the “normal range” on one occasion, but just within it on the next. It is also essential to take other clinical information into account, and to weigh the consequences of an erroneous decision against that of a correct diagnosis. Particular caution is required when interpreting results which lie close to the somewhat arbitrary “cutoffs” between health and suspected disease, especially when results are limited to a single test occasion.
How to Choose a Reference Equation
The overwhelming number of published reference equations often complicates the selection of an appropriate reference. The use of inappropriate reference equations and misinterpretation even when potentially appropriate equations are used can lead to serious errors in both under- and overdiagnosis, with its associated burden in terms of financial and human costs [1, 4]. Observed differences between reference equations may be explained by differences in population characteristics; in addition equipment, software, and measurement technique used may also explain some of the variations [29, 30]. Secular trends in the population may also explain changes in body size and lung function; therefore outdated equations should be used with caution, particularly in developing countries where there have been rapid improvements in growth and nutrition. Importantly, the sample of subjects should be unbiased, and large enough to ensure that the extreme limits of “normal” can be estimated with reasonable precision and are representative of the population being tested. Criteria for choosing an appropriate reference equation are summarized in Table 10.1.
Selection | Predicted values should be obtained from a reference population with the same anthropometric characteristics (height, age, sex, race, ethnicity) as the patient being tested |
Equipment | Instruments and lung function testing protocols should be similar to the lab where the reference population was derived |
Reference equations | Reference values should take into account height, age, and sex |
All parameters (FEV1, FVC, etc.) should, if possible, be taken from the same reference source | |
Race/ethnic-specific equations should be used whenever possible | |
Consideration should be given to updating reference equations on a regular basis, e.g., every 10 years | |
Use | Extrapolation beyond the height and age of the reference population should be avoided |
Height and weight should be measured for each patient at the time of testing to the nearest decimal | |
For each lung function parameter, values below the 5th percentile (−1.64 SD) of the reference population are considered to be below the expected “normal range” |
Despite the important influence that choice of reference equation may have on interpretation of results, many users of lung function equipment, and indeed clinicians who request such tests, are often not aware of which equations are used to interpret results, simply relying on default values set by manufacturers at the time of installation. Ideally, the reference range applied to interpret results should be derived from the same population from which the test subjects come, using the same equipment and methodologies as those applied [24]. Logistically, center-specific reference data are difficult to obtain, since the recruitment of a reference population is both time consuming and costly. Furthermore, a large sample is required to ensure that interpretation is not influenced by sampling bias [31]. This applies to both validation of existing reference equations and deriving new ones.
Which Reference Equations Should I Use?
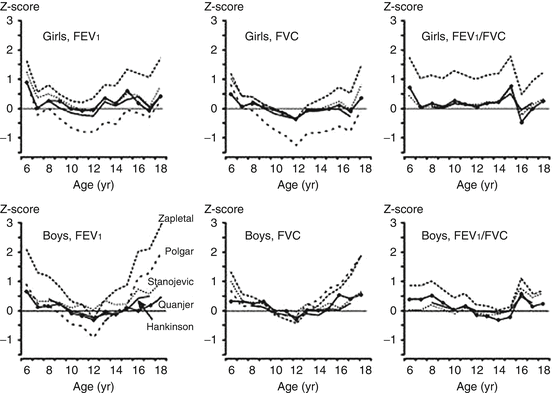
Many studies have demonstrated that applying different reference equations to the same lung function data yields discrepant results in terms of z score [1–4] (Fig. 10.6). An example of how different equations can lead to different interpretations is displayed numerically in Table 10.2; for a group of healthy children the average z scores can vary by more than 1 z score when different equations are used. The differences between equations also introduce problems when children switch from one pulmonary function laboratory to another, during the transition to adult care, and in some cases within a laboratory when there is a switch in reference equations. The switching of reference equations from different populations and different age ranges introduces biases ranging from −14 to 38 % at the transition from adolescence to adulthood [3].


Fig. 10.6
Median values of z scores for FEV1, FVC, and FEV1/FVC for a cross section of healthy Dutch children aged 8–18 years, by five different reference equations. Figure adapted with permission of the American Thoracic Society (from Quanjer et al. [3]). Copyright 2013 American Thoracic Society
Table 10.2
Comparison of FEV1 results for two subjects using six available pediatric equations
Mean FEV1 z score (95 % confidence intervals)
Stay updated, free articles. Join our Telegram channel
Full access? Get Clinical Tree
 Get Clinical Tree app for offline access

| ||||
|---|---|---|---|---|