Instrumentation and Artifact Detection Including Fetal Arrhythmias
Instrumentation and Artifact Detection
INSTRUMENTATION
For the obstetrician or obstetric nurse to interpret fetal monitor tracings correctly, it is necessary to have some understanding of the processes involved in the acquisition and processing of data relating to fetal heart rate (FHR) and uterine activity. Electronic fetal monitors are designed to interpret accurately in most situations, but there are times when their output can be misleading unless the instruments’ limitations are understood. Most errors we see in FHR interpretation are related to the quality of the data acquisition and presentation, and, for this reason, an understanding of this chapter is critical for the clinician using electronic fetal monitoring in the treatment of obstetric patients.
FETAL HEART RATE DERIVED BY DIRECT (INTERNAL) FETAL ELECTROCARDIOGRAPHY
The FHR monitor acquires, processes, and displays an electronic signal. To understand the significance of the FHR display, it is important to understand what the monitor can and cannot count. FHR tracings from a fetal scalp electrode (FSE) are obtained by measuring the interval between consecutive fetal R waves. Therefore, the fetal electrocardiogram (ECG) signal provides the clinician with a measure of the electrical activity of the fetal heart. It does not necessarily represent mechanical activity. The fetal ECG signal is acquired through a bipolar electrode that penetrates the skin of the fetal scalp (first pole) and that has a second conductor residing in the secretions of the maternal vagina (second pole). It is believed that the circuit is completed through the fetal umbilical cord, placenta, and the maternal circulation and that the potential difference (voltage) being measured is between the two poles. The original electrode was a modified skin clip, but now a spiral electrode is used.
The raw fetal ECG signal is amplified and fed into a beatto-beat cardiotachometer (Fig. 4.1). The amplifier uses an automatic gain control circuit to boost the fetal ECG signal to a predetermined voltage before electronic counting. All electronic signals are equally strengthened noise as well as fetal ECG. Once the fetal ECG signal has been amplified, it is filtered, and the interval between R-wave peaks is measured. The interval between R waves is processed to a rate in beats per minute (BPM) by computing the reciprocal of the interval. With internal FHR monitors, a new rate is set each time an R wave is detected; as each new wave arrives, the rate is recalculated from the reciprocal of the previous R-R interval. The result of this rate calculation is the plotting of a series of square waves (Fig. 4.2). The minute rate differences between beats are referred to as beat-to-beat or short-term variability and can only be appreciated when the FHR is computed instantaneously by means of a beat-to-beat cardiotachometer. FHR changes with a cyclicity of 3 to 5 per minute are referred to as long-term variability, and those occurring in response to uterine contractions or fetal movement are referred to as periodic. Long-term variability and periodic changes can be detected with Doppler systems, but true short-term variability can be measured only with direct or abdominal fetal ECG systems. The newer fetal monitors have advanced technology, utilizing autocorrelation techniques, allowing for Doppler-derived signal data of significantly improved quality such that, although not exact, the FHR recording is very close to that obtained from direct fetal ECG and visually approximates true short-term variability in many patients.
Most fetal ECG systems will not record R-R intervals less than 250 milliseconds, which corresponds to a rate of 240 BPM. If the FHR exceeds 240 BPM, not even a direct fetal ECG system will count every beat and may halve or not print such rates. This occurs only with fetal supraventricular tachyarrhythmias (paroxysmal atrial tachycardia, atrial fibrillation, or atrial flutter), intermittent premature atrial contractions (PACs), or premature ventricular contractions (PVCs) (Fig. 4.3).
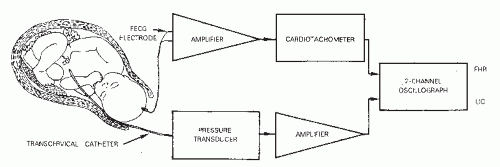 Figure 4.1. Schematic diagram of a direct fetal monitoring system. The fetal heart rate is obtained from a fetal scalp electrode and counted in a cardiotachometer. The actual uterine pressure is recorded directly from a transcervical intrauterine catheter. (FHR, fetal heart rate; UC, uterine contraction.) |
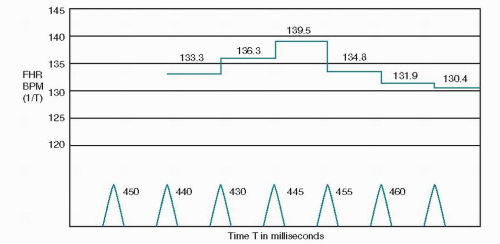 Figure 4.2. This schematic represents an enlarged segment of the fetal heart rate tracing. A new rate is set with the arrival of each R wave in the fetal electrocardiogram. This generates a series of square waves that indicate beatto-beat changes. |
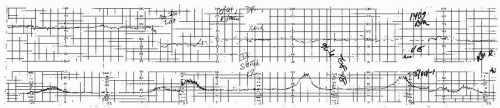 Figure 4.3. This is an example of a change in the atrial pacemaker. The fetus is known to have multiple cardiac abnormalities and presented in supraventricular tachycardia with nonimmune hydrops. Cardioversion was achieved successfully with digoxin and quinidine. This tracing is from early labor. |
An additional instance that may cause confusion is the patient with a cardiac pacemaker. If the transmitted maternal pacemaker pulse is at a higher voltage than the fetal R wave, the scalp electrode may record the pacemaker signal (1,2).
In the absence of the fetal ECG signal, such as with a dead fetus, there will usually be no tracing. However, depending on the monitor and the existing maternal R wave, amplification of the incoming signal may continue until, on occasion, counting of the maternal heart rate (MHR) from the scalp of the dead fetus results (Fig. 4.4) (3,4). This can obviously lead to confusion. When there is any doubt, fetal demise should be confirmed with real-time ultrasound or comparison to maternal ECG or pulse oximeter signal, and in all instances of monitoring, there needs to be documentation of maternal pulse rate as different from the FHR.
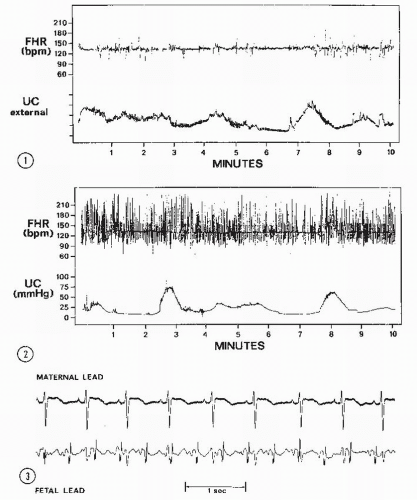 Figure 4.4. The upper panel shows the heart rate from a fetal scalp electrode (FHR) and maternal leads (MHR) with a dead fetus. Note the two rates are identical in detail. The lower panel shows the fetal scalp lead and the maternal lead electrocardiogram (ECG) tracing indicating that the dead fetus is transmitting the maternal ECG to the fetal lead. (From Klapholz H, Schifrin BS, Myrick R et al.: Role of maternal artifact in fetal heart rate pattern interpretation. Obstet Gynecol 44:373, 1974, with permission.) |
FETAL HEART RATE DERIVED BY INDIRECT (EXTERNAL) DOPPLER ULTRASOUND
In the antepartum period, and often during the intrapartum period, it is neither feasible nor always necessary to use the direct fetal ECG signal to record the FHR. External monitoring using various biophysical modalities has
evolved to a point where it currently represents the most frequent form of FHR monitoring. Doppler ultrasound is the method most commonly used to indirectly record FHR (Fig. 4.5).
evolved to a point where it currently represents the most frequent form of FHR monitoring. Doppler ultrasound is the method most commonly used to indirectly record FHR (Fig. 4.5).
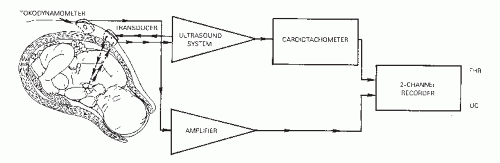 Figure 4.5. Schematic diagram of an indirect fetal monitoring system. The fetal ultrasonogram is obtained from an abdominal wall transducer, conditioned, and then counted by a cardiotachometer. The semiquantitative uterine activity is measured by an external tocodynamometer. (UC, uterine contraction.) |
The principles underlying the use of Doppler FHR monitoring are described.
Ultrasonic signals can penetrate human tissue. When the transmitted ultrasonic beam encounters an interface of increased density, a portion of the signal is reflected. The angle of reflection varies according to the angle of incidence of the beam. A portion of the signal will be transmitted to the next interface. If the interface is moving, the reflected signal undergoes a frequency change (Doppler shift). The frequency increases if the reflecting interface is moving toward the signal source and decreases if the reflecting interface is moving away from the signal source. An example commonly used to describe the Doppler shift is the audible change in pitch (frequency) noticed by a stationary observer of the whistle from a rapidly moving train. As the train approaches, the whistle gets both louder and higher in frequency. As the train passes and moves away, both loudness and pitch rapidly decline.
The fetal monitor Doppler transducer contains a transmitter, or signal source, and receiver. With all of the firstgeneration fetal monitors and many second-generation monitors, the signal is transmitted and the reflected signals received continuously by multiple crystals contained in the transducer. A transducer innovation employed by second-generation monitors is pulsed Doppler. The pulsed Doppler transducer alternates the emission of ultrasound waves with the reception of the reflected waves, resulting in a decrease in both the amount and time of exposure of the fetus to ultrasound energy. Ultrasound waves of sufficient intensity will generate heat. Intensities of less than 100 mW/cm2, regardless of the length of exposure, generate no heat. The amount of energy generated by fetal monitors is only a small fraction of this, with the continuous ultrasound transducers generating intensities of 5 to 12 mW/cm2 and pulsed ultrasound transducers generating 1.5 to 5 mW/cm2.
As long as the reflecting interfaces are not in motion, the reflected signal has the same frequency as the transmitted signal. However, if the reflecting interface is the surface of a moving organ such as the fetal heart, there will be a frequency change (Doppler shift) in the reflected signal. The electronic circuitry of the fetal monitor senses this frequency change and converts it to an electronic signal. This signal can then be used as a marker of the fetal heart beat as well as for the creation of fetal heart sounds produced by the monitor. This is the sound that is heard using a Doppler device. A similar shift is created if the Doppler signal is being reflected by any movement such as fetal blood, maternal vessels, or fetal movement. It is important to understand that with Doppler technology, it is not the actual fetal heart being heard but rather a sound that is created by the device in response to frequency changes generated by a moving interface.
This biphasic signal is immersed in noise created by fetal movements, arterial blood flow, maternal movements, and random muscle contractions. The signal actually received is a composite consisting of bursts with various amplitudes and frequencies. In addition, the actual signal created by the fetal cardiac motion is greatly affected by the position and movement of the transducer with respect to the fetus. With older monitors, the quality of the Doppler-created FHR tracing is directly related to the orientation of the signal to the fetal heart, the amount of fetal movement, and the degree of constant attention by nursing personnel of maintaining an adequate signal while caring for the patient. One potential source of error occurs when the Doppler signal is actually maternal and not FHR (Fig. 4.6). The maternal pulse should be checked to confirm correct recording of FHR at the initiation of fetal monitoring, with any switching of FHR modes or with any abrupt decrease in FHR,
especially in a setting of noncontinuous tracings. Newer monitors sometimes do not produce noncontinuous tracings when the signal switches from fetal to maternal, making the transition more difficult to identify (see section on signal ambiguity).
especially in a setting of noncontinuous tracings. Newer monitors sometimes do not produce noncontinuous tracings when the signal switches from fetal to maternal, making the transition more difficult to identify (see section on signal ambiguity).
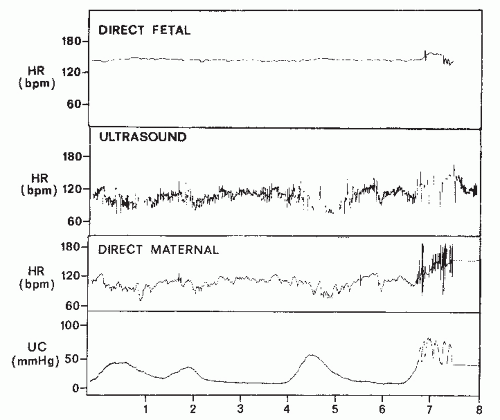 Figure 4.6. Simultaneous recording of heart rate (HR) from the direct fetal scalp electrode (upper tracing), abdominal Doppler (middle tracing), and direct maternal (lower tracing). Note that the abdominal Doppler signal is recording the maternal heart rate from a maternal vessel in the abdomen. (UC, uterine contraction.) (From Klapholz H, Schifrin BS, Myrick R, et al.: Role of maternal artifact in fetal heart rate pattern interpretation. Obstet Gynecol 44:373, 1974, with permission.) |
With the evolution of autocorrelation in many of the newer monitors, great advances have been made in both signal quality and continuity. While new wide-beam ultrasound transducers decrease signal loss due to fetal movement, they increase the chance of recording MHR (see section on signal ambiguity).
FIRST-GENERATION SIGNAL PROCESSING
Fetal monitors obtain the FHR indirectly by use of Doppler ultrasound. To produce an FHR tracing, several modulations of the reflected signal need to be used. As previously discussed, amplification and filtering of the incoming signal within certain frequencies extracts FHR signals from those produced by other moving structures. The filtered signal is converted to an electrical waveform by the transducer, and it is this waveform that is used to generate and display the FHR. Detection of fetal motion with Doppler signal is the same with both the older and newer monitors. It is the process of signal conversion to FHR that differs.
First-generation monitors calculate heart rate by electronic integration and peak detection of the returning Doppler signal. The highest point of the waveform is detected and recorded as a heart beat, even though it may not appear at the same time in each waveform. Despite various electronic logic and filtering processes, this often results in an apparent increase in short-term variability due to a false reproduction of the actual interval from one heart beat or R wave (contraction) to the next (Figs. 4.7,4.8 and 4.9). With signal fading, inconsistent signal shape, and changing signal peaks, the resultant FHR may be, at best, a poor reflection of the true variability of consecutive R-wave intervals. The beat-to-beat variability of the FHR calculated from the fetal ECG usually averages 1 BPM or less (5,6), but the Doppler signal using the first-generation monitor technology often displays a variability much greater than that and can be very misleading.
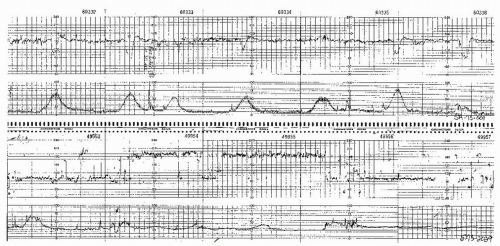 Figure 4.7. Tracing from a Doppler system showing halving of the fetal heart rate at rates over 180 beats per minute. |
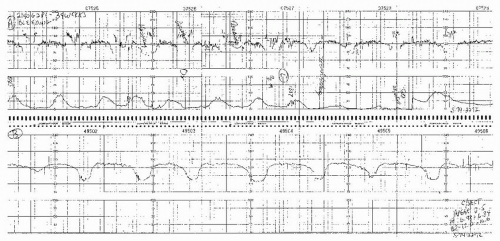 Figure 4.8. The upper tracing is taken from a Doppler signal source. At first glance, it appears to be a poor-quality erratic tracing, but upon closer examination, the late decelerations can be seen. The fetal heart rate (FHR) doubles whenever it goes below 90 beats per minute, putting the trough of the late decelerations above the baseline. The lower tracing, a continuation of the upper tracing after the fetal scalp electrode signal source was begun, shows the deep decelerations that were previously unrecognized because of the artifactual doubling of the FHR by the Doppler logic system. |
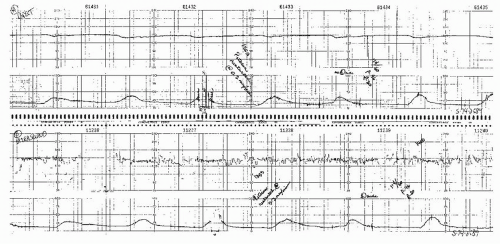 Figure 4.9. Simultaneous recordings with Doppler (lower tracing) and direct fetal electrocardiogram (upper tracing) signal sources. Note the apparent increased variability and obscuring of periodic changes on the Doppler tracing. |
AUTOCORRELATION
Although not new in concept, the application of autocorrelation to FHR technology has been made possible by the introduction of high-speed microprocessor integrated circuitry. The received pattern is broken into very short second envelopes of time made up of 200 to 300 digitalized points (Fig. 4.10). With each consecutive new heart beat waveform, the microprocessor compares the digitalized points to the equivalent points in the preceding envelope. Essentially, autocorrelation is a
signal-processing scheme that compares the incoming signal with a time-delayed version of previous signals. Important information has a regular form repeated over time, while random noise has no such regularity. Artifactual waveforms and older points are discarded. The resultant tracing represents a point in each cardiac cycle more accurately than can be done with first-generation monitors. Varying waveform amplitude problems are, therefore, minimized, and markedly less false variability is produced (Fig. 4.11).
signal-processing scheme that compares the incoming signal with a time-delayed version of previous signals. Important information has a regular form repeated over time, while random noise has no such regularity. Artifactual waveforms and older points are discarded. The resultant tracing represents a point in each cardiac cycle more accurately than can be done with first-generation monitors. Varying waveform amplitude problems are, therefore, minimized, and markedly less false variability is produced (Fig. 4.11).
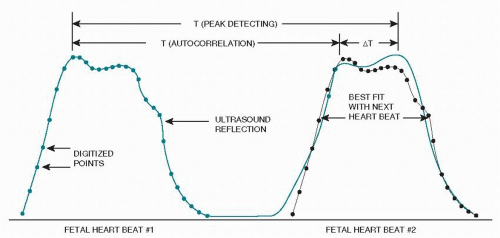 Figure 4.10. Schematic representation of consecutive fetal heart beat waveforms demonstrating autocorrelation versus peak detection. (Reproduced with permission of Hewlett Packard Corporation, Bohlinger, Germany.) |
As with first-generation monitors, interpretation of the FHR from newer monitors using autocorrelation must be done cautiously. Despite apparent improvement in signal interpretation, autocorrelation is still not a true measure of short-term variability. The possibility for signal loss, doubling, halving, or recording of MHR or other movements must be kept in mind when reading changes in FHR monitor strips (6,7). Because autocorrelation enhances signal-to-noise levels and periodic phenomena, in the absence of fetal cardiac motion, it may produce a false signal and resultant “heart rate” (Fig. 4.12). When doubt is present, confirmation with auscultation or direct FSE must be done.
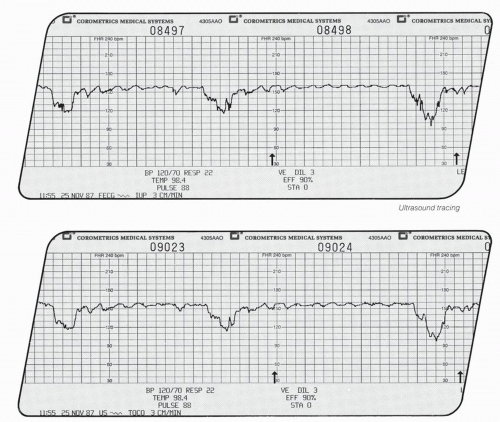 Figure 4.11. Example of simultaneous intrapartum fetal heart rate tracings comparing the external monitor with the direct fetal electrocardiogram internal monitor. Autocorrelation has improved the quality of the tracing and eliminated much of the signal loss or error present with many older monitors. (Courtesy of Corometrics Medical Systems, Wallingford, CT.) |
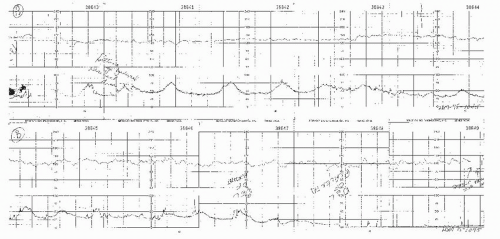 Figure 4.12. This tracing shows a Doppler record from a monitor with an excessive amount of electronic logic. Note in the lower panel that, even after the delivery of the baby and placenta, an apparent fetal heart rate can still be seen on the tracing. |
ABDOMINAL FETAL ELECTROCARDIOGRAPHIC-DERIVED FETAL HEART RATE TRACINGS
Abdominal fetal ECG signals were first recorded by Cremer in 1906 (8). The original application of this method was to diagnose fetal life. Later, Larks and Dasgupta (9) and Hon and Hess (10) showed that the presentation of the fetus could be predicted by the polarity of the fetal QRS complex in relation to the maternal abdomen. With a breech presentation, the fetal ECG complex would be similar in polarity to that of the mother; with a cephalic presentation, the R wave would be opposite that of the maternal polarity. In addition, abdominal fetal ECG tracings could be used to diagnose twins by comparing the fetal complexes and determining two separate rate patterns among the fetal complexes. From the maternal abdomen, the fetal ECG complex is much smaller than the maternal ECG (Fig. 4.13). Often, if the electrical noise level is high, one may not be able to see a fetal ECG signal.
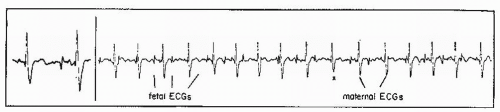 Figure 4.13. An abdominal tracing showing the large maternal electrocardiogram complexes and the clear but much smaller fetal complexes. (From Hon EH, Lee ST: Am J Obstet Gynecol 87:804, 1963, with permission.) |
Due to the weakness of the fetal ECG signal before 30 weeks’ gestation, the interference created by the electromyographic muscle noise of the maternal abdominal wall, and the frequency of coincidence of maternal and fetal ECG signals, abdominal ECG plays little role in modern FHR monitoring other than in arrhythmia detection.
However, before the introduction of autocorrelation and improved Doppler technology with the newer monitors, abdominal fetal ECG-derived tracings were the most accurate recordings of FHR signal in many patients (Fig. 4.14). Several attempts have been made, with varying degrees of success, to reliably obtain FHR variability indirectly using the abdominal fetal ECG modality (11,12). Today abdominal FECG signal source for FHR tracings are no longer used in the United States.
However, before the introduction of autocorrelation and improved Doppler technology with the newer monitors, abdominal fetal ECG-derived tracings were the most accurate recordings of FHR signal in many patients (Fig. 4.14). Several attempts have been made, with varying degrees of success, to reliably obtain FHR variability indirectly using the abdominal fetal ECG modality (11,12). Today abdominal FECG signal source for FHR tracings are no longer used in the United States.
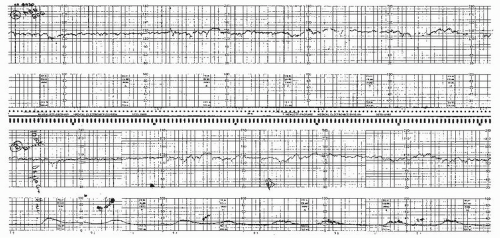 Figure 4.14. Simultaneous fetal heart rate tracings derived from abdominal electrocardiogram (ECG) (upper panel) and scalp ECG (lower panel). |
PHONOCARDIOGRAPHICALLY DERIVED FETAL HEART RATE
Phonocardiography was the first method used to record FHR electronically. As the fetal heart beats, closure of the valves may be detected by listening with a suitable stethoscope through the mother’s abdominal wall. With ventricular systole, the closure of the atrioventricular (AV) valves produces the first heart sound. This mechanical energy may be sensed by a microphone and amplified, producing an electrical signal that may then be reconverted to sound or used to produce a phonocardiogram, an oscillographic tracing of the heart sounds. The amplified electrical signal can also be used as a counting source for an FHR monitor. The phonocardiographic signal is clearer than the Doppler signal, resulting in less artifactual “jitter.” For this reason, phonocardiography historically was widely used for antepartum FHR monitoring.
The main drawback to phonocardiographically derived FHR systems is that they are extremely sensitive to ambient noise such as maternal bowel sounds, voices in the room, certain air-conditioning systems, and, especially, noise produced by any motion of the microphone or of the bed clothing against the microphone. In addition, any fetal kicking or motion produces a very loud noise that will saturate the automatic gain system on the monitor’s amplifier, resulting in complete loss of recording for several seconds while waiting for the amplifier to reopen. For this reason, a manual gain control offers a great advantage when using abdominal fetal phonocardiography for recording heart rate. Also, because of the high sensitivity to ambient noise, the technique is unsatisfactory for monitoring during the active phase of labor (Fig. 4.15). The current role of phonocardiographic FHR recording is quite limited but should be considered if abdominal fetal ECG and Doppler do not produce satisfactory recordings. Today, it would have to be considered below Doppler in a ranking of preferred methods of antepartum FHR recording. Both abdominal fetal ECG and phonocardiographic FHR are rarely employed means of fetal monitoring but are of historic significance.
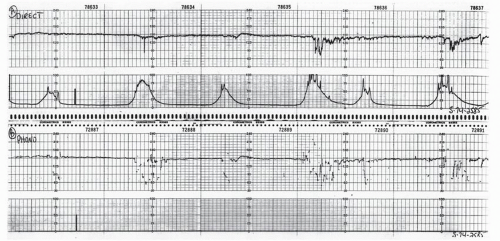 Figure 4.15. Simultaneous fetal heart rate tracings derived from phonocardiographic (lower panel) and scalp electrocardiogram (upper tracing). Note the signal loss during contractions with the phono recording. |
SCALING FACTORS
The choice of vertical and horizontal scaling directly affects the appearance of the FHR and uterine contraction tracings. In the United States, the standard factors are 30 BPM/cm on the vertical scale and 3 cm/minute on the horizontal scale. In Europe, standard factors are 20 BPM/cm (vertical) and 1 or 2 cm/minute (horizontal). The European scaling factors accentuate apparent FHR variability and tend to make periodic changes appear more abrupt than American scaling factors. Although US clinicians find 1 cm/minute tracings are harder to read than the same tracings at 3 cm/minute, the slower rate of tracing is commonly used in Europe, South America, and certain centers in this country. Figure 4.16 shows how paper speed can significantly alter the appearance of a tracing.
APPLICATION OF MONITORING DEVICES
Uterine Contraction Monitors
Clinically, uterine contractions can be monitored by two techniques: external tocodynamometry or intrauterine pressure measurement. Both methods have advantages and disadvantages, and one or the other is more applicable in certain clinical situations. This section will deal with the methodology involved in the clinical application of these techniques.
Intrauterine Pressure Monitoring
The pregnant uterus is a closed, fluid-filled space. Hydrostatic pressure within the uterus should be equal at all points. Intrauterine pressure has historically been determined with the use of an open-ended, fluid-filled catheter placed through the cervix and externally attached to a strain gauge transducer. Pascal’s law dictates that assuming such a monitoring system is a closed system, the baseline tone as well as the intrauterine pressure during a contraction will be transmitted directly to the external strain gauge pressure transducer. With such a system, both technical and logistic problems exist, such as catheter occlusion by solid matter, kinking or entrapment of catheter between the uterus and the fetus, as well as introduction of artifact secondary to maternal movement and catheter manipulation (13). An alternative type of intrauterine pressure device was introduced in 1987. This device has a micropressure transducer located at the tip of the catheter, which is inserted through the cervix into the uterine cavity. Such a device eliminates most of the problems associated with the fluid-filled devices used for uterine pressure monitoring. Most devices currently employed to monitor intrauterine pressure come from one of the manufacturers of these transducer-tipped catheters (see Figs. 5.3 and 5.4).
The pressure within the uterine cavity is directly proportional to the uterine wall tension and inversely proportional
to the diameter of the uterus. Thus, the larger the uterus, the lower the intrauterine pressure for a given uterine wall tension. Clinical support of this concept is reflected in the fact that pressure in the nonpregnant uterus may exceed 200 mm Hg during menstrual contractions, whereas intrauterine pressure with twins may never exceed 35 or 40 mm Hg, even in active labor. The usual pressures observed in the pregnant uterus during active labor at term are in the range of 50 to 100 mm Hg at the peak of contractions, with a baseline tone of 5 to 12 mm Hg.
to the diameter of the uterus. Thus, the larger the uterus, the lower the intrauterine pressure for a given uterine wall tension. Clinical support of this concept is reflected in the fact that pressure in the nonpregnant uterus may exceed 200 mm Hg during menstrual contractions, whereas intrauterine pressure with twins may never exceed 35 or 40 mm Hg, even in active labor. The usual pressures observed in the pregnant uterus during active labor at term are in the range of 50 to 100 mm Hg at the peak of contractions, with a baseline tone of 5 to 12 mm Hg.
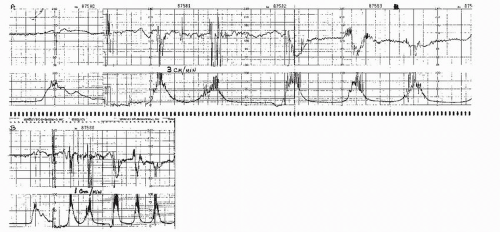 Figure 4.16. Tape-recorded fetal heart rate and uterine contraction patterns were played back simultaneously to monitors running at 3 cm/minute (upper tracing) and 1 cm/minute (lower tracing). |
Insertion of the uterine pressure catheter is accomplished by introducing it, while within the sterile introducer tube, just inside the uterine cervix and next to the presenting part (Fig. 4.17). The flexible intrauterine catheter is usually advanced into the uterus quite easily, but on occasion, resistance will be met. In this situation, one should move the introducer 90 degrees in its orientation to the cervix and try again. Usually, one begins posterior to the presenting part, but the catheter can be inserted anywhere in the 360-degree circumference of the cervix. When the catheter advances easily, it should be inserted to the mark on the catheter that should be just visible at the introitus. All systems for measuring intrauterine pressure must be zeroed, which is the referencing of the pressure to 0 mm Hg while the system is open to air. Any reconnection of the patient to the monitor requires rezeroing. It is expected that there will be a baseline uterine tone, so if the monitor is registering zero or a negative number, the calibration is incorrect. Replacement of the catheter is necessary if a good recording does not result from simple manipulation.
Another modification of the intrauterine pressure catheter allows for amnioinfusion while simultaneously recording contraction strength directly (see Fig. 5.5). The accuracy of pressure monitoring is not lessened with this catheter and allows for continuous amnioinfusion without
artifactual elevation of baseline uterine pressure or a need for the placement of a second catheter for infusion. If one is using a single-lumen catheter for pressure readings and simultaneous amnioinfusion, there is an elevation of the apparent baseline uterine tone (Fig. 4.18). However, this is actually the result of the hydrostatic pressure from the infusate and is readily confirmed by interrupting the infusion and confirming true baseline and peak contraction strength.
artifactual elevation of baseline uterine pressure or a need for the placement of a second catheter for infusion. If one is using a single-lumen catheter for pressure readings and simultaneous amnioinfusion, there is an elevation of the apparent baseline uterine tone (Fig. 4.18). However, this is actually the result of the hydrostatic pressure from the infusate and is readily confirmed by interrupting the infusion and confirming true baseline and peak contraction strength.
Stay updated, free articles. Join our Telegram channel

Full access? Get Clinical Tree


