Hypertrophic and Other Cardiomyopathies
Overview
This chapter deals with hypertrophic and miscellaneous cardiomyopathies, which generally are characterized by increased left ventricular wall thickness and/or infiltration of the myocardium. Unlike dilated cardiomyopathy (Chapter 18) in which signs and symptoms of systolic dysfunction predominate, the clinical presentation of hypertrophic and infiltrative cardiomyopathies is more varied and is often the result of diastolic dysfunction and/or reduced stroke volume related to small cavitary volume. These cardiomyopathies also pose unique clinical challenges with respect to arrhythmias and the need to consider underlying systemic illnesses. Echocardiography is an essential and appropriate tool in the management of patients with these cardiomyopathies (Table 19.1).
Hypertrophic Cardiomyopathy
Hypertrophic cardiomyopathy is defined by the presence of localized or generalized left ventricular hypertrophy (≥13-mm wall thickness) in the absence of hypertension or other factors likely to result in a pressure overload or an infiltrative state. Hypertrophic cardiomyopathy occurs in sporadic and familial forms with a prevalence estimated at 1 in 500. The genetics of the disease is variable with respect to the specific gene mutation and degree of penetrance. More than 400 distinct genetic mutations, resulting in alteration in troponin or myoglobin, have been reported. All forms of hypertrophic cardiomyopathy have in common inappropriate left ventricular hypertrophy. Histologically, myocyte hypertrophy and abnormal orientation are noted. The classic form, obstructive hypertrophic cardiomyopathy, results in dynamic left ventricular outflow tract obstruction and is associated with ventricular arrhythmias and sudden cardiac death. This classic form was previously referred to as idiopathic hypertrophic subaortic stenosis, a term no longer in use. There is substantial variation in phenotypic expression of this disease even among family members. In addition to the classic obstructive form, there are well-described forms which are concentric and which may be associated with little or no obstruction. Other forms are the apical variant, most commonly seen in Asian populations, in which there is diffuse symmetric hypertrophy of all apical segments. A pattern of hypertrophic cardiomyopathy with isolated midseptal hypertrophy has also been described, as has hypertrophy limited to the inferior, anterior, or lateral walls. Finally, it appears that hypertrophic cardiomyopathy may be manifest as isolated hypertrophy of the papillary muscles, in which case multiple papillary muscles may be present
Table 19.1 Appropriateness Criteria for Use of Echocardiography in Hypertrophic and Restrictive Cardiomyopathy | ||||||||||||||||||
|---|---|---|---|---|---|---|---|---|---|---|---|---|---|---|---|---|---|---|
| ||||||||||||||||||
Echocardiographic Evaluation of Hypertrophic Cardiomyopathy
The initial echocardiographic studies of hypertrophic cardiomyopathy used M-mode echocardiography for diagnosis. With this technique, a septal to posterior wall-thickness ratio of 1.3:1 or more was considered evidence of inappropriate septal hypertrophy and used to establish the diagnosis. This was referred to as asymmetric septal hypertrophy, a term which understates the distribution of the pathologic hypertrophy. It should be emphasized that there are a number of other disease states such as pulmonary hypertension with right ventricular hypertrophy and inferior wall infarction in the presence of left ventricular hypertrophy that will also result in a similar septal to posterior wall-thickness ratio. Septal to posterior wall-thickness ratio alone should not be used as a marker of hypertrophic cardiomyopathy.
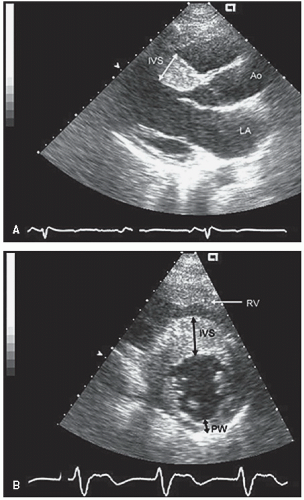
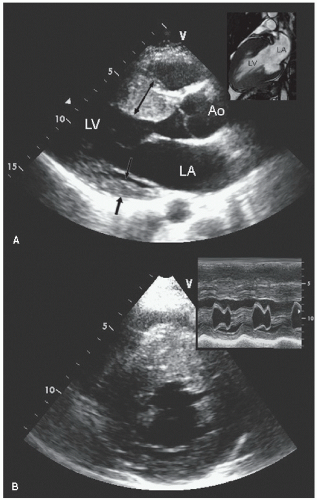
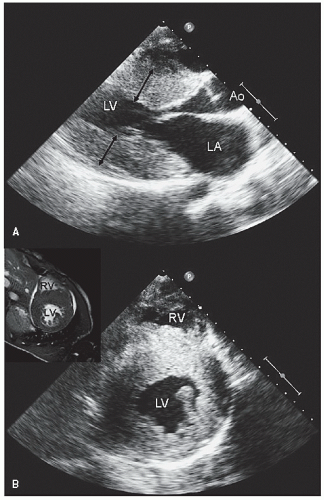
Two-dimensional echocardiography is the primary tool for screening and evaluation of known or suspected hypertrophic cardiomyopathy. The presence, magnitude, and distribution of left ventricular hypertrophy can be accurately determined, and, when combined with M-mode echocardiography, color flow and spectral Doppler imaging can fully delineate the entire spectrum of hemodynamic abnormalities seen in hypertrophic cardiomyopathy. Figures 19.1, 19.2, 19.3, 19.4, 19.5, 19.6, 19.7, 19.8, 19.9, 19.10 and 19.11 were recorded in patients with hypertrophic cardiomyopathy and demonstrate the variation in degree and distribution of ventricular hypertrophy. Note the thickening of the proximal anterior septum and relative sparing of the other walls in Figures 19.1 and 19.3. M-mode echocardiography (Fig. 19.2) recorded in the same
patient as presented in Figure 19.1 reveals what appears to be isolated septal hypertrophy with normal wall thickness. Inspection of the short-axis view in Figure 19.1, however, reveals that the hypertrophy is far more generalized than what would have been appreciated from only the parasternal long-axis view or M-mode echocardiography. Commonly, there is a gradation of hypertrophy with maximal involvement in the anterior septum, substantially less involvement in the posterior wall, and intermediate involvement in the lateral wall and inferior septum. This pattern is more common than isolated septal hypertrophy. Figure 19.3 was recorded in a patient with milder hypertrophic cardiomyopathy. Note the proximal septal hypertrophy but relatively preserved dimension of the left ventricular outflow tract. Doppler imaging through the outflow tract revealed no evidence of obstruction at rest. After exercise, a gradient of 34 mm Hg was provoked.
patient as presented in Figure 19.1 reveals what appears to be isolated septal hypertrophy with normal wall thickness. Inspection of the short-axis view in Figure 19.1, however, reveals that the hypertrophy is far more generalized than what would have been appreciated from only the parasternal long-axis view or M-mode echocardiography. Commonly, there is a gradation of hypertrophy with maximal involvement in the anterior septum, substantially less involvement in the posterior wall, and intermediate involvement in the lateral wall and inferior septum. This pattern is more common than isolated septal hypertrophy. Figure 19.3 was recorded in a patient with milder hypertrophic cardiomyopathy. Note the proximal septal hypertrophy but relatively preserved dimension of the left ventricular outflow tract. Doppler imaging through the outflow tract revealed no evidence of obstruction at rest. After exercise, a gradient of 34 mm Hg was provoked.
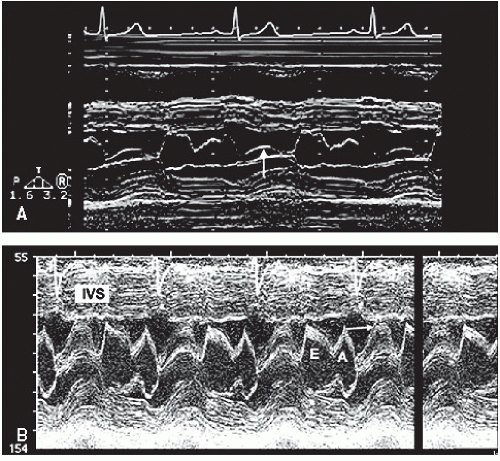 FIGURE 19.2. M-mode echocardiograms recorded in patients with hypertrophic cardiomyopathy demonstrating disproportionate septal hypertrophy and systolic anterior motion of the mitral valve (arrow). A: There is only mild systolic anterior motion present, which does not contact the ventricular septum. Obstruction of left ventricular outflow would not be expected with this pattern. B: Recorded in the same patient depicted in Figure 19.1. Note the thickness of the interventricular septum (IVS) and the dramatic systolic anterior motion (arrow), indicative of significant outflow tract obstruction. |
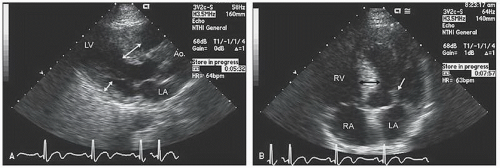
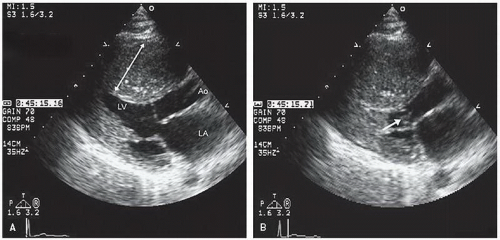
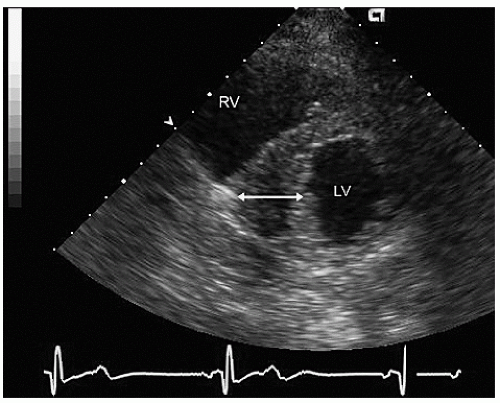
Figures 19.6, 19.7, 19.8 and 19.9 were recorded in patients with more concentric hypertrophic cardiomyopathy. In the short-axis view of Figure 19.7, note the complete cavity obliteration in systole due to the marked hypertrophy. Concentric forms of hypertrophic cardiomyopathy may not be obstructive. Symptoms develop in patients with the nonobstructive form due to pathologic stiffness of the left ventricular myocardium and elevated diastolic pressures as well as pathologically small diastolic
volumes and subsequent reduced stroke volume. Occasionally, hypertrophic cardiomyopathy is encountered in which the pathologic hypertrophy is confined to the inferior (Fig. 19.10), posterior, anterior (Fig. 19.11), or lateral wall of the left ventricle or midseptum or to the right ventricular wall.
volumes and subsequent reduced stroke volume. Occasionally, hypertrophic cardiomyopathy is encountered in which the pathologic hypertrophy is confined to the inferior (Fig. 19.10), posterior, anterior (Fig. 19.11), or lateral wall of the left ventricle or midseptum or to the right ventricular wall.
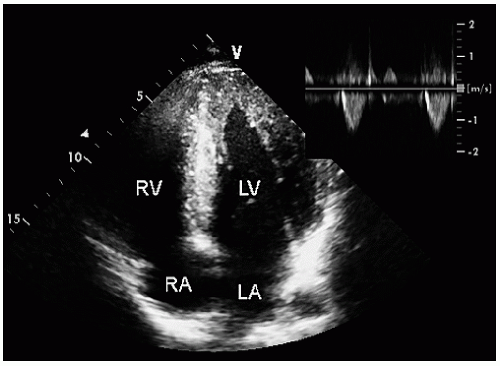 FIGURE 19.5. Apical four-chamber view recorded in the same patient as depicted in Figure 19.4, demonstrating diffuse hypertrophy of the ventricular walls extending to the apex. The small inset is a continuous wave Doppler image through the left ventricular outflow tract demonstrating the absence of a dynamic gradient. |
Assessment of the Left Ventricular Outflow Tract in Obstructive Cardiomyopathy
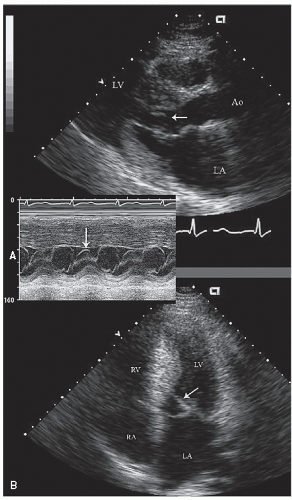
A major sequela of hypertrophic cardiomyopathy is dynamic left ventricular outflow obstruction. M-mode echocardiography was initially used to document the presence of outflow tract obstruction by detection of systolic anterior motion (SAM) of the mitral valve and aortic valve notching, or abrupt partial closure, in systole. Systolic anterior motion of the mitral valve occurs because of an abnormal geometric relationship of papillary muscles and the mitral supporting apparatus combined with hyperdynamic left ventricular contraction. This results in anterior displacement of varying portions of the mitral valve apparatus in systole. Systolic anterior motion of the mitral valve can be identified
on M-mode (Fig. 19.2), transthoracic or transesophageal or two-dimensional scanning (Figs. 19.6, 19.12, and 19.13) and should be characterized by the area of the mitral valve having abnormal motion (chordal or leaflet) and the degree and duration of contact with the ventricular septum. Obstruction is more likely to be present when the mitral leaflet makes direct contact with the ventricular septum motion for 40% of the systolic cycle (Fig. 19.2).
on M-mode (Fig. 19.2), transthoracic or transesophageal or two-dimensional scanning (Figs. 19.6, 19.12, and 19.13) and should be characterized by the area of the mitral valve having abnormal motion (chordal or leaflet) and the degree and duration of contact with the ventricular septum. Obstruction is more likely to be present when the mitral leaflet makes direct contact with the ventricular septum motion for 40% of the systolic cycle (Fig. 19.2).
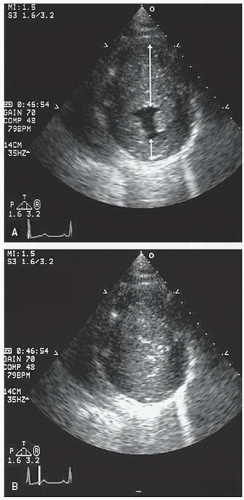 FIGURE 19.7. Parasternal short-axis view recorded in the same patient as depicted in Figure 19.6. In diastole (A) note the massive hypertrophy of the ventricular septum (long arrow) with lesser degrees of hypertrophy present throughout the entire circumference of the left ventricle (short arrow). B: Recorded at midsystole. Note the almost complete cavity obliteration due to the marked hypertrophy. |
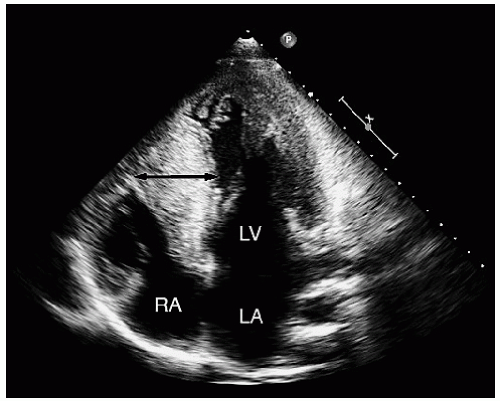 FIGURE 19.9. Apical four-chamber view recorded in the same patient as depicted in Figure 19.8, demonstrating an even greater degree of ventricular hypertrophy when viewed in an apical four-chamber view (double-headed arrow). |
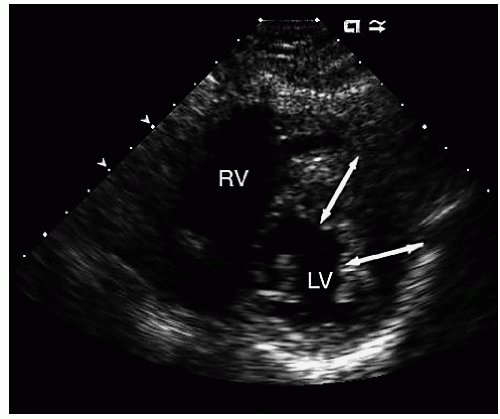 FIGURE 19.11. Parasternal short-axis view recorded in a patient with hypertrophic cardiomyopathy with hypertrophy confined to the anterior and lateral walls (double-headed arrows). |
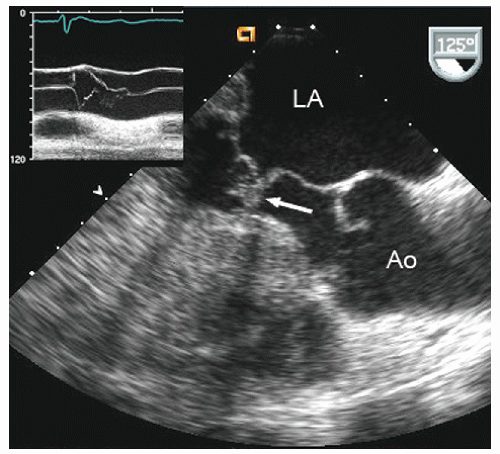
The ejection dynamics of obstructive hypertrophic cardiomyopathy allow for relatively normal early left ventricular ejection during which the aortic valve opens normally. Obstruction occurs in mid- to late-systole concurrent with late-phase left ventricular contraction, at which point flow transiently diminishes. The reduction in flow volume results in partial closure of the aortic valve, often with a secondary opening as final ejection occurs. This results in a single notch, or occasionally several discrete high-amplitude notches, of aortic valve motion (Figs. 19.13 and 19.14). Of note, the degree to which there is preclosure and notching of the aortic valve is not uniform among the three aortic valve cusps and confers no quantitative information.
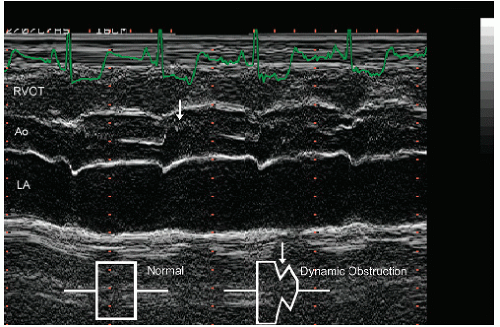 FIGURE 19.14. M-mode echocardiogram recorded in a patient with hypertrophic cardiomyopathy demonstrates systolic notching of the aortic valve (arrow). Normal closure is schematized in the inset. |
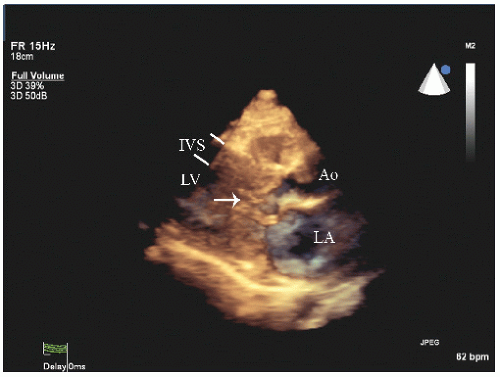
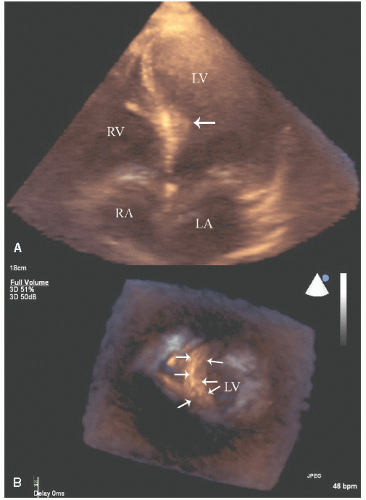
Three-dimensional echocardiography has shown promise for refined definition of the degree and distribution of hypertrophy and an assessment of the geometry of the left-ventricular outflow tract including the degree to which the proximal septum protrudes into the outflow tract. It is not of proven incremental benefit and in many adult patients, acquisition of high-quality, three-dimensional data sets has been problematic (Figs. 19.15 and 19.16).
Cardiac magnetic resonance imaging has been instrumental in demonstrating the substantial heterogeneity of hypertrophy in hypertrophic cardiomyopathy, which may not be apparent on routine two-dimensional scanning. Additionally, detection of myocardial scar with this technique may be predictive of ventricular arrhythmia. Three-dimensional echocardiography with reconstructed volumes of the myocardium theoretically allows a similar assessment to be made of the actual anatomical distribution of hypertrophy and allows detection of subtler forms of this illness but has not yet been proven to be uniformly feasible or of equivalent accuracy.
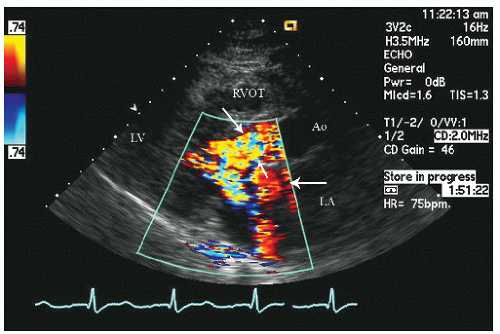
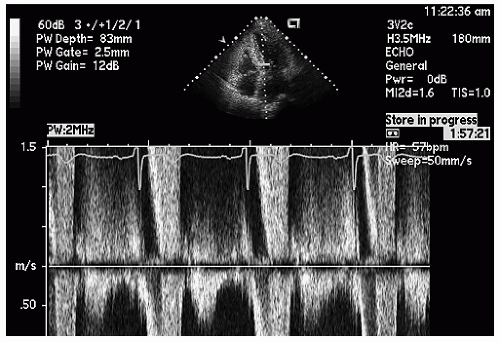
Doppler interrogation of the left ventricular outflow tract provides documentation and quantitation of outflow tract obstruction. Dynamic outflow tract obstruction results in marked turbulence in the outflow tract, which can be detected with color flow Doppler imaging (Fig. 19.17). Pulsed Doppler imaging can be used to track the ejection velocities along the left ventricular outflow tract at which point, when significant dynamic outflow tract obstruction is present, the velocity will exceed the Nyquist limit and aliasing will occur (Fig. 19.18).
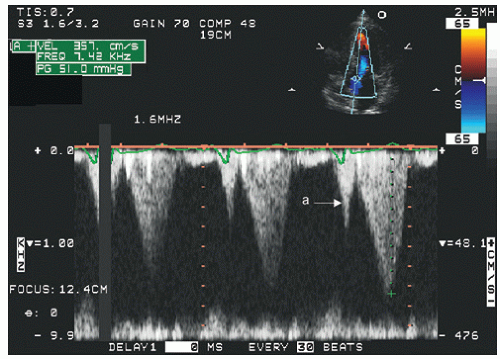
Continuous wave Doppler imaging provides a high-fidelity analysis of left ventricular outflow tract ejection dynamics and gradients but as a stand-alone technique does not identify the location of obstruction. In hypertrophic cardiomyopathy with SAM of the mitral valve, the level of anatomic obstruction is rarely in question, and continuous wave Doppler imaging, combined with anatomic assessment, typically allows a full assessment of the location and degree of outflow tract obstruction. Figures 19.19, 19.20, 19.21 and 19.22 are continuous wave Doppler recordings from which the peak velocities can be recorded without aliasing. There are several characteristics of the continuous wave Doppler profile related to dynamic outflow tract obstruction. In these figures, note the relatively late peak of the maximal gradient. This has been described as a “dagger-shaped” profile in distinction to the spectral profile of mitral regurgitation or aortic stenosis (Fig. 19.22), which is more symmetric. The late peaking of the outflow tract gradient is evidence of the dynamic nature of the gradient that develops toward mid- and end-systole rather than being related to fixed obstruction in which the gradient occurs earlier in systole at the time of maximal flow. In obstructive hypertrophic cardiomyopathy, the maximal gradient occurs in late-systole, after the majority of left ventricular ejection has occurred. As such, it is not truly obstructive with respect to flow volume, because the majority of the left ventricular stroke volume has been ejected at the time that the gradient develops. Often, there is evidence of presystolic forward flow in the left ventricular outflow tract (Fig. 19.19). This occurs when atrial contraction results in acceleration of flow, which is transmitted to the outflow tract because of a highly noncompliant left ventricle.
Stay updated, free articles. Join our Telegram channel

Full access? Get Clinical Tree


