Epidemiology of Hypertension: Introduction
Hypertension is a condition that can claim a number of firsts: It is the most common chronic condition in the United States; it is the number one reason for an office visit to a physician; it accounts for the most drug prescriptions; it is a major risk factor for heart disease and stroke, which are the first and third leading causes of death in the United States; and it is the number one attributable risk for death throughout the world.1 At the same time, it is both preventable and treatable in the majority of patients. Despite these impressive statistics, hypertension continues to be neglected. It is not recognized as a condition worthy of specialist care, and only approximately one-third of hypertensive patients in the United States have their blood pressure controlled to target levels that have been proven in numerous studies to reduce the rates of heart attacks and strokes. In addition, although the death rates from these two conditions have been decreasing over the past 20 years, the rates of two others that are also consequences of hypertension—heart failure and chronic kidney disease—have been increasing. It gets worse yet: A major public health concern in the United States today is the epidemic of obesity, which has resulted in a major increase in the prevalence of type 2 diabetes and which increases the risk of cardiovascular events to the same degree as a prior myocardial infarction, for which the most effective treatment is the aggressive reduction of blood pressure. So perhaps the worst single statistic relating to hypertension is that less than 25% of patients with diabetes have their blood pressure adequately controlled.
What Is Hypertension?
There is agreement that hypertension is a quantitative rather than a qualitative disease. The basis for this statement rests on a large number of epidemiologic studies showing that the distribution of blood pressure in the population is continuous, although the curve is skewed at the higher levels of blood pressure. This was not always accepted: In the 1950s there was a sharp debate between Sir George Pickering and Lord Robert Platt that played out in the correspondence section of the Lancet and was subsequently assembled in a monograph.2 Pickering took the view that the distribution of blood pressure in the population is continuous and that there is no discernible separation between subjects with high blood pressure from those with normal blood pressure. Platt had data that indicated that there was a bimodal distribution and that a hypertensive subpopulation could be distinguished from the normotensive majority, a dispute that could be summarized as “one hump or two?” The general consensus was that Pickering won and that the unimodal distribution holds sway. This has important implications, first because it suggests that hypertension is unlikely to be the result of a single physiologic process or gene, and second because it also suggests that any blood pressure level used to define hypertension is arbitrary.
There are several ways in which hypertension can be classified, which are helpful for its diagnosis and clinical management (Fig. 68–1). The two principal divisions are to classify it by its severity (the height of the blood pressure) and by its underlying cause (primary or essential hypertension vs secondary hypertension). A third major component is age: The pathophysiology of hypertension in younger and older people is quite different.
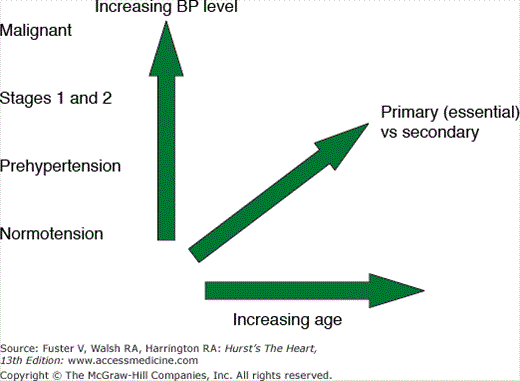
The original subdivision of hypertension according to its severity was benign and malignant. Although malignant hypertension carries a prognosis that is equivalent to that of other malignant diseases (if untreated), the term benign for less severe forms of hypertension is a misnomer and is no longer used. Malignant hypertension is now relatively uncommon in Western countries, and somewhat surprisingly, it no longer features in the JNC 7 (Seventh Report of the Joint National Committee on Prevention, Detection, Evaluation, and Treatment of High Blood Pressure) classification of hypertension,1 which is the generally accepted classification in the United States. It still does occur, however, and is important because it requires urgent treatment, which can dramatically alter its natural history.
In most hypertensive patients, both the systolic and diastolic pressure are raised, but there are circumstances in which only one of them is high. The most common circumstance is isolated systolic hypertension of the elderly, in which the pathophysiology is quite different from that of other types of hypertension, as described below. Systolic hypertension also occurs in young adults, but the mechanism is different. Isolated elevation of the diastolic pressure can also occur. Hypertension can also be situational: the traditional methods of classification have all been based on office or clinic blood pressure measurements, but with the wider use of out-of-office blood pressure measurement, it is increasingly recognized that office measurements may significantly over- or underestimate the blood pressure level during daily life. In most hypertensive patients the blood pressure is higher in the office than at other times, a phenomenon referred to as the white coat effect and that is usually defined as the difference between the office pressure and the average daytime pressure.
The JNC 7 classification1 has continued the definition of hypertension as a blood pressure exceeding 140/90 mm Hg for adults age 18 years or older. The classification is based on the average of two or more seated blood pressures, properly measured with well-maintained equipment, at each of two or more visits to the office or clinic. Hypertension has been divided into stages 1 and 2, as shown in Table 68–1. JNC 7 has defined normal blood pressure as <120 and <80 mm Hg. The intervening levels, 120 to 139 and 80 to 89 mm Hg, are now defined as prehypertension, a group that has an intermediate level of risk and that may progress to definite hypertension.
| Blood Pressure Classification | Systolic Blood Pressurea (mm Hg) | Diastolic Blood Pressurea (mm Hg) |
|---|---|---|
| Normal | <120 | <80 |
| Prehypertension | 120-139 | 80-89 |
| Stage 1 hypertension | 140-159 | 90-99 |
| Stage 2 hypertension | ≥160 | ≥100 |
It is estimated that approximately 15% of blood pressure–related deaths from coronary heart disease occur in individuals with blood pressure in the prehypertensive range.3 The main justification for JNC 7’s concern about prehypertension was two publications from the Framingham Heart Study.4,5 The first showed that people who have blood pressure in the high-normal or prehypertensive range do have a higher risk of heart disease and stroke than do people with blood pressures below this level. They are also more likely to progress to real hypertension (>40/90 mm Hg).4 The second publication stated that the lifetime risk of hypertension approaches 90%.5 This is somewhat misleading, however, because the criterion for hypertension was a blood pressure above 140/90 mm Hg or being put on antihypertensive treatment. Although a pressure above 140 mm Hg in an older person predicts increased risk, there are no studies showing that treating systolic pressure between 140 and 160 mm Hg in people older than age 65 years is beneficial. For the more relevant criterion of a systolic pressure higher than 160 mm Hg or being on treatment, the lifetime risk was closer to 70% for both men and women.
The numbers of prehypertensive individuals are huge: A recent analysis of the National Health and Nutritional Examination Surveys (NHANES) data found that 39% of adults older than 20 years are normotensive, 31% are prehypertensive, and 29% are hypertensive.6 The recommended treatment of prehypertension is lifestyle changes, but a recent study found that 2 years of antihypertensive drug treatment delayed the onset of hypertension after the treatment was discontinued.7
Malignant hypertension is diagnosed not only by the height of the blood pressure, but also by the manifestations of target organ damage, particularly retinal hemorrhages and papilledema. The critical pathologic change is the presence of fibrinoid necrosis in the arterial walls, which may be responsible for the manifestations such as hypertensive encephalopathy and impaired renal function.8 Its importance lies in the fact that if untreated, it has a 5-year survival rate of 1%.9 It is still common in underdeveloped countries such as Nigeria,10 and in western countries such as the United Kingdom it is typically seen in immigrants.8 It can result from essential or secondary hypertension. Treatment of malignant hypertension has a dramatic effect on survival, and the first article demonstrating the benefits of antihypertensive drugs was based on patients with malignant hypertension.11
In many older adults, systolic blood pressure tends to rise and diastolic to fall. When the average systolic blood pressure is ≥140 mm Hg and diastolic blood pressure is <90 mm Hg, the patient is classified as isolated systolic hypertensive. The increased pulse pressure (systolic-diastolic) and systolic pressure predict risk and determine treatment.12 It is described further below.
In older children and young adults, often athletic males, a high systolic pressure in the brachial artery but normal diastolic and mean pressures is not an uncommon finding.13 The high systolic pressure may be the result of two changes: a high stroke volume and increased arterial stiffness. In contrast to essential hypertension, which raises both systolic and diastolic pressures, peripheral resistance is not increased.14
More commonly seen in some younger adults, the average systolic pressure remains <140 mm Hg but the diastolic is ≥90 mm Hg. Although diastolic pressure is generally thought to be the best predictor of risk in patients younger than age 50 years,15 some prospective studies of isolated diastolic hypertension have indicated that the prognosis may be benign.16 However, an analysis of data from the Framingham Heart Study concluded that isolated diastolic hypertension may evolve into systolic and diastolic hypertension.17 Thus any patients in whom this diagnosis is made should be carefully followed.
In approximately 15% to 20% of people with stage 1 hypertension, blood pressure may only be elevated persistently in the presence of a health care worker, particularly a physician. When measured elsewhere, including while at work, the blood pressure is not elevated. When this phenomenon is detected in patients who are not taking medications, it is referred to as white coat hypertension or isolated office hypertension. The commonly used definition is a persistently elevated average office blood pressure of >140/90 mm Hg and an average awake ambulatory reading of <135/85 mm Hg.18 Although it can occur at any age, it is more common in older men and women. White coat hypertension is the result of an exaggerated white coat effect, which may be a conditioned anxiety response.19 This assertion was recently confirmed by Ogedegbe et al in a study in which patients with white coat hypertension reported significantly higher levels of state anxiety compared with other hypertension diagnostic categories.20 Its magnitude can be reduced (but not eliminated) by the use of stationary oscillometric devices that automatically determine and analyze a series of blood pressures over 15 to 20 minutes with the patient in a quiet environment in the office or clinic. White coat hypertension is generally thought to have a relatively benign prognosis, although in some patients it may progress to definite sustained hypertension, and the risk may increase with long-term follow-up, for example, after more than 5 years.21 Hence all patients need to be followed indefinitely with office and out-of-office measurements of blood pressure. Treatment with antihypertensive drugs may lower the office blood pressure but does not change the ambulatory measurement. This pattern of findings suggests that drug treatment of white coat hypertension is less beneficial than treatment of sustained hypertension.
The mirror image of white coat hypertension, masked hypertension is defined as a normal office blood pressure (<140/90 mm Hg) together with an elevated daytime pressure (>135/85 mm Hg). It was recognized only relatively recently,22 but is important because it is associated both with target-organ damage23 and an adverse prognosis.24 It has been detected both in subjects who have not been diagnosed or treated for hypertension and in patients on antihypertensive treatment.24,25 In either case, the implications are the same: the prognosis is related to the out-of-office blood pressure more closely than to the office pressure. It has been detected using both ambulatory and home blood pressure monitoring.26 Lifestyle can contribute to this; for example, alcohol, tobacco, caffeine consumption, and physical activity away from the clinic/office.
In some elderly patients the peripheral muscular arteries become very rigid from advanced, and sometimes calcified, arteriosclerosis. Consequently, the cuff has to be at a higher pressure to compress them, so that a falsely high blood pressure is recorded. It is difficult to detect clinically, so these patients may be overdosed with antihypertensive medications, inadvertently resulting in orthostatic hypotension and other side effects. One noninvasive technique that has been described to detect orthostatic hypotension is the Osler maneuver, which is the ability to palpate the brachial or radial artery when a sphygmomanometer cuff is inflated to well above the systolic pressure (positive Osler sign). Unfortunately, the Osler maneuver is not a reliable screen for pseudohypertension: It may be positive in the absence of pseudohypertension in a third of patients.27 It has been suggested that blood pressure recorded from the finger may be less susceptible to the increased rigidity of the larger arteries. Using a definition of a systolic pressure difference between the brachial artery and the finger of more than 30 mm Hg, it has been estimated that 2.5% of subjects older than age 65 years may have pseudohypertension.28
This is defined as a reduction of systolic blood pressure of at least 20 or 10 mm Hg in diastolic blood pressure within 3 minutes of quiet standing.29 An alternative method is to detect a similar fall during head-up tilt at 60 degrees. This may be asymptomatic or accompanied by symptoms of light-headedness, faintness, dizziness, blurred vision, and cognitive impairment.30 If chronic, the fall of blood pressure may be part of pure autonomic failure, or a complication of diabetes. The major life-limiting failure is inability to control the level of blood pressure, especially in those patients with orthostatic hypotension who concomitantly have supine hypertension. In these patients, there are great and swift changes in pressure so that the patients faint as a result of profound hypotension on standing and have very severe hypertension when supine. Often the heart rate is fixed as well. The supine hypertension subjects them to serious consequences such as left ventricular hypertrophy31 and stroke.31-33
In more than 95% of cases of hypertension, no single and reversible cause can be detected, and the terms essential and primary hypertension have been used. The former term was introduced because it was thought that a higher-than-usual level of blood pressure was needed to maintain perfusion of vital organs.
In approximately 5% of cases there is a definable cause of the hypertension. Table 68–2 shows a list adapted from JNC 7.1 From an epidemiologic point of view, the two most important conditions on the list are chronic kidney disease and sleep apnea. Although chronic kidney disease is certainly a major cause of hypertension, it is often hard to decide whether the hypertension or the kidney disease came first, because a vicious cycle can develop where one condition exacerbates the other. In practice, however, this distinction is of little consequence, as most forms of chronic kidney disease are not reversible. The most common curable form of hypertension is renal artery stenosis, which has two principal causes: fibromuscular disease in children and young adults, and atherosclerosis in middle-age and older patients.
| Condition |
|---|
| Chronic kidney disease |
| Renal artery stenosis |
| Cushing disease |
| Coarctation of the aorta |
| Drug-induced hypertension |
| Obstructive uropathy |
| Pheochromocytoma |
| Primary aldosteronism and other causes of mineralocorticoid excess |
| Sleep apnea |
| Thyroid/parathyroid disease |
Sleep apnea is emerging as one of the major causes of hypertension that is of epidemiologic significance. A population survey that 2% of women and 4% of men have sleep apnea, which was defined as having an apnea–hypopnea index (AHI) score of 5 or more and daytime sleepiness.34 The prevalence of an AHI of ≥5 increases with age, reaching a maximum prevalence in a population at approximately the age of 70 years.35 Both sleep apnea and hypertension are common, and unsurprisingly there are many individuals who have both conditions. Furthermore, both are closely linked to obesity (particularly central obesity, as seen in the metabolic syndrome), so there is a cluster of related syndromes: hypertension, sleep apnea, diabetes, and the metabolic syndrome. Thus approximately 60% of sleep apnea patients are hypertensive,36 and, conversely, approximately 25% of hypertensive patients have sleep apnea.37,38 One issue is the causal link between sleep apnea and hypertension. The largest study of this is the Sleep Heart Health Study, which is a prospective study of the relationship between sleep apnea and cardiovascular morbidity. In an initial cross-sectional study of 6132 subjects age 40 years or older,39,40 there was a dose–response relationship between the AHI score and the prevalence of hypertension, although some of it was attributable to the effects of increased body mass index. The association between sleep apnea and hypertension was seen in both sexes, at older and younger ages, and among normal and overweight groups. In elderly patients with systolic hypertension, however, there appears to be no relationship between sleep apnea and hypertension.41
To establish that sleep apnea is an independent risk factor for the development of essential hypertension, it is necessary to be able to demonstrate that it precedes and predicts the onset of hypertension and that there is a dose–response relationship between the two. This was achieved most convincingly by the Wisconsin Sleep Cohort Study, which found a consistent dose–response relationship, even after controlling for age, sex, body mass index, and antihypertensive medications.42,43
There is a fundamental difference between the genesis of hypertension in young and older patients (Table 68–3). The most obvious difference is that in the younger patients, whatever the underlying etiology of the hypertension (with a few exceptions noted below), both systolic and diastolic pressure are raised, whereas in people older than age 60 years, the diastolic pressure starts to fall (Fig. 68–2), but there is a marked increase of systolic pressure. The underlying hemodynamics are also different: in younger patients, the characteristic changes are an increased peripheral resistance with a normal cardiac output, whereas in older patients, the reason for the selective increase of systolic pressure is increased arterial stiffness. This has two consequences: first, when the left ventricle pumps into a stiffened aorta, there will be a higher systolic pressure because the stiffer vessel will be less able to accommodate the stroke volume. The second is that the velocity of the arterial pulse wave traveling out to the peripheral vessels will be increased. Just like a wave resulting from a stone dropped in a pool, the wave is reflected when it reaches the periphery, so that the pressure waves in the circulation will be a combination of the outgoing and reflected waves. In younger people, where the pulse wave velocity is low, the reflected wave arrives relatively late and coincides with the diastolic downslope of the incident wave, so that it has no effect on the systolic or diastolic pressure. But in older individuals it returns earlier and forms a second or late systolic peak, which augments the height of the systolic pressure. Another difference concerns the physiologic measurements: in younger patients the increased peripheral resistance is a result of active vasoconstriction that is mediated hormonally, particularly by the sympathetic nervous system and the renin–angiotensin system. In older patients with systolic hypertension, hormonal mediation is less important and the changes are mostly mechanical, for example, loss of elastin fibers in the media of the arterial wall.44 The affected vessels (principally the aorta and central elastic vessels) dilate and stiffen. The effects of increased aortic stiffness may be bidirectional, that is, hypertension will itself increase arterial stiffness, so there may be a vicious cycle.45 Sleep apnea, the hypertensive effects of which are thought to be mediated by the sympathetic nervous system, is related to hypertension in younger patients, but not to isolated systolic hypertension in the elderly. Sleep apnea is associated with hypertension in younger patients, but not with systolic hypertension in patients older than age 60 years.41
Figure 68–2
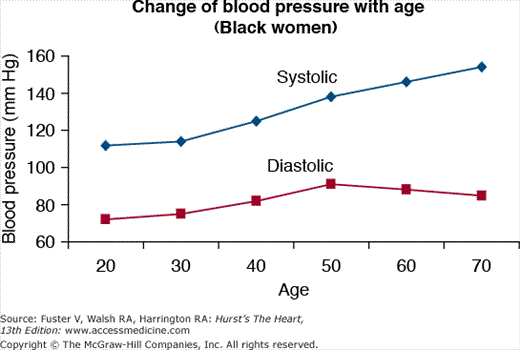
Changes of systolic and diastolic pressure with age in black women. Data from National Health and Nutritional Examination Surveys (NHANES). Note the decrease in diastolic pressure after age 50 years. Adapted from Burt VL, Whelton P, Roccella EJ, et al. Prevalence of hypertension in the U.S. adult population. Results from the Third National Health and Nutrition Examination Survey, 1988–1991. Hypertension. 1995;25:3305-3313.
| Factor | Young (<60 y) | Old (>60 y) |
|---|---|---|
| Blood pressure increase | Systolic and diastolic | Systolic |
| Major cause | Hormonal | Mechanical |
| Hemodynamic change | Increased peripheral resistance | Increased arterial stiffness |
| Sleep apnea | Yes | No |
| Treatment threshold | 140/90 mm Hg | 160 mm Hg systolic |
Treatment thresholds are also different. In younger patients it is clearly established that starting drug treatment when the pressure exceeds 140/90 mm Hg is beneficial. This may also be true in older patients, but the clinical trials that have investigated the benefits of treatment have almost all used an initial systolic pressure of greater than 160 mm Hg as an entry criterion and have not lowered the pressure to below 140 or 150 mm Hg.46 Thus the benefits of treatment in older patients with systolic pressures below 160 mm Hg remain unproven.
There is some evidence that in the very old (age 85 years or older), mortality may be higher in patients with the lowest blood pressures47 and that lowering the diastolic pressure with treatment may actually increase mortality.48 The benefit or harm of treating very old patients is currently being evaluated.49
The Prevalence of Hypertension
The NHANES, which has been studying the health of representative samples of Americans since 1960, has provided data on the changing prevalence of hypertension and its control. According to this, the prevalence of hypertension decreased somewhat between 1960 and 1991,50 but the latest published analysis by the Centers for Disease Control and Prevention (CDC),51 based on data obtained in the period 1999 to 2002, reported that the prevalence had increased by 3.6% and that 28.6% of participants had hypertension (defined by a systolic pressure >140 mm Hg, a diastolic >90 mm Hg, or taking antihypertensive medications). When generalized to the entire US population, this number translates to 58.4 million Americans (~1 in 4) being hypertensive (Fig. 68–3). Factors associated with increased prevalence of hypertension included increasing age, obesity, and African American race. Another quarter of US adults have a blood pressure in the prehypertension range, a systolic blood pressure of 120 to 139 mm Hg, or diastolic blood pressure of 80 to 89 mm Hg. The prevalence of hypertension rises progressively with age, such that more than half of all Americans age 60 years or older have hypertension.
Figure 68–3
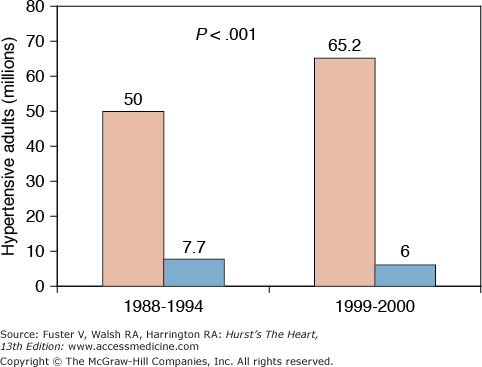
Increased prevalence of hypertension in the United States over a 10-year period. Data from National Health and Nutritional Examination Surveys (NHANES). Pale bars show prevalence of hypertension diagnosed by a blood pressure >140/90 mm Hg or taking antihypertensive medications. Dark bars show prevalence of subjects with normal blood pressure on examination, but who had previously been diagnosed as hypertensive. Adapted from Centers for Disease Control and Prevention (CDC).51
Surveys in Europe show much higher rates of hypertension.52 A comparison of seven European countries’ data found the highest rate in Germany (55%) and the lowest in Italy (38%), with France, England, Spain, and Sweden all showing a prevalence between these two extremes. The prevalence in Canada is very similar to that in the United States (27%).52 The reasons for these wide differences are unknown, but do not appear to be because of differences in measurements or sampling rates. In Egypt the rate is also approximately 25%, whereas in China, where much of the population is still rural, the rate is lower (14%), but is increasing rapidly.53
In the United States, hypertension is significantly more prevalent in African Americans than in whites. In the most recent NHANES survey,54 the prevalence in African American men was 38.6%, whereas in white men it was 29.6%; in women the prevalence was 44% for African Americans and 29.6% for whites (Fig. 68–4). A big issue here is whether the higher prevalence is genetic or environmental. Although the prevalence is higher than in whites in other countries, for example, Brazil,55 there is a large body of literature showing that the rates of hypertension in Africans living in traditional rural societies are relatively low, but increase markedly when they move to the cities.56
Figure 68–4

Prevalence of hypertension in US men and women from three different ethnic groups. Adapted from Centers for Disease Control and Prevention (CDC).51
A huge effort has already been made to try to understand the reasons for the higher prevalence of hypertension in African Americans, almost all of which has made the underlying assumption that there is some genetically determined physiologic difference. So far, the results have been disappointing at best.57 For one thing, it is becoming clear that, with rare exceptions, human hypertension is determined by several genes, and it is unlikely that genetic factors account for more than 50% of hypertension. A recent comparative study involving large surveys of blood pressure in populations of European versus African descent outside the United States indicated a lower range of hypertension prevalence in blacks (14%-44%) than in whites (27%-55%).58 One of the most powerful pieces of evidence that environmental, particularly psychosocial, factors are important in the development of hypertension is a series of epidemiologic studies going back for many years, which have shown that when people move from a traditional rural setting to an urban westernized lifestyle, their blood pressure goes up. Many of these studies have been conducted in Africa, and hypertension is (or was) relatively rare in rural Africans. A good example is the Luo study from Kenya.56 People who had moved to Nairobi had higher pressures than people living in the villages, even if they had only been in the city for a month. They also had higher heart rates, consistent with activation of the sympathetic nervous system. A recent review reported the same pattern of distribution for other countries in Sub-Saharan Africa.59 Although these studies indicate that there is something pressor about our Western lifestyle, they do not tell us whether it is stress or diet that is more important (it is probably both). Studies from other countries also show that the higher blood pressures seen in blacks are not invariable. The Health Surveys for England (equivalent to the NHANES in the United States) found that the prevalence of hypertension was much higher in blacks than whites, even after controlling for potential mediators such as age, body mass index, and alcohol intake.60 However, another study conducted in English factory workers found no ethnic differences in blood pressure.61 Socioeconomic status, which is strongly associated with ethnicity in the United States, affects the prevalence of hypertension, particularly in African Americans.62 A series of classic studies conducted by Ernest Harburg in Detroit in the 1970s was the first to really get at this question.63,64 He showed that blood pressure in African Americans living in the inner city was highest in those people living in the worst-off neighborhoods. A more recent analysis of the ARIC (Atherosclerosis Risk in Communities) study by Diez-Roux et al65 found that “neighborhood” effects were independently related to blood pressure after controlling for other risk factors. In four US communities, people living in the neighborhoods with the lowest median house prices tended to have the highest blood pressure. This was most pronounced in the one community (Jackson, MI) that was largely African American.
The fastest-growing segment of the US population is Hispanics or Latinos, who are overtaking African Americans as the largest minority group. Between 1980 and 1990 the Hispanic population increased by 39%, whereas the overall US population increased by only 7%.66 Many are recent immigrants, and they tend to be of relatively low socioeconomic status. If psychosocial factors are so important in determining the socioeconomic status gradient of disease, one might expect that Hispanics would also have higher mortality rates than whites. Surprisingly, this does not appear to be the case. According to the National Center for Health Statistics,67 the age-adjusted death rates for heart disease are 121.9 per 100,000 for whites, 183.3 for African Americans, and 84.2 for Hispanics. For stroke, the corresponding figures are 23.3, 41.4, and 19.0, and for cancer 121.0, 161.2, and 76.1. Thus for all these conditions the rates appear to be lower, not higher, for Hispanics.
There are two major subgroups of Hispanics in the United States: those from Mexico and Latin America, who are predominant in states such as Texas and California, and those of Caribbean origin, who are mostly in the Northeast and Florida. The literature on hypertension in Hispanics is both sparse and confusing. The gold standard for defining the prevalence of hypertension in different groups of the US population is NHANES, which has now conducted four surveys that have included blood pressure measurement. Race/ethnicity is self-defined by necessity and is classified into four groups: non-Hispanic whites, non-Hispanic blacks, Mexican Americans, and “other groups.” Non-Mexican American Hispanic whites and blacks are put in the last category. To obtain more reliable figures for differences between groups, each survey oversampled African Americans and Mexican Americans. The latest results, published in 2005,51 were based on a survey conducted in 1999 and 2002, the results of which were compared with two earlier surveys (1988-1991 and 1991-1994). There were parallel ethnic differences in all three surveys, with non-Hispanic blacks (African Americans) having the highest prevalence of hypertension (40.5% in 1999-2002), and Mexican Americans the lowest (25.1%); whites were in the middle (27.4%). The lower rates in Mexican Americans cannot be attributed to better awareness or treatment of hypertension, as both measures were lower in them than in either of the other two groups: in 1999 to 2002, the percentages of hypertensive individuals who were on treatment were 55.4% for African Americans, 48.6% for whites, and only 34.9% for Mexican Americans.
Some early studies suggested that, despite higher rates of obesity and diabetes in Mexican Americans, they have a lower all-cause and cardiovascular mortality than whites,68 leading to what has been called the Hispanic paradox. However, the most recent analysis from the San Antonio Heart Study found just the opposite, namely that mortality from cardiovascular disease is approximately 60% higher in Mexican Americans than whites.69 This is the largest prospective study of Hispanics, so its findings command respect. The authors attribute the contrary findings of the earlier studies to underreporting of deaths in Mexican Americans.
There is very little published information about the prevalence of hypertension and cardiovascular disease in Caribbean Hispanics. One study that has begun to look at the issue is the Northern Manhattan Stroke Study (NOMAS),66 which includes a high proportion of Caribbean Hispanics. In the control group, both hypertension and diabetes were more common in blacks and Hispanics than in whites: for hypertension the rates were 62%, 58%, and 43%, respectively. An interesting survey was conducted in Cuba,70 where everyone can claim to be “Hispanic,” but where there is also a mix of people of European origin (whites) and African origin (blacks). The prevalence of hypertension was only minimally higher in the blacks (46%) than in the whites (43%), which the authors attributed to the fact that socioeconomic differences between blacks and whites are much smaller in Cuba than in the United States. The ethnic difference was also small in comparison with the situation reported in Puerto Rico, where statistical adjustment for social class narrowed the gap between blacks and whites.71
There are also differences in the prevalence of hypertension in other ethnic groups. Hypertension tends to be relatively uncommon in Japanese Americans, whereas Filipinos have rates approaching those of African Americans.72 In American Indians, the prevalence of hypertension is similar to that of American whites, despite a higher prevalence of obesity.73
Hypertension and Risk
Data from numerous observational epidemiologic studies provide persuasive evidence of the direct relationship between blood pressure and cardiovascular disease. In a recent meta-analysis that aggregated data across 61 prospective observational studies that together enrolled 958,074 adults,74 there were strong, direct relationships between average blood pressure and vascular mortality. These relationships were evident in middle-age and older individuals (Fig. 68–5). Importantly, there was no evidence of a blood pressure threshold; that is, vascular mortality increased progressively throughout the range of blood pressure, including the prehypertensive range, down to a systolic pressure of 115 mm Hg and a diastolic of 75 mm Hg. Between the ages of 40 and 70 years, each 20-mm Hg increment of systolic pressure (and 10-mm Hg of diastolic pressure) is associated with a doubling in the risk of stroke. The slope of the lines relating blood pressure and risk are shallower for older people.
Figure 68–5
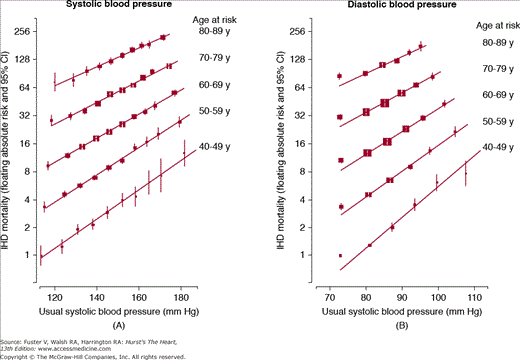
Relationships between systolic and diastolic pressure with deaths from coronary heart disease in 958,074 adults from the Prospective Studies Collaboration. IHD, ischemic heart disease. Reproduced with permission from Prospective Studies Collaboration.74
A continuing debate in the field of hypertension is the relative importance of the different components of the arterial pressure wave in determining cardiovascular risk. There are four candidates: systolic, diastolic, pulse, and mean pressure. An additional issue is whether the traditional brachial artery pressure should be used or the central aortic pressure. For many years the diastolic pressure reigned supreme, and most of the early hypertension treatment trials used a high diastolic pressure as an entry criterion. This was reinforced by the publication of an analysis by MacMahon and coworkers75 based on pooled data from 420,000 subjects, which showed a log-linear relationship between diastolic pressure and the risk of stroke and myocardial infarction. Although the importance of systolic pressure was never in doubt, it gained precedence over diastolic pressure with the publication of a series of epidemiologic studies showing not only that a high systolic pressure was the best predictor of risk in the elderly, but also that a low diastolic pressure was associated with increased risk.76 An analysis by Franklin and coworkers15 examined the Framingham Heart Study data and provided an elegant solution to this apparent paradox. In subjects younger than age 50 years, the best predictor of risk was a high diastolic pressure, but in those older than age 60 years, systolic pressure was the best predictor, and the relationship between diastolic pressure and risk was now negative, so that a low diastolic pressure was related to higher risk.


