Doppler may be applied to determine the peak velocity in the region. Continuous-wave Doppler emits and listens simultaneously. Thus, continuous-wave Doppler will assess all velocities within a line of interrogation—velocities within as well as proximal to and distal to the site of interest. Combining pulsed-wave and continuous-wave Doppler when assessing disturbed flow patterns is ideal to give the location of the turbulence and the maximum velocity.
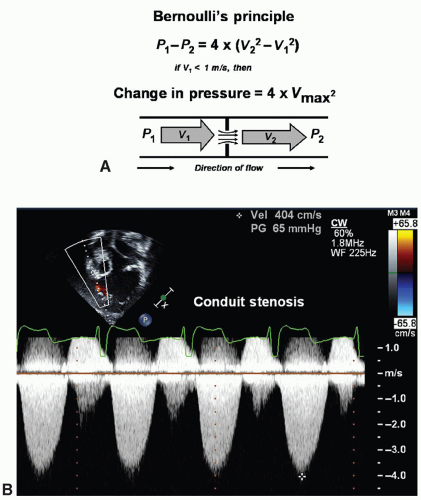 Fig. 72.1. (A) The Bernoulli principle defines the relationship between kinetic energy (velocity) and potential energy (pressure drop) across a discrete stenosis such that inertial and frictional forces can be ignored. (B) Practical example of the use of the Bernoulli principle. Continuous-wave Doppler measurement across a stenotic right ventricular to pulmonary artery conduit in a patient with L-transposition of the great arteries after atrial switch operation and Rastelli procedure. The peak velocity is 4 m/sec generating a peak instantaneous gradient across the conduit of 65 mmHg. |
Table 72.1 Views and Sweeps for Echocardiographic Imaging of the Child with Suspected Congenital Heart Disease | ||||||||||||||||||||||||||||||||||||||||||||||||||||
|---|---|---|---|---|---|---|---|---|---|---|---|---|---|---|---|---|---|---|---|---|---|---|---|---|---|---|---|---|---|---|---|---|---|---|---|---|---|---|---|---|---|---|---|---|---|---|---|---|---|---|---|---|
| ||||||||||||||||||||||||||||||||||||||||||||||||||||
anomalous pulmonary venous connection (TAPVC). A left superior vena cava has no hemodynamic significance in the structurally normal heart. Typically, this vessel crosses anterior to the left pulmonary artery and enters the coronary sinus posteriorly. However, bilateral superior venae cavae are common in heterotaxy syndrome. Identification of this anomaly becomes important particularly if single-ventricle palliation is planned (Fig. 72.5). Without a bridging vein between the superior venae cavae, a bilateral bidirectional superior cavopulmonary anastomosis is necessary in single-ventricle palliation; when a large enough bridging vein is present, the left superior vena cava can be ligated rather than connected to the pulmonary artery. In heterotaxy syndrome, the left superior vena cava may empty directly into the left atrium or by way of an unroofed coronary sinus resulting in a right-to-left shunt.
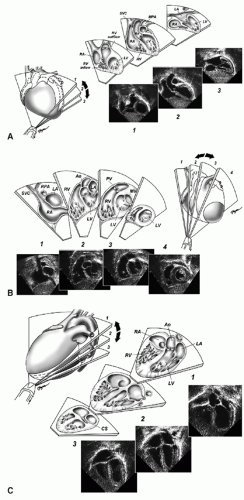 Fig. 72.2. (A) Subcostal frontal sweep. Coronal plane with sweep from anterior (position 1) to posterior (position 3). At position 1, structures visualized include the right ventricular outflow tract and the apex of the left ventricle. At position 2, the left ventricular outflow tract is seen. At position 3, the right and left atria and atrial septum are highlighted. Ao, aorta; LA, left atrium; LV, left ventricle; MPA, main pulmonary artery; RA, right atrium; RV, right ventricle; SVC, superior vena cava. (All tomographic sweep and view figures are reproduced with permission from Lai WW et al. Guidelines and standards for performance of a pediatric echocardiogram: a report from the Task Force of the Pediatric Council of the American Society of Echocardiography. J Am Soc Echocardiogr 2006;19:1413-1430.) (B) Subcostal sagittal sweep. Sagittal plane sweep from right to left. At position 1, the entry of the superior vena cava is seen. At position 2, the right ventricle inflow and outflow is visualized. At position 3, the short axis of the left ventricle and the right ventricle cavity wrapping around anteriorly are seen, and at position 4, the apex of the left ventricle. Ao, aorta; LV, left ventricle; RA, right atrium; RPA, right pulmonary artery; RV, right ventricle; SVC, superior vena cava. (C) Apical four-chamber view demonstrates the atria, ventricles, and atrioventricular valves. Posterior angulation visualizes the coronary sinus; anterior angulation visualizes the left ventricular outflow tract and proximal aorta. Ao, aorta; CS, coronary sinus; LA, left atrium; LV, left ventricle; RA, right atrium; RV, right ventricle. (D) Parasternal long axis views with sweep from rightward/inferior (position 1), which focuses on the tricuspid valve and right ventricle inflow to leftward/superior (position 2) with visualization of the right ventricle outflow and pulmonary valve. At position 2, the mitral valve, left ventricle inflow, left ventricle outflow tract, and aortic valve in long axis are well seen. Ao, aorta; LA, left atrium; LV, left ventricle; PA, pulmonary artery; RA, right atrium; RV, right ventricle. (E) Parasternal short-axis sweep from superior (position 1) to inferior (position 3). Structures viewed in sequence in this sweep include the aortic valve in cross section with the identification of valve leaflets, course of the coronary arteries, conal septum, pulmonary valve, ventricular septum, mitral valve, papillary muscles, muscular septum, right ventricle cavity, and left ventricle cavity. LA, left atrium; LV, left ventricle; MV, mitral valve; PMs, papillary muscles; RA, right atrium; RV, right ventricle; TV, tricuspid valve. (F) Suprasternal frontal view. Structures well seen include the innominate vein, superior vena cava, pulmonary arteries, and pulmonary vein entry into the left atrium. Ao, aorta; Innom V, innominate vein; PVs, pulmonary veins; RPA, right pulmonary artery. (G) Suprasternal arch view, also known as the “candy cane view” as the ascending and descending aorta are displayed with the origin of cephalic vessels. Ao, aorta; Innom V, innominate vein; RPA, right pulmonary artery. |
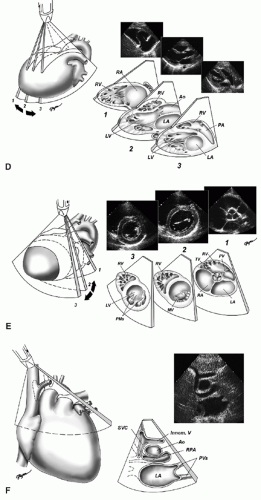 Fig. 72.2. (Continued) |
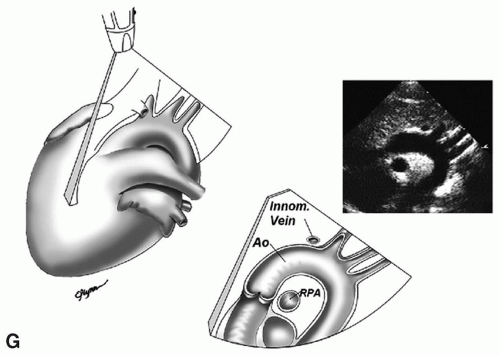 Fig. 72.2. (Continued) |
 Fig. 72.3. Coronal view used to determine situs. Situs solitus or normal situs is seen with the aorta to the left of the spine and the inferior vena cava (IVC) running through the liver on the right. |
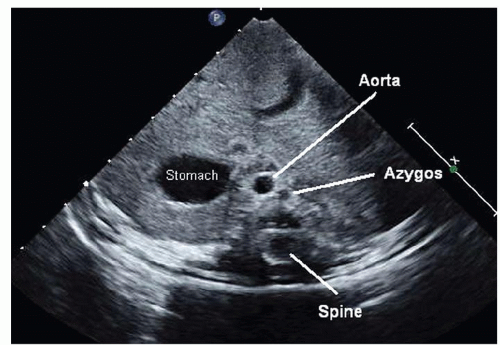 Fig. 72.4. Coronal view in a patient with polysplenia type of heterotaxy syndrome. The stomach is left-sided, the aorta runs to the right along the spine, and there is interruption of the inferior vena cava such that the azygos runs adjacent to the aorta and inserts into the left superior vena cava (not seen). |
Stay updated, free articles. Join our Telegram channel

Full access? Get Clinical Tree


