Diffuse Lung Disease
Imaging has a number of important goals in the patient with diffuse lung disease:
Differential diagnosis;
Specific diagnosis, if possible;
Delineation of extent of disease—may influence choice or locus of therapy, such as in outpatient pneumonia, and may allow subsequent evaluation of response to therapy;
Location of disease—may be helpful if biopsy becomes necessary for diagnosis;
Demonstration of associated abnormalities (such as in the mediastinum and upper abdomen)
The major diagnostic imaging tools that are generally applied to patients with diffuse lung disease are the chest radiograph (CXR) and chest high resolution computed tomography (HRCT). This chapter focuses on patterns of abnormality using these imaging tools, diagnosis and differential diagnosis (including mnemonics), and the advantages and disadvantages of CXR and HRCT. The radiographic part of this chapter is largely the work of Barry Gross, who as a disciple of Benjamin Felson is more than well qualified for this. The discussion that follows echoes true to the teaching “at the alternator” and comes from teaching conferences for which he has been applauded by his trainees. The second part of this chapter on HRCT focuses on the specific disease processes and patterns of abnormality as they relate to HRCT interpretation.
Chest Radiograph and Pattern Recognition of Diffuse Lung Disease
There has been a great deal of concern over the past few years about plagiarism in academic circles, especially among historians. I am hoping to dance around that subject by telling everyone in no uncertain terms that everything I know about pattern recognition I learned from Ben Felson. It is, of course, far less than he knew about it. Still, this is the best new material you can get from Ben and me in the twenty-first century.
As I was taught, I do not discuss alveolar (or airspace) and interstitial diseases; I simply discuss CXR patterns of abnormality. There is an interesting overlap of diseases that produce given CXR patterns, some alveolar, some interstitial, and many mixed in anatomic distribution.
Still, the goal of using a CXR is to generate an appropriate differential diagnosis, and this we can often do. Let us consider various patterns of diffuse lung disease, considering how to recognize the pattern and then how to generate a differential diagnosis.
Still, the goal of using a CXR is to generate an appropriate differential diagnosis, and this we can often do. Let us consider various patterns of diffuse lung disease, considering how to recognize the pattern and then how to generate a differential diagnosis.
Table 14.1: Chest Radiographic Findings of Alveolar Disease | |
|---|---|
|
Alveolar Disease
The radiographic hallmarks of alveolar disease are listed in Table 14.1. They include air bronchograms and ill-defined borders. Structures in the lungs are usually well outlined because of air in the alveoli; when the alveoli are filled with abnormality, there is nothing left to provide sharp margination. Alveolar disease may also have a characteristic distribution. For example, focal alveolar disease generally respects the anatomic barriers in the lungs, such as the pleural fissures, therefore demonstrating a lobar or segmental distribution (Fig. 14.1). Other characteristic distributions of more diffuse disease include the “butterfly” or “batwing” appearance (Fig. 14.2), predominantly occupying the central perihilar regions, typical of pulmonary edema, and a reverse batwing appearance of eosinophilic pneumonia. Areas of alveolar disease often coalesce together to form larger areas of alveolar disease (Fig. 14.3). Temporally speaking, alveolar disease processes often change quickly from day to day or even hour to hour.
Air bronchograms and ill-defined edges are the hallmark of alveolar disease.
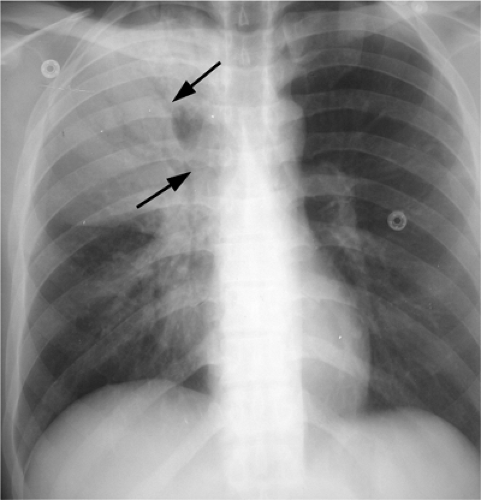 Figure 14.1 Airspace disease in pneumonia, demonstrating air bronchograms and lobar distribution. Posteroanterior chest radiograph reveals branching lucencies (arrows) surrounded by right upper lobe airspace disease. Note that disease stops abruptly at its caudal margin, where the minor fissure resides. |
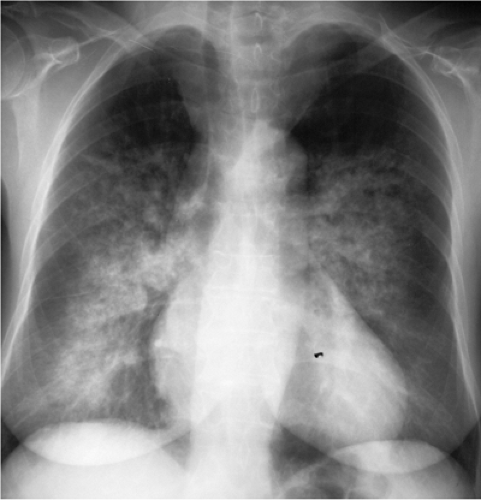 Figure 14.2 Diffuse airspace disease in a “butterfly” distribution, a result of pulmonary hemorrhage in chronic renal failure. Peripheral margins of abnormality are poorly defined. |
When alveolar disease is present, the key diagnostic question to ask is whether it is acute or chronic. The answer to that question may be supplied by history; a patient may be able to tell you that he or she was fine until yesterday (acute) or has been symptomatic for 4 months (chronic). Furthermore, a patient who is seriously ill (e.g., an intensive care unit patient) virtually always has acute disease; an asymptomatic patient with significant CXR evidence of alveolar disease usually has chronic abnormality. Old radiographs are another avenue for determining acuteness or chronicity. However, they are sometimes misleading (Fig. 14.4).
Establishing whether alveolar disease is acute or chronic changes the differential diagnosis.
Acute alveolar disease has an easy differential diagnosis, as listed in Table 14.2. It is blood or pus or water. Some radiologists like to add cells so they can include adult respiratory distress syndrome in the differential diagnosis; because I think of adult respiratory
distress syndrome along the lines of noncardiogenic pulmonary edema, I get to the same end point by a different route. Cells from lymphoma or bronchoalveolar cell carcinoma also fall under that category. Blood or pus or water means that we should consider pulmonary hemorrhage, pneumonia, and edema. Pulmonary hemorrhage is a relatively uncommon cause and is often (although not always) associated with hemoptysis or anemia. Practically speaking, acute alveolar disease is usually pneumonia or pulmonary edema. Finally, some would add a category for protein to cover diseases such as alveolar proteinosis or silicoproteinosis.
distress syndrome along the lines of noncardiogenic pulmonary edema, I get to the same end point by a different route. Cells from lymphoma or bronchoalveolar cell carcinoma also fall under that category. Blood or pus or water means that we should consider pulmonary hemorrhage, pneumonia, and edema. Pulmonary hemorrhage is a relatively uncommon cause and is often (although not always) associated with hemoptysis or anemia. Practically speaking, acute alveolar disease is usually pneumonia or pulmonary edema. Finally, some would add a category for protein to cover diseases such as alveolar proteinosis or silicoproteinosis.
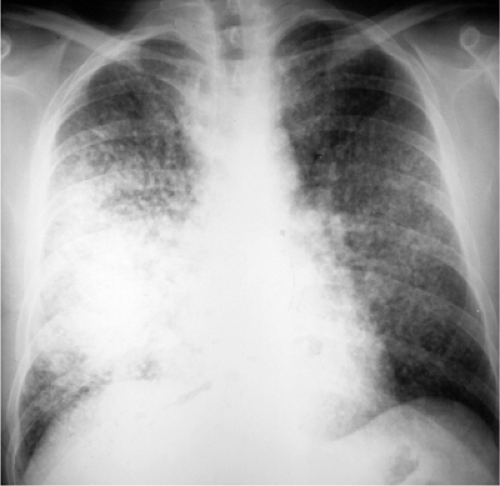 Figure 14.3 Alveolar nodules caused by bronchoalveolar carcinoma, best visualized in the right upper lobe. Nodules become confluent in the right mid-lung, and there are air bronchograms at the cephalad margin of confluent abnormality. |
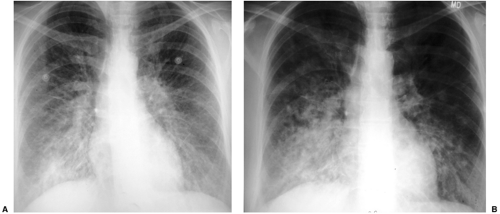 Figure 14.4 Misleading assessment of disease chronicity via old films. A. Posteroanterior chest radiograph 12-12: widespread parenchymal abnormality with confluent airspace disease in the right lower lung. B. Posteroanterior chest radiograph 1-18, 37 days after A: even more airspace disease, seemingly chronic. Clinically, disease had resolved between A and B, and each episode was thought to represent an acute drug reaction to administered antibiotics. After cessation of antibiotic therapy, the chest radiograph was normal on 1-20. |
It used to be that pneumonia was relatively focal most of the time, and edema was usually diffuse. In the era of acquired immunodeficiency syndrome (Chapter 6), pneumonia can also be diffuse. Edema is often a result of congestive heart failure, which may produce associated cardiomegaly, but there are a number of causes of noncardiogenic edema (Table 10.11) (Fig. 14.5). Furthermore, edema may have unusual distributions (Table 10.12); it may be unilateral (Fig. 14.6) in the upper lobes (with pulmonary hypertension caused by chronic pulmonary emboli) or irregularly irregular (especially in chronic obstructive pulmonary disease). The bottom line is I make my best guess, but I leave it to the clinician caring for the patient to apply my radiographic input to the rest of the available clinical data and thereby to come up with the best diagnosis.
As for chronic alveolar disease, allow me to introduce you to the first of my mnemonics, as listed in Table 14.3. A few words about using mnemonics are in order. I do not want someone to regurgitate such a list at me, demonstrating a complete inability to think and
to synthesize information. I want this to be a safety net that allows you to remember the key entities to consider with a given pattern. As you run down the checklist mentally, you should be considering the applicability of each diagnosis to the patient and the pattern at hand. Is the patient a 70-year-old woman? Alveolar proteinosis is generally seen in men from ages 20 to 50, but sarcoidosis is sufficiently widely distributed in the population that almost any age and either gender is perfectly compatible. Is the disease predominantly basilar? That is good for lipoid pneumonia (Fig. 14.7) and desquamative interstitial pneumonitis (DIP), whereas tuberculosis (TB) and fungus are often in the upper lobes, especially with reactivation of previously dormant disease. Are there associated lymph nodes or pleural effusions? If so, lymphoma is a good diagnosis; if not, bronchoalveolar cell carcinoma is a much better bet.
to synthesize information. I want this to be a safety net that allows you to remember the key entities to consider with a given pattern. As you run down the checklist mentally, you should be considering the applicability of each diagnosis to the patient and the pattern at hand. Is the patient a 70-year-old woman? Alveolar proteinosis is generally seen in men from ages 20 to 50, but sarcoidosis is sufficiently widely distributed in the population that almost any age and either gender is perfectly compatible. Is the disease predominantly basilar? That is good for lipoid pneumonia (Fig. 14.7) and desquamative interstitial pneumonitis (DIP), whereas tuberculosis (TB) and fungus are often in the upper lobes, especially with reactivation of previously dormant disease. Are there associated lymph nodes or pleural effusions? If so, lymphoma is a good diagnosis; if not, bronchoalveolar cell carcinoma is a much better bet.
Table 14.2: Differential Diagnosis of Acute Alveolar Disease (“Blood, Pus, Water, Cells, Protein”) | |
|---|---|
|
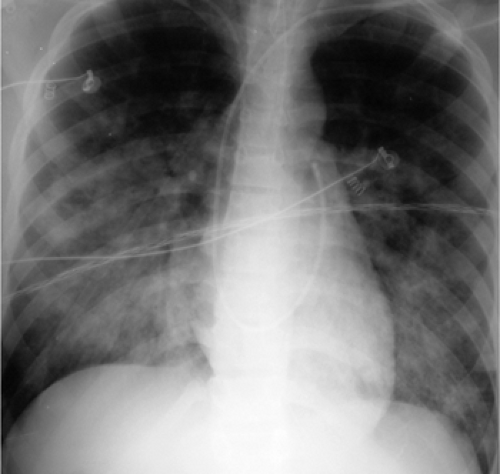 Figure 14.5 Neurogenic pulmonary edema. The patient was found unconscious. |
A few more words about mnemonics come to mind. DIP is pretty uncommon; it is really there because “Dallas” is better known than “Allas.” When I have visited other programs
I have been told about other mnemonics (as a way to include eosinophilic pneumonia, for instance; I will have more to say about that diagnosis later in this chapter). The best mnemonic is the one you can remember. If you want to include more diagnoses on your checklist, suit yourself. My goal is to include the most common diagnoses, the ones I really do not want to forget. If the answer is not on my list of common entities, I can always consult Gamuts in Radiology (1) for more ideas. A variant mnemonic was “STAPLE” for chronic alveolar disease, which some of our residents in the 1980s learned at the Armed Forces Institute of Pathology (sarcoid, TB/fungus, alveolar cell carcinoma, proteinosis, lymphoma, eosinophilic pneumonia, I believe). To the “TB, fungus, Dallas” mnemonic, one of our residents added “Wins Big” for Wegener granulomatosis and bronchiolitis obliterans organizing pneumonia (more correctly now known as cryptogenic organizing pneumonia [COP]).
I have been told about other mnemonics (as a way to include eosinophilic pneumonia, for instance; I will have more to say about that diagnosis later in this chapter). The best mnemonic is the one you can remember. If you want to include more diagnoses on your checklist, suit yourself. My goal is to include the most common diagnoses, the ones I really do not want to forget. If the answer is not on my list of common entities, I can always consult Gamuts in Radiology (1) for more ideas. A variant mnemonic was “STAPLE” for chronic alveolar disease, which some of our residents in the 1980s learned at the Armed Forces Institute of Pathology (sarcoid, TB/fungus, alveolar cell carcinoma, proteinosis, lymphoma, eosinophilic pneumonia, I believe). To the “TB, fungus, Dallas” mnemonic, one of our residents added “Wins Big” for Wegener granulomatosis and bronchiolitis obliterans organizing pneumonia (more correctly now known as cryptogenic organizing pneumonia [COP]).
Mnemonics are only helpful if you can remember them.
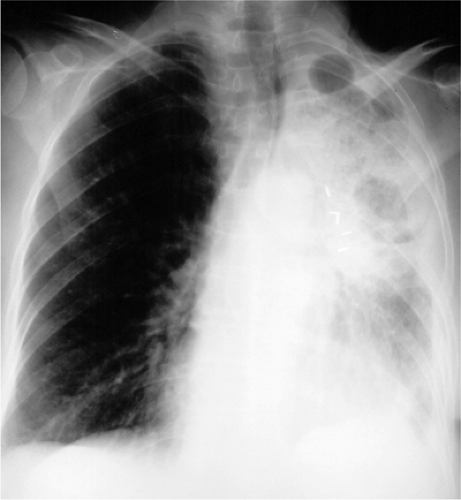 Figure 14.6 Postoperative pulmonary vein thrombosis causing unilateral left pulmonary edema. |
Table 14.3: Mnemonic for the Differential Diagnosis of Chronic Alveolar Disease (“TB, Fungus, Dallas”) | ||
|---|---|---|
|
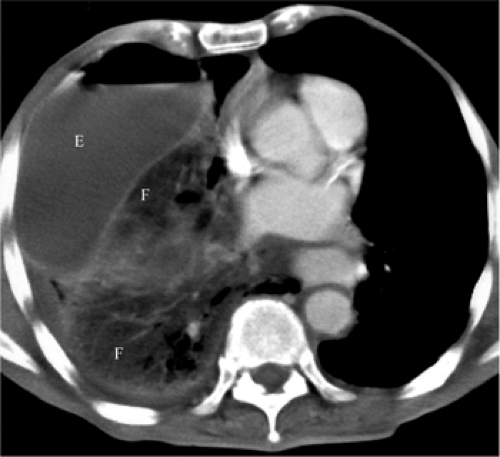 Figure 14.7 Lipoid pneumonia, particularly involving right lower lung. Computed tomography demonstrates fat attenuation filling the alveoli (F). There is an associated M. fortuitum empyema (E). |
Miliary Nodules
Turning to the patterns generally thought of as “interstitial,” we start with miliary nodules. They are small nodules (under 5 mm in size) that are very uniform in size and sharply defined. Even when they are extremely numerous they do not tend to become confluent. As I often tell residents, the result is the sense that with a pair of tweezers and a lot of patience, you could pick nodules off the radiograph for hours on end. The mnemonic for miliary lung disease is listed in Table 14.4.
Most tumors that metastasize to the lungs do so a little at a time—one metastasis in January, three in February, two in April, five in May—so that the radiographic picture is nodules varying in size. At the time of detection it would be unusual to have a large number of lesions all under 5 mm in size. The exception would be a very vascular primary neoplasm that could release a shower of metastases all at once. Miliary metastases are mainly seen with thyroid carcinomas; renal cell carcinoma is the next most common source (Fig. 14.8). However, I like to teach that in a given patient, the most likely primary neoplasm to produce a given finding is that patient’s neoplasm. Miliary nodules in a patient with duodenal leiomyosarcoma could indicate opportunistic infection, but if they prove to be malignant, they will probably be metastatic duodenal leiomyosarcoma (Fig. 14.9).
Table 14.4: Mnemonic for the Differential Diagnosis of Miliary Lung Disease (“TB, Fungus, SHRIMP”) | ||
|---|---|---|
|
Miliary nodules are most commonly due to infection or metastases.
Usual interstitial pneumonitis (UIP) is on the list not because it tends to cause miliary nodules, but because with diffuse lung disease it is sometimes difficult to decide if the abnormality is the opaque areas (miliary nodules) or the lucent zones in between (honeycombing, see below). On HRCT, which provides better anatomic resolution, UIP is definitely not miliary. Small miliary nodules may also be seen in secondary hemosiderosis due to longstanding mitral valvular disease.
Calcified miliary nodules are a special category. They usually result from histoplasmosis or chickenpox pneumonia. Less commonly, they are seen with silicosis and hemosiderosis. At the far end of the spectrum is alveolar microlithiasis (Fig. 14.10), where tiny calcifications become so numerous they may simulate very opaque alveolar disease; microlithiasis occurs in families, although the inheritance pattern is difficult to discern. Affected patients are often surprisingly asymptomatic.
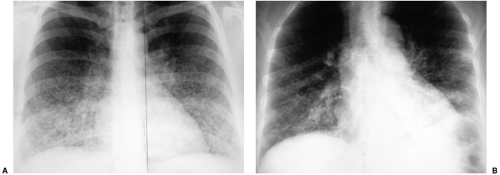 Figure 14.8 Miliary metastases. A. Thyroid carcinoma. B. Renal cell carcinoma. |
Honeycombing
This is a pattern of clustered cystic spaces, ranging from 1 to 10 mm in size. Honeycombing tends to occur at the periphery of the lungs, although that may not be easy to appreciate with the CXR. It should also be noted that diseases that do not result in honeycombing at HRCT may nevertheless have a CXR appearance that looks like honeycombing (e.g., lymphangiomyomatosis, with cysts rather than honeycombing at HRCT). The mnemonic for honeycombing is given in Table 14.5. In deference to me, some of our former residents used to make this HIPS ARDS, adding amyloidosis (I was previously obsessed with that disease); because it almost never causes honeycombing, and I am no longer obsessed with amyloidosis, I do not prefer that version.
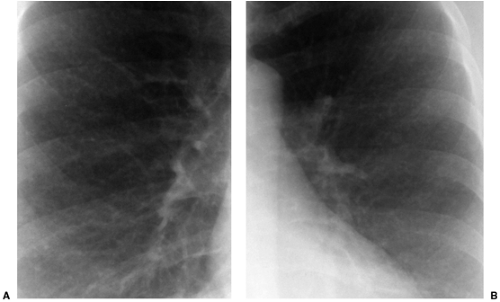 Figure 14.9 Unusual miliary metastases. Close-ups of (A) right and (B) left lungs demonstrate fine miliary nodules in a patient with duodenal leiomyosarcoma, subsequently proven to be metastases. |
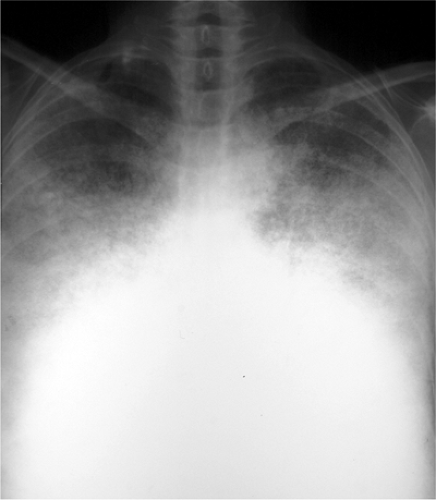 Figure 14.10 Alveolar microlithiasis. Innumerable extremely opaque nodules, resulting in markedly increased opacity of the lungs. (Courtesy of Dr. Michael Streiter, Huntington, NY.) |
As previously mentioned, differential diagnosis requires more than a simple recollection of the applicable mnemonic. Disease distribution can be a very helpful piece of ancillary information. A quick glance at a lateral radiograph will convince you that the lungs are somewhat triangular; they are much larger at the bases than at the apices. As a result, disease that is truly uniformly distributed from apices to bases will look somewhat worse at the bases on the CXR. However, some diseases are virtually limited to the lung bases, whereas others will more prominently affect the upper lungs. Examples of upper lung diseases are listed in Table 14.6 and include TB, fungus, sarcoid, ankylosing spondylitis, primary adenocarcinoma of lung, typical emphysema, respiratory bronchiolitis (RB), eosinophilic granuloma (the last four associated with cigarette smoking), and silicosis (and most other inhalational diseases). Lower lung diseases are listed in Table 14.7 and include anything related to blood flow (such as metastases, pulmonary emboli, and most miliary nodules), collagen vascular diseases other than ankylosing spondylitis (RDS in the listed mnemonic), aspiration and lipoid pneumonia, asbestosis, UIP, and emphysema secondary to α1-antitrypsin deficiency. Please note that this list includes a number of conditions that do not cause honeycombing. Still, honeycombing with upper lung predominance usually boils down to Langerhans cell histiocytosis (a.k.a. eosinophilic granuloma), sarcoidosis, or silicosis (Fig. 14.11); honeycombing with lower lung predominance is often collagen vascular disease, UIP, or asbestosis (Fig. 14.12).
Table 14.5: Mnemonic for the Differential Diagnosis of Honeycombing (“HIPS RDS”) | |
|---|---|
|
In my experience most drug-induced lung disease is diffuse or at least not lower lung predominant, although amiodarone-induced lung toxicity tends to be basilar. This sometimes allows me to sort out the disease (such as rheumatoid arthritis) from the effect of its treatment (sometimes treated with methotrexate, which can also result in honeycomb lung). Among the collagen vascular diseases, scleroderma in particular is sometimes limited to the extreme lung bases (Fig. 14.13).
Table 14.6: Upper Lung Predominant Diseases | |
|---|---|
|
Gender can also be helpful in sorting among differential diagnostic possibilities. Langerhans cell histiocytosis (a.k.a. eosinophilic granuloma) used to have a significant male predilection (9:1); because it is a cigarette-smoking related disease, it no longer has a pronounced gender preference, likely due to the profound increase in women smoking over the last few decades. Sarcoid has something of a female predominance, but it is so ubiquitous that this turns out not to be helpful in differential diagnosis (many males are also affected). Diseases with continuing significant male predominance include rheumatoid lung (even though rheumatoid arthritis itself has a strong female predominance), ankylosing spondylitis, alveolar proteinosis, silicosis, and asbestosis. Female gender is more typical of lymphangiomyomatosis, dermatomyositis, and scleroderma.
Table 14.7: Lower Lung Predominant Diseases | |
|---|---|
|
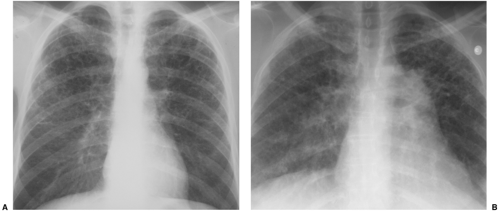 Figure 14.11 Upper lobe honeycombing. A. Eosinophilic granuloma. B. Sarcoid. |
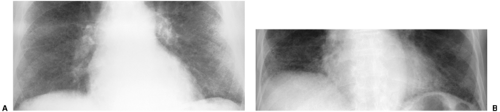 Figure 14.12 Lower lobe honeycombing. A. Rheumatoid lung. B. Usual interstitial pneumonitis. |
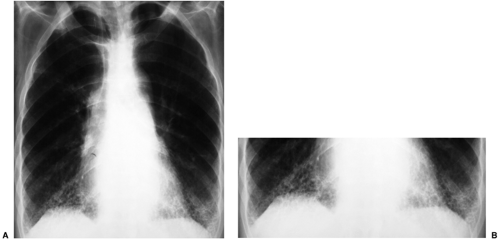 Figure 14.13 Extreme basilar distribution of honeycombing in scleroderma. A. Posteroanterior chest radiograph and (B) close-up of lung bases. |
Small Irregular Opacities
This pattern is also referred to as reticulonodular. It describes a complex combination of lines, dots, and spaces and is something of a wastebasket term for thousands of entities that involve the interstitium of the lungs. Although any “interstitial” disease can manifest this way, I particularly try to remember four common entities, as listed in Table 14.8: lymphangitic metastases (Fig. 14.14), sarcoidosis, collagen vascular disease, and pneumoconiosis. It is worth remembering that from a pattern recognition standpoint, this is a less helpful descriptor than miliary or honeycombing.
Table 14.8: Differential Diagnosis of Small Irregular Opacities (a.k.a. Reticulonodular Pattern) | |
|---|---|
|
Bronchial Abnormality
This is a pattern of abnormality of the bronchi, characterized by bronchial enlargement or bronchial wall thickening as manifestations of bronchiectasis, discussed in greater detail in Chapter 15. Bronchial abnormality can be mistaken for honeycombing because enlarged bronchi may result in apparent cystic spaces. However, such bronchi may contain fluid, and they tend not to cluster to quite the same extent as do that honeycomb cysts. Furthermore, careful review of frontal and lateral radiographs will generally demonstrate that abnormal bronchi have a different appearance depending on whether they are viewed in short axis (where they often resemble cystic spaces) or long axis (where their appearance often simulates railroad or tram tracks). As treatment for cystic fibrosis improves and patients survive further and further into adulthood, cystic fibrosis is a more and more common cause of bronchial abnormality (Fig. 14.15).
Bronchiectasis may instead be postinflammatory or congenital (Kartagener syndrome). Bronchial wall thickening is also sometimes seen in asthma and chronic bronchitis.
Bronchiectasis may instead be postinflammatory or congenital (Kartagener syndrome). Bronchial wall thickening is also sometimes seen in asthma and chronic bronchitis.
Bronchiectasis can mimic honeycombing on chest radiographs.
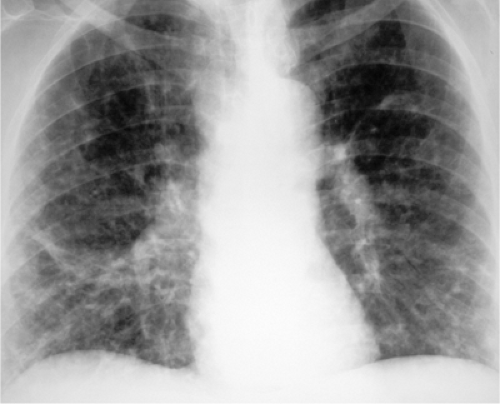 Figure 14.14 Small irregular opacities in lymphangitic spread of uterine sarcoma. Posteroanterior chest radiograph reveals lines, dots, and circles. |
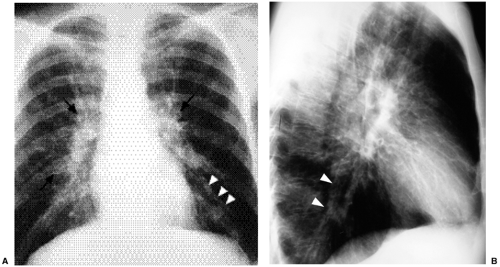 Figure 14.15 Bronchial pattern of cystic fibrosis. (A) Posteroanterior chest radiograph and (B) lateral chest radiograph demonstrate thick-walled bronchi (arrows) and tram tracks (arrowheads). |
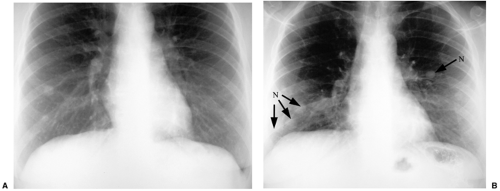 Figure 14.16 Unusual cause of multiple nodules. A. Posteroanterior chest radiograph at initial presentation: several lung nodules are best visualized in the right lower lung. B. Posteroanterior chest radiograph 31 months after A: growing bilateral nodules (N), although growth rate is less than typically seen with lung metastases. Biopsy revealed benign metastasizing leiomyomatosis (pulmonary fibroleiomyomatous hamartomas). |
Multiple Nodules and Cavitary Nodules
This is a pattern characterized by nodules of varying size. Unlike alveolar nodules, the nodules considered here are sharply outlined. Unlike miliary nodules, they are not uniform in size and they often range well above the 5 mm limit for miliary nodules. The important entities in the differential diagnosis are metastases, metastases, metastases, metastases, and granulomas. This reinforces the fact that metastatic disease is numerically the most common cause and also the most important cause (based on effect on patient outcome) to remember. There are numerous other causes, including Wegener granulomatosis, hamartomas, and arteriovenous malformations; if you have a special interest in the less common causes, this is a good time to go to the Gamut book (Fig. 14.16). Cavitary nodules have a separate mnemonic, as listed in Table 14.9. This mnemonic can be used for a single cavity or for multiple cavities.
In the context of multiple cavities, cancer usually means squamous cell carcinoma metastases. Sarcoma metastases actually have a greater tendency to cavitate, but they are less common (Fig. 14.17). Apart from Wegener granulomatosis, rheumatoid nodules may also cavitate. Vascular reminds us that both bland and septic emboli may cavitate. Infection refers to bacterial lung abscesses and to infections like TB and fungus with a predilection for cavitation. A variety of traumatic lesions presents with cavitations (including laceration,
contusion, and pneumatocele). Although congenital abnormalities that cavitate (such as bronchogenic cyst and sequestration) are usually single lesions, they may on occasion be multiple (Box 14.1).
contusion, and pneumatocele). Although congenital abnormalities that cavitate (such as bronchogenic cyst and sequestration) are usually single lesions, they may on occasion be multiple (Box 14.1).
Table 14.9: Mnemonic for the Differential Diagnosis of Cavitary Lung Nodules (“CAVITY”) | |
|---|---|
|
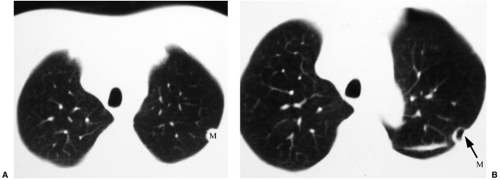 Figure 14.17 Cavitary metastatic osteosarcoma. A. Computed tomography december 3rd: peripheral left upper lobe metastasis (M). B. Computed tomography 8 weeks after A: lesion has cavitated in the interval. |
Box 14.1: Summary of Mnemonics
Chronic alveolar disease—TB, fungus, DALLAS
Miliary nodules—TB, fungus, SHRIMP
Honeycombing—HIPS RDS
Cavitary nodule(s)—CAVITY
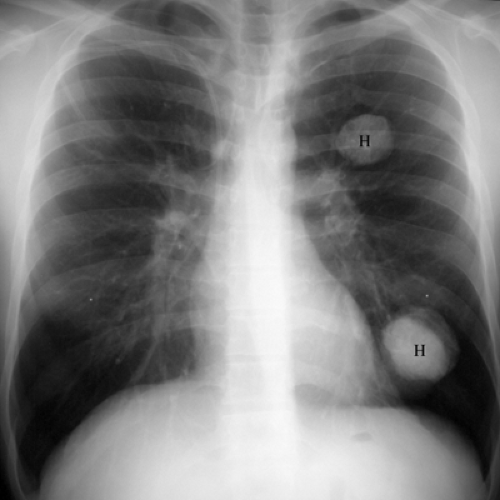 Figure 14.18 Calcified lung nodules (H). This patient also had gastric leiomyosarcoma; together with these calcified hamartomas, this constitutes 2/3 of Carney triad (the other element in the triad is extraadrenal pheochromocytoma, or paraganglioma). |
Calcified nodules usually indicate benign disease. Several such nodules are often seen in old TB or histoplasmosis. Hamartomas also calcify and are sometimes multiple, as in Carney triad (Fig. 14.18). However, metastases may also calcify. This is particularly likely after chemotherapy has been administered. De novo calcification (or ossification) of metastases is usually a manifestation of sarcomas, especially osteosarcoma (Fig. 14.19). Calcification of lesser magnitude is occasionally seen in adenocarcinoma metastases from the breast or gastrointestinal tract (Fig. 14.20).
Pointers in Pattern Recognition
It takes practice to become proficient at recognizing these patterns and generating differential diagnoses. Personal experience indicates that it is worthwhile to make the effort. Your ability to make diagnoses using pattern recognition will rapidly outstrip that of clinicians, who generally rely on the history and physical examination as guides to the interpretation of the chest radiograph. In practical terms, it is important to know that it is generally easier to recognize a pattern in areas of moderate profusion than in areas of extreme profusion. What I am saying is that although alveolar disease is the pattern that is particularly likely to demonstrate areas of confluent disease, any pattern becomes harder to recognize if you pile on too much of it.
When lung abnormality is extensive, look at the areas least involved to help identify the pattern of abnormality.
It will assist you enormously to acknowledge one more pattern: “I don’t know.” Some patients have disease that is not easily sorted into one of the above patterns of abnormality (sometimes the problem is with the pattern, sometimes it is with you as the interpreter of the pattern). In any event, pretending that you know what the pattern is will lead to erroneous differential diagnoses and loss of confidence in the system, both on your part and on the part of your referring clinicians.
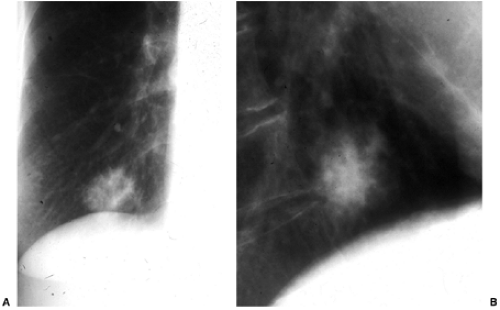 Figure 14.19 Grossly calcified metastasis. Obvious calcification is seen in this metastatic osteosarcoma, especially on the lateral view. |
How should you handle a radiograph that demonstrates two (or more) patterns of abnormality (Box 14.2)? There are different answers to that question that apply to different circumstances. If possible, you should try to examine their lists of differential diagnosis for points of overlap (Fig. 14.21). This may result in a very short list of diagnostic possibilities. If one pattern is far more widespread, it is probably better to go with the predominant pattern. If you recognize one pattern and not the other, you should go with the pattern you recognize. If you know a mnemonic (or at least the differential diagnosis) for one and not the other, you should obviously go with the pattern whose differential diagnosis you know. If one pattern has a reasonably focused differential diagnosis and the other is small irregular opacities, go with the pattern with a better differential diagnosis.
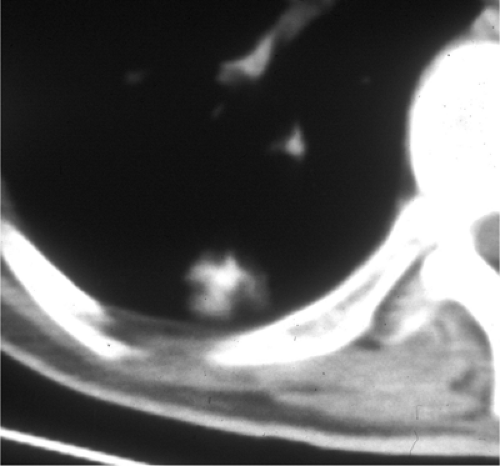 Figure 14.20 Computed tomography demonstration of calcification in metastatic colon carcinoma. |
I generally approach a radiograph demonstrating two patterns as an example of Osler’s Rule (I have also heard this called Occam’s Razor): “No matter how you pinch and squeeze, it’s got to fit just one disease.” It is also worthwhile to remember Hictum’s Dictum: “A patient can have as many diseases as he damn well pleases” (Fig. 14.22).
Although this kind of organized analysis will usually work best, there are two other approaches to CXR diagnosis that are sometimes helpful. The first is the “Aunt Minnie” approach. If you happen to have an Aunt Minnie, when she walks in the room you are unlikely to think to yourself, “This is a 65-year-old woman who is 30 pounds overweight, walks with a limp, and wears outrageous color combinations—it is probably my Aunt Minnie.” Instead, her overall presentation is sufficiently unique that you get an immediate gestalt impression of her as Aunt Minnie. Similarly, some radiographic presentations are uniquely characteristic of diagnostic entities, and these are labeled as “Aunt Minnies” (Figs. 14.23 and 14.24).
Box 14.2: How to Deal with Two Different Patterns
Cross-check the differential diagnoses
Go with the predominant pattern
Go with the pattern you recognize
Go with the pattern whose differential you know
Go with the more specific pattern
Remember Hictum’s dictum
A second approach is to take into account the patient’s clinical presentation and to look for typical radiographic manifestations (Box 14.3). In a patient with severe inherited anemia, this approach makes extramedullary hematopoiesis an important diagnostic consideration for any posterior mediastinal mass. In a patient with prior left upper quadrant abdominal trauma, this makes splenosis a consideration for any left pleural mass(es). Another illustrative example is shown in Fig. 14.25.
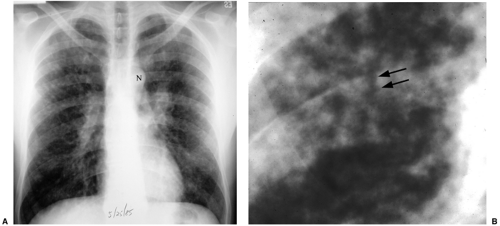 Figure 14.21 Cross-checking multiple patterns. A. Posteroanterior chest radiograph May 25th: widespread lung nodules and left hilar lymph node enlargement (N). B. Close-up of right perihilar lung two days later: progression of nodules, now with confluence and air bronchograms (arrows). Histoplasmosis is a diagnosis in the differential for nodules, airspace disease, and thoracic lymph node enlargement (and the correct diagnosis). |
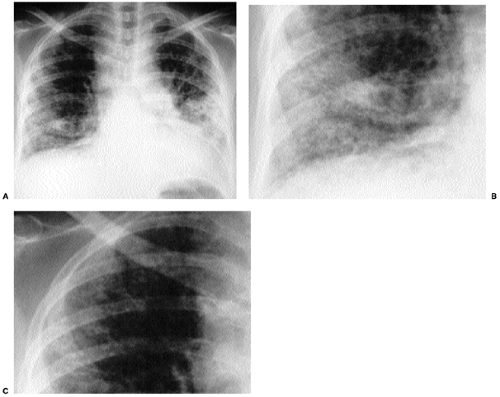 Figure 14.22 Multiple patterns, multiple diseases. A. Posteroanterior chest radiograph: extensive parenchymal abnormality. B. Close-up of right lung base: honeycombing. C. Close-up of right lung apex: miliary nodules. Patient was known to have rheumatoid lung, accounting for honeycombing, but autopsy revealed miliary tuberculosis resulting from chronic steroid therapy for rheumatoid disease, with reactivation of old tuberculosis. |
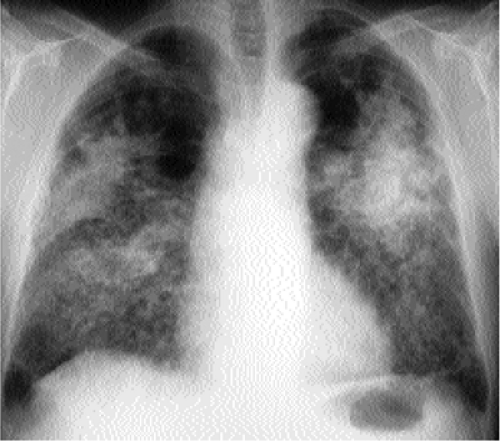 Figure 14.23 Silicosis. Typical appearance of progressive massive fibrosis with upper lobe conglomerate masses. Underlying lungs demonstrate small nodules, and there is emphysematous destruction of upper peripheral lungs adjacent to conglomerate masses. |
The CXR has a number of positive features for assessment of diffuse lung disease. It is widely available and inexpensive. Resultant patient radiation doses are very low. Perhaps most importantly, we (collectively) have an enormous backlog of experience using this tool in this situation. That is how we know that although TB is a common cause of miliary nodules, we do not see calcified miliary nodules after TB.
On the other hand, CXR has disadvantages in the assessment of diffuse lung disease. It is neither sensitive nor specific. Real abnormalities may be missed, and in many patients
a final diagnosis cannot be established. Disease is not always well localized on the CXR, limiting our ability to guide endoscopists to the best locations for transbronchial lung biopsy in specific patients. Disease activity is also not generally something we can assess. It is thus hard to predict which patients with interstitial lung disease (ILD) will respond to steroids. Although that seems like a trivial distinction, the numerous complications associated with steroid therapy should persuade you otherwise. Finally, associated findings in the mediastinum, axillae, bones, and upper abdomen that might help to explain the etiology of lung disease are generally not well visualized.
a final diagnosis cannot be established. Disease is not always well localized on the CXR, limiting our ability to guide endoscopists to the best locations for transbronchial lung biopsy in specific patients. Disease activity is also not generally something we can assess. It is thus hard to predict which patients with interstitial lung disease (ILD) will respond to steroids. Although that seems like a trivial distinction, the numerous complications associated with steroid therapy should persuade you otherwise. Finally, associated findings in the mediastinum, axillae, bones, and upper abdomen that might help to explain the etiology of lung disease are generally not well visualized.
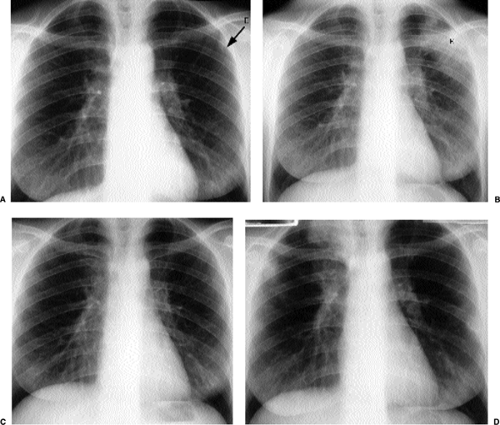 Figure 14.24 Eosinophilic pneumonia. Asthmatic with recurrent episodes of dyspnea. A. Posteroanterior chest radiograph, April 1st: subtle abnormality at periphery of left upper lung (E). B. Posteroanterior chest radiograph fifteen days later: left upper lung abnormality has blossomed. Peripheral airspace disease, especially in the upper lungs of atopic patients, is typical. C. Posteroanterior chest radiograph 5-21: complete resolution of abnormality. D. Posteroanterior chest radiograph 9-2: recurrence at periphery of both upper lungs (E), also a typical feature if steroid therapy is discontinued. |
Box 14.3: Other Tools in the Pattern-Gamut Approach
Gamuts in radiology*
“Aunt Minnies”
Expected abnormalities given the clinical diagnosis
Footnote
*Reader and Felson’s Gamuts in radiology: Comprehensive lists of roentegen differential diagnosis, 3rd ed. New York, Springer-Verlag, 1993.
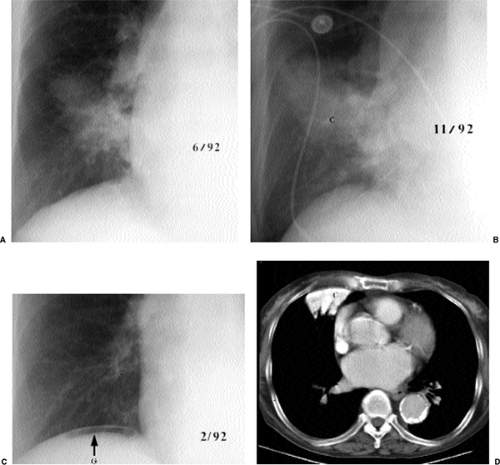 Figure 14.25 Unknown from the Chest Club of Southeastern Michigan. A. Chest radiograph 6-92: patchy right perihilar opacity. B. Chest radiograph 11-92: more obvious chronic middle lobe airspace disease (C). C. Chest radiograph 2-92: before there was middle lobe disease there was free intraperitoneal gas (G). Because of the possibility of peritoneal dialysis, metastatic calcification of lung was added to the chronic alveolar differential diagnosis for this patient. D. Computed tomography: high-attenuation middle lobe abnormality (C) confirms metastatic calcification of lung. (Courtesy of Dr. David Spizarny, Detroit, MI) |
High Resolution Computed Tomography Approach to Interstitial Lung Diseases
Technique
HRCT is a sampling tool for evaluating the lung parenchyma, during which images are obtained at thin collimation, typically 1 or 1.5 mm (2). HRCT differs from most thoracic CT examinations in two ways. First, during most thoracic CT examinations the entire thoracic volume is captured during the CT acquisition, such as when looking for lung metastases. In contrast, HRCT images are obtained at intervals spaced throughout the lungs. Techniques range from an image every 1 cm to clusters of images at predefined anatomic levels, such as the aortic arch, the carina, and just above the diaphragm. Second, HRCT images are reconstructed using a high spatial frequency reconstruction algorithm that enhances edges, thereby emphasizing the borders of fine lines and nodules, similar (if not identical to) a bone algorithm. In contrast, most thoracic CT examinations use an algorithm for reconstruction that creates a smoother image that is more pleasing to the eye. HRCT images are inherently noisy and suffer from quantum mottle; this usually has little effect on the images reviewed on lung window settings. However, this noise is readily apparent when reviewing on soft tissue window settings. Most HRCT examinations are
performed at inspiration. Images are often obtained at expiration to evaluate for air trapping that indicates small airway disease. Prone images are useful to exclude lung disease in areas of dependent opacity that is commonly seen in the subpleural posterior portion of the lower lobes, created by atelectasis. This finding is more common with increasing age and in current or former smokers than nonsmokers (3).
performed at inspiration. Images are often obtained at expiration to evaluate for air trapping that indicates small airway disease. Prone images are useful to exclude lung disease in areas of dependent opacity that is commonly seen in the subpleural posterior portion of the lower lobes, created by atelectasis. This finding is more common with increasing age and in current or former smokers than nonsmokers (3).
HRCT differs from conventional CT in that it samples the lung for pattern and distribution of abnormality.
Prone images are useful to distinguish subpleural basilar lung disease from dependent atelectasis.
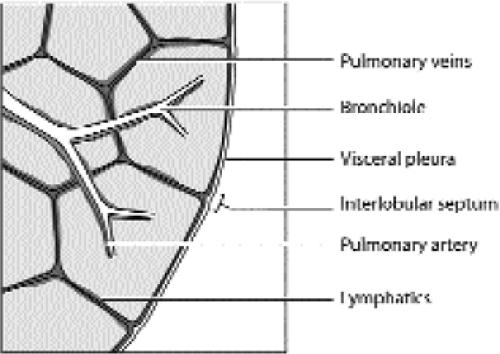 Figure 14.26 Line drawing of a secondary pulmonary lobule. The borders of the lobule are the interlobular septa. At the center of each lobule is a bronchiole and a pulmonary artery branch (blue). The pulmonary vein branches (red) run in the interlobular septa. The lymphatics (green) are found in the interlobular septa and within the central or axial interstitium that surrounds the bronchovascular bundles. (From
Get Clinical Tree app for offline access
Kazerooni EA. High-resolution CT tomography of the lungs. AJR Am J Roentgenol 2001;177:501–519
Stay updated, free articles. Join our Telegram channel
Full access? Get Clinical Tree


|