Coronary Arteries
Warren J. Manning
Christoph R. Becker
Neil M. Rofsky
Introduction
Spectrum and Prevalence of Disease
Despite decades of progress in identification of clinical risk factors, prevention, and early diagnosis, coronary artery disease (CAD) (1) remains the leading cause of mortality for men and women in the United States (2) and throughout the Western world. Overall, CAD results in 700,000 infarctions annually and is responsible for one of every five deaths in the United States (2).
Global View of Unique Aspects and Considerations of Imaging of Coronary Arteries
The small caliber, tortuosity, and rapid motion of the coronary arteries during both the respiratory and cardiac cycle make imaging of the coronary lumen particularly challenging for invasive and noninvasive modalities. Moreover, it is increasingly recognized that conventional x-ray “luminographic” imaging significantly underestimates the true burden of atherosclerotic CAD. The atherosclerotic process is initiated by endothelial injury with local inflammation leading to a focal plaque. In the mid-1980s, Glagov et al. (3) demonstrated that initially, as the plaque expands, the coronary lumen is relatively maintained, but after some period, further plaque enlargement leads to lumen encroachment and development of clinical disease. The definition of coronary artery disease is classically taken to include a 50% or greater diameter narrowing of a major coronary artery or branch. This narrowing may correspond to a 75% lumen cross-sectional area loss. A “significant”
stenosis that may warrant a mechanical intervention/revascularization is present if the diameter stenosis exceeds 70% (∼90% cross-sectional area loss). Improved longevity is generally recognized for patients with left main (LM) or multivessel CAD undergoing coronary artery bypass graft (CABG) surgery.
stenosis that may warrant a mechanical intervention/revascularization is present if the diameter stenosis exceeds 70% (∼90% cross-sectional area loss). Improved longevity is generally recognized for patients with left main (LM) or multivessel CAD undergoing coronary artery bypass graft (CABG) surgery.
What Does Computed Tomography and Magnetic Resonance Imaging Bring over Other Imaging and Nonimaging Diagnostic Testing?
For over 40 years, invasive x-ray coronary angiography has been the clinical “gold standard” for the diagnosis of CAD, with almost 1.5 million diagnostic x-ray coronary angiograms performed annually in the United States (2) and nearly a million percutaneous interventions and CABG surgeries. Even higher volumes of diagnostic catheterizations and interventions are performed in Europe and Japan. However, x-ray angiography is a projection technique in which the coronary lumen is viewed from multiple imaging planes.
While numerous noninvasive tests are available to help discriminate among those with and without significant luminographic disease, clinical studies continue to demonstrate that 25% to 40% of patients referred for elective x-ray coronary angiography are found to have no significant stenoses (4,5). Despite the absence of disease, these patients remain subjected to the cost, inconvenience, and potential morbidity of invasive x-ray angiography (6,7). In addition, data suggest that in selected high-risk populations such as patients with aortic valve stenosis, the incidence of subclinical stroke associated with diagnostic cardiac catheterization may exceed 20% (8).
Since surgical revascularization of LM and multivessel proximal coronary disease has the greatest impact on patient mortality and >90% of coronary segments undergoing intervention fall within the proximal/middle segments (9,10), it would be desirable to have a noninvasive method to directly visualize the proximal/midnative coronary vessels for the accurate identification/exclusion of LM/multivessel CAD. In addition, technologies that would permit assessment of subclinical disease of the great vessels and coronary arteries would be desirable so that more intensive therapies could be considered to possibly prevent or delay progression to clinical disease.
The electrocardiogram (ECG) is helpful in diagnosing acute myocardial infarction among patients presenting with chest pain and of inducible ischemia during stress testing, but its findings are less specific to a coronary artery territory. More commonly, the ECG is combined with physiologic stress (treadmill or bicycle ergometry) to identify patients with inducible ischemia, but with only modest accuracy for identifying patients with CAD. Transthoracic echocardiography is helpful for visualizing the ostia of the native coronary arteries in children and adolescents (11), but identification of focal disease has been limited to transesophageal echocardiography—and then only for the LM coronary artery (12).
Over the last decade, coronary magnetic resonance imaging (MRI) and, more recently, multidector computed tomography (MDCT) and coronary computed tomographic angiography (CTA) have evolved as potential replacements for diagnostic x-ray angiography among patients with suspected anomalous CAD and coronary artery aneurysms, and have now reached sufficient maturity such that they may obviate the need for invasive x-ray angiography when performed at experienced centers.
The rapid advancements in MDCT are yielding relatively uncomplicated and robust assessments of all forms of coronary vascular disease. At the time of this writing, MDCT is undergoing larger scale evaluations for atherosclerotic disease; the results of such studies should more clearly define its role.
Imaging Strategies
Computed Tomography
Electron Beam
Electron beam CT (EBCT), developed in the late 1980s, was the first CT scanner with exposure times short enough to image the coronary arteries without motion artifacts. In EBCT, electrons are accelerated by an electron gun in a vacuum funnel and are focused on tungsten target rings mounted underneath the patient table. By deceleration of these electrons in the target rings, x-rays are produced that penetrate through the patient. A stationary detector ring above the patient then detects these x-rays (13).
Because of the lack of any moving items, scan time in EBCT for imaging the coronary arteries can be as short as 100 ms. To avoid cardiac motion artifacts, scan acquisition is triggered by the ECG signal at the prospected mid-diastolic phase of the cardiac cycle, typically in between 40% and 80% of the R-R interval (14). The EBCT technique for imaging the coronary arteries is therefore called prospective ECG triggering.
As described elsewhere, coronary artery imaging was initially and is still performed by this modality without contrast media to assess coronary calcifications as a surrogate marker of atherosclerosis. Later, contrast-enhanced coronary EBCT showed promising results for also detecting coronary artery stenoses. Because the electron gun always operates at fixed parameters (130 kVp, 63 mAs, and 100 ms), EBCT images may suffer frequently from high image noise
and low-contrast resolution, particularly in obese patients. In addition, image acquisition with thinner than 3-mm slices does not allow coverage of the entire coronary artery tree within a single breath hold. Therefore, the spatial resolution is limited, and reliable assessment of the coronary arteries with EBCT is restricted to the proximal part of the coronary artery tree only.
and low-contrast resolution, particularly in obese patients. In addition, image acquisition with thinner than 3-mm slices does not allow coverage of the entire coronary artery tree within a single breath hold. Therefore, the spatial resolution is limited, and reliable assessment of the coronary arteries with EBCT is restricted to the proximal part of the coronary artery tree only.
Multidetector Row
In the past, conventional rotating gantry CT did not offer the required temporal resolution to allow for imaging of the coronary arteries. First, single-slice CT scanners with subsecond gantry rotation and prospectively ECG-triggered image acquisition were able to acquire images of the coronary arteries with no or minimal motion artifacts. With the introduction of MDCT, a new acquisition technique was introduced called retrospective ECG gating. This technique requires a fast gantry rotation, slow table movement, and multiple detector rows for acquiring a high number of x-ray–projection data from many different angulations and positions of the beating heart in a very short period of time. During the scan acquisition, the ECG signal is recorded simultaneously, and afterward, images are reconstructed retrospectively from the slow-motion diastole phase of the heart.
Retrospective ECG gating with MDCT has several advantages over prospective ECG triggering: (a) the scan time is shorter, (b) the entire volume is acquired continuously and gapless, (c) the image may be reconstructed with overlap, and (d) the optimal individual time point may be selected even after scanning has been completed.
The disadvantage of retrospective ECG gating is that patients are exposed during the systole and diastole, resulting in significantly higher radiation exposure compared with prospective ECG gating. The redundant radiation occurring during the radiation exposure in the systole can substantially be reduced by a technique called prospective ECG tube current modulation. On the basis of the ECG signal, the x-ray tube current is switched to its nominal value during the diastole phase and is reduced by 80% during the systole phase of the heart, respectively. This technique reduces the dose by 30% to 50%, depending on heart rate, but is most effective in patients with a low heart rate. For instance, in a patient with a heart rate of around 60 beats per minute (bpm), the radiation exposure will be reduced by approximately 50% (15). For comparison, patients are exposed to approximately 4 mSv by a typical diagnostic coronary catheter procedure (16).
During gantry rotation, x-ray projections of at least 180 degrees are necessary to create an image. The temporal resolution of the image in MDCT therefore depends on the gantry rotation speed. The fastest currently available gantry rotation in MDCT is 330 ms, resulting in a temporal resolution of 165 ms. Attempts have been made to further improve temporal resolution by the so-called multisector-reconstruction algorithm.
For this technique, it may be necessary to reduce the table speed to allow acquisition of x-ray projections from more than one heartbeat to reconstruct an image. The temporal resolution may be improved by up to two to four times compared with 180-degree scan reconstruction but varies with the heart rate. Successful image reconstruction requires absolute consistent data from two or more consecutive heartbeats for successful image reconstruction. However, the rhythm of the human heart may change rapidly, particularly under special conditions such as breath holding and Valsalva maneuver, and reducing the table feed may mean loss of spatial resolution and higher radiation exposure. For these reasons, this technique does not guarantee for consistently good image quality under general clinical conditions.
CT imaging protocols are dependent on the type of scanner. Suggested protocols across a wide variety of platforms can be found in Table 14-1, which includes recommendations for contrast administration and estimations of radiation dose.
Patient Preparation
Optimal scan results with MDCT as well as with EBCT may require some preparation of the patient. Since an image with EBCT is acquired with every heartbeat, acceleration of the heart rate with atropine may help to reduce the scan time and the amount of contrast media. In contrast, in MDCT, deceleration of the heart rate may help to reduce cardiac motion artifacts and to find the optimal image reconstruction interval (17). Prior to a cardiac MDCT examination, patients should avoid the uptake of caffeine or nitroglycerin. Instead, the use of beta-blocker may become necessary for patient preparation, aiming at a heart rate of 65 bpm or less.
To consider a beta-blocker for patient preparation, contraindications (bronchial asthma, atrioventricular [AV] block, severe congestive heart failure, aortic stenosis, etc.) have to be ruled out (18), and informed consent must be obtained from the patient. In a case where the heart rate of a patient is significantly above 60 bpm, 50 to 200 mg of metoprolol tartrate may be administered orally 30 to 90 minutes prior to the investigation. Alternatively, 5 to 20 mg of metoprolol tartrate divided in four doses may be administered intravenously (18) immediately prior to scanning. Monitoring of vital functions, including heart rate and blood pressure, is essential during this approach. Indeed, the positive effect of beta-blocker on cardiac MDCT scanning is fourfold: (a) the sedating effect of
beta-blocker results in a better patient compliance and less movement during scanning; (b) the patient is exposed to less radiation, because with lower heart rate, the ECG tube current modulation is working more effectively; (c) cardiac motion artifacts are substantially reduced; and (d) because of the lower cardiac output with a beta-blocker, the contrast enhancement will increase.
beta-blocker results in a better patient compliance and less movement during scanning; (b) the patient is exposed to less radiation, because with lower heart rate, the ECG tube current modulation is working more effectively; (c) cardiac motion artifacts are substantially reduced; and (d) because of the lower cardiac output with a beta-blocker, the contrast enhancement will increase.
Table 14.1 Coronary CTA Technical Factors | |||||||||||||||||||||||||||||||||||||||||||||||||||||||||||||||||||||||||||||||||
|---|---|---|---|---|---|---|---|---|---|---|---|---|---|---|---|---|---|---|---|---|---|---|---|---|---|---|---|---|---|---|---|---|---|---|---|---|---|---|---|---|---|---|---|---|---|---|---|---|---|---|---|---|---|---|---|---|---|---|---|---|---|---|---|---|---|---|---|---|---|---|---|---|---|---|---|---|---|---|---|---|---|
| |||||||||||||||||||||||||||||||||||||||||||||||||||||||||||||||||||||||||||||||||
Imaging of the coronary arteries and veins with CT requires the highest spatial resolution available. Planning the investigation of the heart from the scout view, the range to be scanned should include the tracheal bifurcation and the inner recess of the diaphragm corresponding to approximately 120 mm. With 4-detector-row CT and 1-mm slice collimation as well as with the EBCT at low heart rates, scanning the entire heart may last up to 40 seconds.
With EBCT prior to scanning the heart, the arrival time of a small contrast media test bolus in the ascending aorta needs to be determined by a series of test scans. With MDCT, the scan acquisition may be triggered automatically by the arrival of the main contrast bolus in the ascending aorta. When contrast injection starts, repeated scanning at the level of the ascending aorta is performed every second. If the enhancement in the ascending aorta reaches 100 Hounsfield units (HU), the MDCT scan acquisition starts with a short delay of 4 to 6 seconds.
Shortly prior to the CT scan acquisition, the patient is instructed to hold their breath. The patients should be instructed not to press down while taking a deep breath in to avoid the Valsalva maneuver, which increases the intra-abdominal pressure leading to an influx of nonenhanced blood from the inferior vena cava into the right atrium. This prevents the influx of blood mixed with contrast media from entering the right atrium. Dense contrast media persisting in the superior vena cava may lead to beam-hardening artifacts, and only inhomogeneous enhancement of the entire cardiac volume may occur.
Bypass Graft Imaging: Technical Considerations
Imaging arterial and venous bypass graft requires also the inclusion of the subclavian artery and the ascending aorta into the scan range. With a 4-detector-row CT scanner, this scan range may only be acquired with a 4 ÷ 2.5-mm collimation in a reasonable breath hold time. Scanning with EBCT requires abandoning overlapping slice acquisition to keep the breath-hold time below 40 seconds.
With EBCT, the time point for image acquisition is the end-systole interval corresponding to approximately 40% of the RR interval in the ECG (14). In retrospect, ECG with MDCT image reconstruction always begins with careful analysis of the ECG trace recorded with the helical scan. The reconstruction interval is best placed in between the T- and P-wave of the ECG corresponding to the mid-diastole interval. The point of time for the least coronary motion may be different for each coronary artery. Reduced motion artifacts may result when reconstructing the right coronary artery (RCA), left anterior descending (LAD) artery, and left circumflex (LCX) coronary artery at 50%, 55%, and 60% of the RR-interval, respectively (17). Individual adaptation of the point of time for reconstruction seems to further improve image quality. However, the lower the heart rate, the easier it is to find the single best interval for all three major branches of the coronary artery tree (19).
Contrast Methods
A timely, accurate, and homogenous vascular lumen enhancement is essential for full diagnostic capability of coronary MDCT angiography studies. Higher contrast enhancement is superior to identify small vessels in MDCT. However, dense contrast material in the right atrium cavity may cause streak artifacts arising from the right atrium that may interfere with the right coronary artery. In addition, high enhancement of the coronary arteries may interfere with coronary calcifications and may therefore hinder the delineation of the residual lumen.
A peripheral venous iodine flow rate of 1 gram per second will result in an enhancement of approximately 250 to 300 HU in the majority of patients (20) and still allows for delineation of coronary calcification. The final vessel enhancement will not only depend on the iodine flow rate but also on the cardiac output and body weight of the patient. In patients with low cardiac output, such as those under beta-blocker medication, the contrast media will accumulate in the cardiac chambers and lead to a higher enhancement than in patients with high cardiac output where the contrast agent will be diluted faster by nonenhanced blood (21). Because patients with higher body weight may have a larger blood volume, there is also an inverse relation between body weight and peak enhancement (22).
The use of dual-head injectors with sequential injection of contrast media and saline may be helpful to keep the contrast bolus compact (21), to reduce the total amount of contrast media (23,24), and to achieve a central venous enhancement profile by the peripheral venous injection (25). Reducing the amount and use of iso-osmolar contrast media may reduce the risk of contrast-induced nephropathy (26). In addition, changes in heart rate have less frequently been observed in cardiac catheterization during the injection of iso-osmolar contrast agent and may therefore be of advantage in CT as well (27). With scan times as short as 20 seconds, the sequential injection of contrast media and saline allows for selective
enhancement of the left ventricular cavity (CT levocardiogram), with wash out of dense contrast media in the right atrium helping to avoid artifacts.
enhancement of the left ventricular cavity (CT levocardiogram), with wash out of dense contrast media in the right atrium helping to avoid artifacts.
Postprocessing
The primary axial slices are well suited to detect coronary atherosclerosis. However, the detection of coronary artery stenoses in axial CT images may be problematic because every slice displays only a small part of the entire coronary artery, and the course cannot be well followed. The selection of the appropriate postprocessing tool depends on the purpose.
Two-dimensional (2D) postprocessing tools, such as multiplanar reformatting and maximum-intensity projection (MIP), and 3D postprocessing tools, such as volume rendering (VR), virtual coronary endoscopy, and shaded-surface display, have been tested for improving the detection of coronary artery stenosis in CTA images (28). Two-dimensional tools may be of advantage to assess coronary artery stenoses, but 3D tools have their strength in displaying the anatomy and anomalous course of the coronary arteries.
For the assessment of the LM, 3D tools require the segmentation and removal of the left atrium auricle (29) (Fig. 14-1). The newest postprocessing workstations allow for autosegmentation on the base of standard reference models and for angiography, like presentation of the coronary artery tree.
A number of artifacts, such as misalignment of slabs caused by trigger artifacts, may result in artificial coronary stenoses when 2D or 3D postprocessing is performed. New software capabilities allow for a resorting of the data to improve image quality in such circumstances (Fig. 14-2).
A lumen-narrowing scoring system according to Schmermund et al. (30) may be used to describe different grades of coronary artery stenosis in the proximal and middle coronary artery segment: A, angiographically normal segment (0% stenosis); B, nonobstructive disease (1% to 49% lumen diameter stenosis); C, significant (50% to 74% stenosis); D, high-grade (75% to 99% stenosis); E, total occlusion (100% stenosis). The patency of the distal coronary artery segments should also be reported. It is important to emphasize that any finding from postprocessed images has to be confirmed in the original axial CT slices in order to prepare an accurate report.
Magnetic Resonance
Equipment Considerations and Patient Preparation
The small diameter of the coronary arteries and their location within the thorax makes the use of a 1.5T MR system (or potentially greater field strength) and a dedicated thoracic or cardiac phased array receiver coil (with anterior and posterior elements) a requirement for coronary artery imaging. To suppress coronary artery motion during the cardiac cycle, ECG synchronization and QRS detection are absolute necessities (peripheral pulse gating is not an adequate alternative). Prominent T waves resulting from the magnetohydrodynamic effect of pulsatile blood (31) and gradient switching noise may lead to ECG signal degradation (Fig. 14-3). Vector ECG approaches appear to be particularly robust for R-wave detection (32). Monitoring of respiration with a thoracic bellows is also desirable.
 Figure 14-1 MDCT 3D volume rendering. This 3D VR image shows normal variant trifurcation anatomy of the LM artery. The left atrial appendage and pulmonary outflow tract have been removed to reveal the LCX artery origin (white arrowhead). The LAD is well seen (black arrow). The median ramus artery is the middle artery at the point of trifurcation. This artery is also known as the intermedius. Note also the great cardiac vein (colored in red) passing over the proximal branches (white arrow). (Adapted from Manghat NE, Morgan-Hughes GJ, Marshall AJ, et al. Multidetector row computed tomography: imaging congenital coronary artery anomalies in adults. Heart. 2005;91(12): 1515–1522, with permission.) |
A critical requirement for successful coronary MRI and magnetic resonance angiography (MRA) is the ability to achieve satisfactory ECG gating via an adequate ECG tracing. The first step toward a satisfactory tracing depends on the placement of the ECG leads. When placing MR compatible leads on the patient’s chest, it is recommended to follow the manufacturer’s guidelines. In general, leads should first be placed fairly close to one another in order to achieve a strong amplitude. Good contact between the
electrodes and the skin can be accomplished by shaving the skin, when necessary, and by ensuring that there is conductive gel to maximize the contact between the electrode pad and the skin. Twisting or braiding the ECG wires can improve the tracing, but loops of wire must be avoided, as the latter can result in superficial burns.
electrodes and the skin can be accomplished by shaving the skin, when necessary, and by ensuring that there is conductive gel to maximize the contact between the electrode pad and the skin. Twisting or braiding the ECG wires can improve the tracing, but loops of wire must be avoided, as the latter can result in superficial burns.
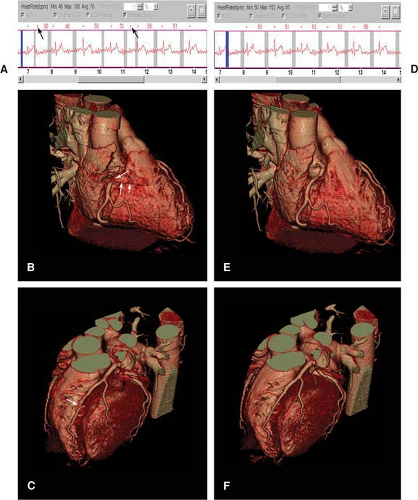 Figure 14-2 Influence of ECG tracing on image quality. A: The original ECG tracing, acquired simultaneously with the CT scan, demonstrates a noisy baseline. Ideally, the red boxes should be positioned on the R waves, but in this case, not always (black arrows). The numbers on top represent the calculated heart rate, which is inaccurate because the R-wave isolation is poor. The vertical gray bars correspond to 65% of the calculated R-R interval. B: The VR image of the RCA that was reconstructed based on the original ECG data yielded an edge artifact that obscures part of the RCA (white arrows). C: The VR image of the LAD that was reconstructed based on the original ECG data yielded an image with discontinuity in the LAD that could be misinterpreted as disease (arrow). D: A feature on contemporary machines enables the user to reposition the red boxes to coincide with the R wave. This capability allows for a re-registration and consequent reconstruction of the data at the same point in the cardiac cycle; the result is data uniformity and improved image quality for both the RCA (E) and LAD (F). (Courtesy of Stanford University Cardiovascular Imaging). |
The R wave is typically the most prominent feature of the ECG tracing and is used to prospectively trigger acquisitions. In addition to poor skin contact, erroneous or poor triggering may occur with excessive respiratory motion, suboptimal lead polarity, heightened T waves (Fig. 14-3), or arrhythmias. To correct gating problems from excessive
respiratory motion, the leads can be placed on the patient’s back. Lead polarity can be varied at the machine console to search for the most desirable tracing. Heightened T waves can be minimized with (a) changes in polarity, (b) the use of vectorcardiogram triggering systems, and (c) commercially supplied compensation software, the latter being important at 3T. Patients with arrhythmias present a substantial challenge—when the arrhythmias are severe and lacking periods of regularity, the exam may be nondiagnostic.
respiratory motion, the leads can be placed on the patient’s back. Lead polarity can be varied at the machine console to search for the most desirable tracing. Heightened T waves can be minimized with (a) changes in polarity, (b) the use of vectorcardiogram triggering systems, and (c) commercially supplied compensation software, the latter being important at 3T. Patients with arrhythmias present a substantial challenge—when the arrhythmias are severe and lacking periods of regularity, the exam may be nondiagnostic.
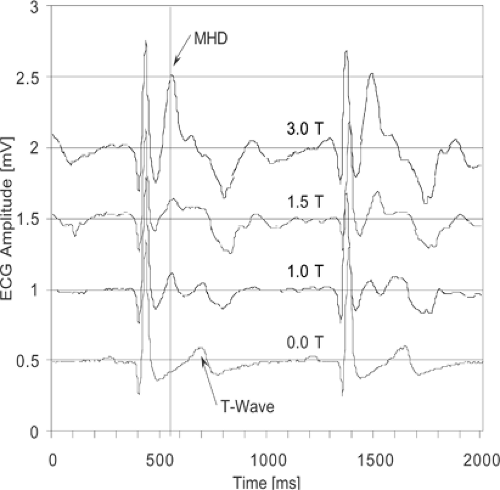 Figure 14-3 Effect of field strength on ECG tracing. ECG rhythm strip recorded in the same subject outside of the magnet (0.0T) and at 1.0T, 1.5T, and 3.0T field strengths, demonstrating the associated ST segments and T-wave alterations. These ECG changes are attributed to the magnetohydrodynamic (MHD) effect. (To facilitate the visualization, the DC offsets at the different field strengths were adjusted manually.) (Courtesy of Stefan E. Fischer, PhD.) |
As currently implemented, coronary MRI is among the most demanding of patient cooperation, and comprehensive cardiac MR sessions (function, perfusion, viability, flow, coronary imaging) are often relatively lengthy. Thus, to avoid confounders due to patient fatigue, coronary MRI should be performed relatively early in the imaging session. If imaging for coronary artery integrity is desired, administration of sublingual isosorbide dinitrate (2.5 to 5 mg) is suggested both to maximally dilate normal segments and to increase resting blood flow.
Technical Challenges and Solutions
Clinical MRA for the evaluation of similarly sized (e.g., renal, peripheral) vascular beds is now routine, but coronary MRI remains difficult due to several unique technical challenges. These challenges include the small caliber (3- to 6-mm diameter) of the coronary arteries, their near constant motion during both respiratory and cardiac cycles, their high level of tortuosity, and the surrounding signal from adjacent epicardial fat and myocardium.
Cardiac Motion
Bulk epicardial motion can be separated into that related to cardiac contraction/relaxation during the cardiac cycle and that due to a superimposed diaphragmatic and chest wall movement. In-plane coronary motion is maximal at early to midsystole (period of ventricular ejection) with prominent motion again during early diastole (rapid ventricular filling phase). The third component of rapid coronary motion follows atrial systole. During isovolumic relaxation, approximately 350 to 400 msec after the R wave, and again at mid-diastole (immediately prior to atrial systole), coronary motion is minimal and identifies an optimal period for data acquisition as it also corresponds to a period of high coronary blood flow.
While gantry speed limits data acquisition for coronary CTA, MRI techniques offer more flexibility, with acquisitions that may be tailored to an individual patient’s heart rate and diastasis period without the need for beta blockade. For a resting heart rate of 70 to 80 bpm, acquisition durations of approximately 80 to 100 ms during each cardiac cycle are utilized (33). With higher heart rates, the duration should be more abbreviated (e.g., <50 msec). With bradycardias, the acquisition interval can be expanded to 150 ms or longer.
Respiratory Motion
The second major motion challenge is suppression of respiratory-related artifacts. With inspiration, the diaphragm descends and the chest wall expands, resulting in an inferior displacement and anterior rotation of the heart (34).
During free breathing in the supine position, diaphragmatic excursion may approach 30 mm, with the predominant dwell time during end expiration (35). Minimizing respiratory motion artifacts can be achieved with several approaches, including sustained end-expiratory breath holding and the use of MR navigators. While repeated, sustained breath holding appears to have a role in healthy volunteers and highly motivated patients, free (uncoached) breathing with right hemidiaphragmatic MR navigators is generally preferred for most subjects, particularly for those with coexistent pulmonary disease (35).
During free breathing in the supine position, diaphragmatic excursion may approach 30 mm, with the predominant dwell time during end expiration (35). Minimizing respiratory motion artifacts can be achieved with several approaches, including sustained end-expiratory breath holding and the use of MR navigators. While repeated, sustained breath holding appears to have a role in healthy volunteers and highly motivated patients, free (uncoached) breathing with right hemidiaphragmatic MR navigators is generally preferred for most subjects, particularly for those with coexistent pulmonary disease (35).
Spatial Resolution
Spatial resolution requirements for coronary MRI depend on whether the goal is to simply identify the origin and proximal course of the coronary artery (e.g., suspected anomalous coronary disease) or whether the goal is to identify focal stenosis. For anomalous disease assessment, in-plane spatial resolution of 1.5 to 2 mm is likely sufficient, while submillimeter spatial resolution is needed for native coronary integrity assessment. Reverse saphenous vein grafts (SVG) are much larger in diameter than the native coronary arteries, with an intermediate spatial resolution likely to be sufficient.
Suppression of Signal from Surrounding Tissue
The coronary arteries are imbedded in epicardial fat. Fat has a relatively short T1 and resultant MR signal intensity similar to that of flowing blood. Frequency selective prepulses can be applied to saturate signal from fat tissue, thereby creating intrinsic contrast and allowing visualization of the underlying coronary arteries (36,37). The coronary arteries also run in close proximity to the myocardium. The myocardium and the coronary blood have relatively similar T1 relaxation values (850 ms and 1200 ms, respectively), making delineation of the coronary arteries difficult. To suppress myocardial signal, both T2 preparation prepulses (33,38,39) and magnetization transfer contrast (MTC) approaches may be used. An added benefit of the T2 prepulse is that it also suppresses deoxygenated blood signal from within the cardiac veins. This suppression is particularly useful if there is minimal epicardial fat and/or the great cardiac vein runs in close proximity to the LAD and LCX coronary arteries. The incremental impact of ECG gating, respiratory gating, and T2 preparation prepulses is displayed in Figure 14-4.
Coronary Magnetic Resonance Imaging Acquisition Sequences
Coronary MRI sequences can be conceptualized as being composed of the following building-block components: (a) cardiac (ECG) triggering to suppress bulk cardiac motion, (b) respiratory motion suppression (breath hold, navigators), (c) prepulses to enhance contrast-to-noise ratio (CNR) of the coronary arterial blood (fat saturation, T2 preparation, MTC), and (d) image acquisition that optimizes coronary arterial signal. The imaging sequences may include bright blood time-of-flight (TOF) (segmented k-space gradient echo), and steady state free precession (SSFP), all implemented as 2D (typically breath hold) and 3D (breath hold or free-breathing navigator) acquisitions. While segmented k-space gradient echo acquisitions have received the most clinical scrutiny, more advanced and less flow-sensitive SSFP methods and intravascular MR contrast agents are receiving increasing attention (40). Similarly, 3T MR systems offer the potential benefits of increased SNR.
Two-dimensional Segmented K-space Gradient Echo
Two-dimensional ECG triggered segmented k-space gradient echo coronary MRI has been available for over a decade and remains useful for older MR systems with slower gradients or those lacking sophisticated navigator technology.
After a coronal or sagittal scout to define the level of the coronary ostia, a series of 10 to 15 axial or oblique overlapping transverse slices (each slice during a single breath hold) are acquired at the level of the origin of the RCA and left coronary artery (LCA). Due to variability in the diaphragmatic position among breath holds, the acquisition of repetitive images with the same spatial coordinates may display adjacent regions of the coronary artery. For imaging of the RCA and more distal LCX, a single- or double-oblique image is acquired along the major axis of the AV groove, as defined in the transverse plane. Both breath-hold variability and coronary vessel tortuosity contribute to the need for 30 to 40 breath holds for a complete 2D coronary MRI examination. The number of breath holds may be reduced by the combination of breath holds with navigator correction (41,42,43). Spatial resolution, however, remains limited by the breath-hold duration and the need to maintain the acquisition duration during each R-R interval to <100 ms.
Similar breath hold 2D segmented k-space gradient echo acquisitions may also be used to image the larger diameter CABGs. Reverse SVGs are larger in diameter, and both SVGs and internal mammary bypass grafts are less mobile than the native coronary arteries, with predominant flow during ventricular systole. This facilitates data acquisition during a longer period (150 to 200 msec) within each R-R interval and with less rigorous requirements for strict respiratory motion suppression (wider navigator gating window or respiratory bellows gating). In addition, since SV bypass flow is predominantly systolic (44), and TOF
methods are dependent on inflow of unsaturated protons, data acquisition during late ventricular systole is often preferred. Susceptibility artifacts from stainless steel bypass graft markers and vascular clips continue to hinder bypass graft coronary MRI (Fig. 14-5).
methods are dependent on inflow of unsaturated protons, data acquisition during late ventricular systole is often preferred. Susceptibility artifacts from stainless steel bypass graft markers and vascular clips continue to hinder bypass graft coronary MRI (Fig. 14-5).
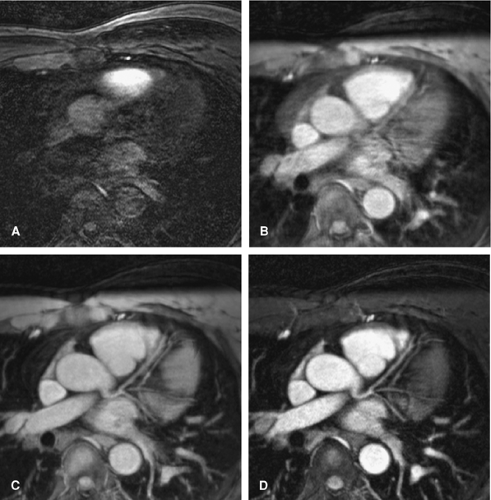 Figure 14-4 The importance of motion compensation strategies in MRI. Transverse image at the level of the LM and LAD in the same subject in the absence of cardiac and respiratory gating (A). The incremental value of ECG triggering with mid-diastolic data acquisition (B), navigator gating with real time motion correction (C), and T2 prepulse (D) are readily apparent. (Courtesy of Matthias Stuber, PhD.) |
Targeted Three-dimensional Segmented K-space Gradient Echo
The superior SNR and postprocessing capabilities of 3D coronary MRI make it particularly attractive, though unlike coronary CTA, the voxels are usually anisotropic. The development of free breathing/navigator methods has led to the widespread acceptance of free breathing 3D coronary MRI as the standard at many centers.
As data from an entire volume of tissue surrounding the coronary arteries are acquired, the set-up of free-breathing navigator 3D coronary MRI requires both less operator intervention and less patient cooperation than repetitive 2D breath-hold acquisitions. However, we have found it imperative that the timing and respiratory suppression method for gating of scout images be coherent with the coronary imaging sequences (Fig. 14-6).
For our first scout, we use an ECG-triggered, free-breathing, multislice 2D segmented gradient echo thoracic acquisition with nine transverse, nine coronal, and nine sagittal interleaved acquisitions. From this data set, the navigator is positioned at the dome of the right hemidiaphragm, and the base of the heart is readily identified (Fig. 14-7).
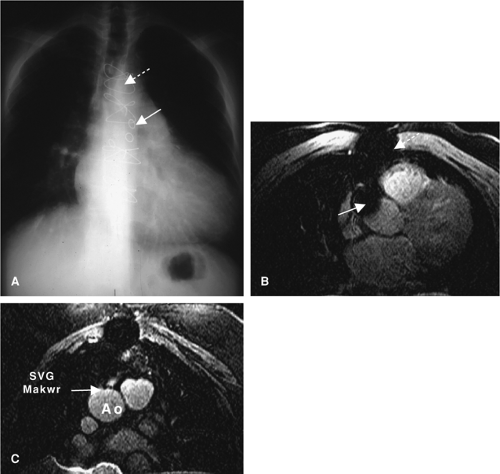 Figure 14-5 Magnetic susceptibility artifacts. A: Posterior-anterior (PA) chest x-ray in a patient with CABG. Note the sternal wires (dashed arrow) as well as the CABG markers (solid arrow). B: Transverse coronary MRI in the same patient. Note the large local artifacts (signal voids) related to the sternal wires (dashed arrow) and bypass graft markers (solid arrow). The size of the artifacts are related to the type of graft marker used. C: Barium and tantalum markers (arrow) result in the smallest artifacts. The size of the artifacts are also somewhat less with spin echo/black blood MRI as compared with gradient echo imaging. (Ao, ascending aorta.) (Adapted from Applebaum E, Hauser TH, Yeon SB, et al. Coronary artery imaging—clinical applications. In: Higgins CB, de Roos A, eds. MRI and CT of the Cardiovascular System. 2nd ed. Philadelphia: Lippincott Williams & Wilkins; 2006:311, with permission.) |
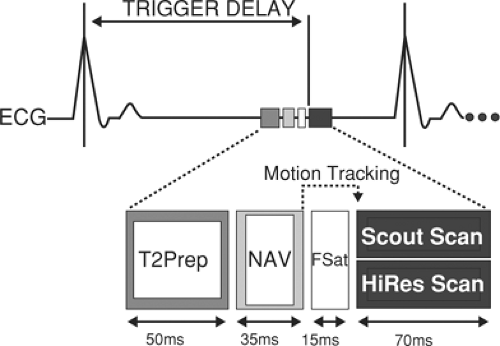 Figure 14-6 Schematic for key elements in the scout and high-resolution MR scans. Schematic of the coronary MRI pulse sequence for scout scanning (Scout Scan) and subsequent high-resolution coronary MRI (HiRes Scan). The elements of the sequence (T2-prepulse, anterior chest saturation prepulse [REST], navigator, fat saturation prepulse [FAT SAT], and 3D imaging sequence) are shown in temporal relationshp to the ECG and trigger delay. Note that the ECG timing and respiratory suppression for the Scout Scan and high-resolution coronary MRI are consistent. |
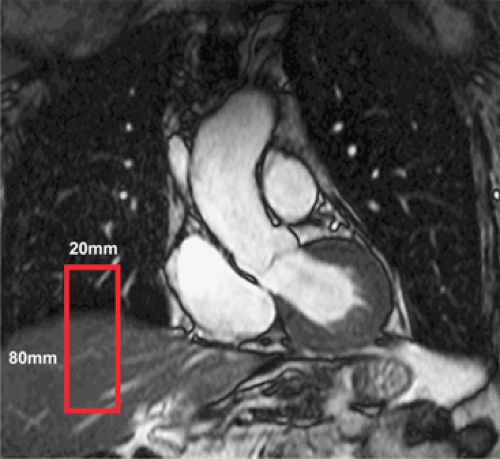 Figure 14-7 Navigator for respiratory compensation. Coronal thoracic image with identification of the navigator (red rectangle) at the dome of the right hemidiaphragm. |
A second scout, consisting of an ECG-triggered 3D fast gradient echo EPI scout, is then acquired with diaphragmatic navigator gating of a volume that includes the coronary arteries, beginning at the cardiac base and extending inferiorly. A free-breathing or breath-hold cine (consistent with the subsequent coronary MRI sequence) is then acquired perpendicular to the proximal/mid-RCA to define the optimal delay and acquisition period (timing and duration of patient specific minimal in-plane motion). Subsequently, a 3D volume is interactively prescribed in the transverse plane centered about the LM coronary artery (identified in the second scout) using the same ECG delay and navigator parameters as the scout. Typically, a 30-mm slab with 20 overlapping slices is acquired using a segmented k-space gradient echo acquisition (TR 7 ms, 8 to 12 phase-encoding lines/R-R interval) with submillimeter in-plane spatial resolution (0.7 ÷ 1.0 mm) and a temporal acquisition of 56 to 100 ms per heartbeat (33,45). For imaging of the RCA, transverse images from the second scout depicting the proximal, mid, and distal right coronary artery are identified using either a three-point “planscan” software tool (preferred) or in a plane parallel passing through the right and left AV groove. The LCX is often seen in the transverse (left) data set or lies in a plane parallel with the RCA and is therefore seen on the double-oblique RCA data set. Each submillimeter 3D segmented gradient echo acquisition is typically 10 to 12 minutes in duration (assuming a navigator efficiency of 40% to 55%). A similar approach has also been applied for CABGs (46).
Steady-State Free Precession
TOF coronary MRI methods are heavily dependent on inflow of unsaturated protons and blood into the imaging plane. If coronary flow is slow or stagnant, saturation effects will cause a local loss of signal. In contrast, SSFP is relatively insensitive to flow artifacts and, in addition, has superior SNR (47). Three-dimensional SSFP coronary MRI can be implemented with free-breathing/navigator methods (48,49) or with lower resolution prolonged breath holds (50) combined with fat saturation and T2 prepulses for surrounding tissue suppression.
Whole Heart
Both targeted 3D volumes (40,48,50,51) and “whole heart” approaches (49) have been described with segmented k-space methods and SSFP approaches. Right hemidiaphragmatic navigator is used with free breathing and an axial volume extending from approximately 1 cm above the take-off of the LM coronary artery to the diaphragm. Though more lengthy in total acquisition, setup is less complex than the targeted 3D scans, it provides for more distal vessel visualization (49), and is more conducive to advanced postprocessing methods (Fig. 14-8).
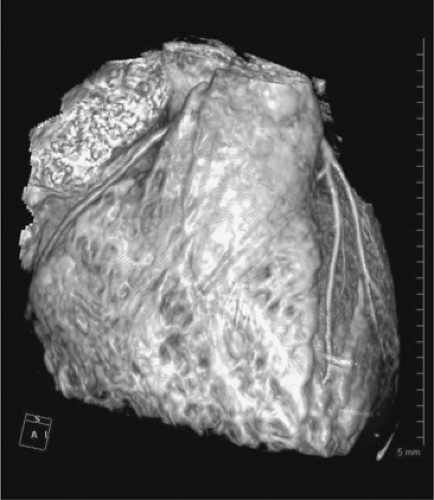 Figure 14-8 Whole heart SSFP coronary MRI. Three-dimensional reconstruction of a whole-heart SSFP coronary MRI following computer-assisted image segmentation enables major coronary vessels to be visualized. (Courtesy of Oliver Weber, PhD.) |
Contrast Enhanced
Contrast-enhanced MRI has gained widespread acceptance for abdominal, aortic, renal, and peripheral MRI, but the previously described unique constraints for coronary MRI have limited coronary applications of clinically available extracellular agents. Several novel intravascular (blood pool) MR contrast agents are under development and are being evaluated for coronary MRI, including gadolinium-based (52,53,54) contrast agents with inversion recovery methods. These intravascular agents afford longer scan times with free-breathing or repeated breath-hold methods.
Postprocessing
Postprocessing tools for coronary MRI are relatively rudimentary compared with those available for coronary CTA. As such, they are often used to convey summary results, with primary interpretation of the data set (anomalous coronary artery, focal stenosis) determined from scrolling through the source 3D data set.
 Figure 14-9 Diagram of the heart and coronary arteries from an anterior view. The RCA arises from the right aortic sinus, passes first between the right ventricular outflow tract and the right atrial appendage, and then runs in the right AV sulcus. The distal RCA begins just beyond the AM branch and passes horizontally along the diaphragmatic surface of the heart, forming the PDA (which arises from a dominant RCA in 85% of individuals), and the PLV. The AVNA is also commonly seen arising from the diaphragmatic portion of the RCA. Note that the apex of the left ventricle is supplied by the LAD and the anterior left ventricular wall by diagonals from the LAD. The inferior left ventricular wall receives its supply of blood flow by the PDA arising from the RCA; individuals with this coronary artery configuration are known as right dominant. Note also that the AV node is supplied by a short vessel at the bend of the RCA before the take-off of the PDA at a position known as the crux of the heart. (SVC, superior vena cava; Ao, aorta; AVNA, atrioventricular nodal artery; LAD, left anterior descending artery; LCX, left circumflex coronary artery; PDA, posterior descending coronary artery; PLV, posterior left ventricular artery.) |
Anatomy
Normal Anatomy
The normal coronary vascular anatomy has many variations and can be readily appreciated through the use of diagrams (Figs. 14-9, 14-10), schematics (Fig. 14-11), specimen injected MDCT (Fig. 14-12), and with MDCT from patients (Figs. 14-13, 14-15 and 14-16).
The RCA courses in the right AV groove and provides nutrient branches to the right ventricular free wall, extending to the acute margin of the heart. The first branch arising from the RCA is the conal or infundibular branch (55), which courses anteriorly to supply the muscular right ventricular outflow tract or infundibulum. The distal extent of the RCA varies and may extend posteriorly as far as the obtuse margin of the heart. In 90% of patients, the RCA supplies the posterior descending coronary artery branch at the crux of the heart, which supplies the AV node and the posterior aspect of the interventricular septum.
The RCA supplies blood to the atria with a highly variable pattern of small branches. The sinus node artery arises from the proximal RCA in approximately 50% of patients.
The left coronary ostium is usually single, giving rise to a short, common LM artery that promptly branches
into the LAD and LCX coronary arteries. The LAD courses in the anterior interventricular groove, giving rise to diagonal branches that course at downward angles to supply the anterolateral free wall of the left ventricle. More distally, the LAD gives rise to the anterior septal perforating branches as it extends toward the cardiac apex. Small branches may arise from the LAD and supply the anterior wall of the right ventricle.
into the LAD and LCX coronary arteries. The LAD courses in the anterior interventricular groove, giving rise to diagonal branches that course at downward angles to supply the anterolateral free wall of the left ventricle. More distally, the LAD gives rise to the anterior septal perforating branches as it extends toward the cardiac apex. Small branches may arise from the LAD and supply the anterior wall of the right ventricle.
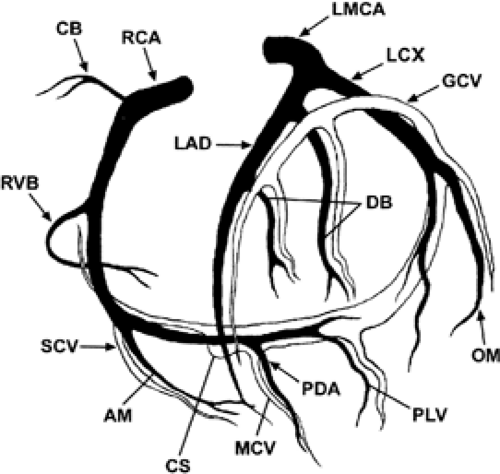 Figure 14-10 Diagram of the coronary arteries and veins in left anterior oblique view. The left coronary system consists of the left main coronary artery (LMCA), left circumflex artery (LCx), left anterior descending artery (LAD), diagonal branches (DB), and obtuse marginal branch (OM). The right coronary system consists of the right coronary artery (RCA), conus branch (CB), right ventricular branch (RVB), acute marginal branch (AM), posterior descending artery (PDA), and posterior left ventricular branch (PLV). The coronary venous system is composed of the coronary sinus (CS), great cardiac vein (GCV), middle cardiac vein (MCV), and small cardiac vein (SCV). (Reprinted from Sevrukov A, Jelnin V, Kondos GT. Electron beam CT of the coronary arteries: cross-sectional anatomy for calcium scoring. AJR Am J Roentgenol. 2001;177(6):1437–1445, with permission.) |
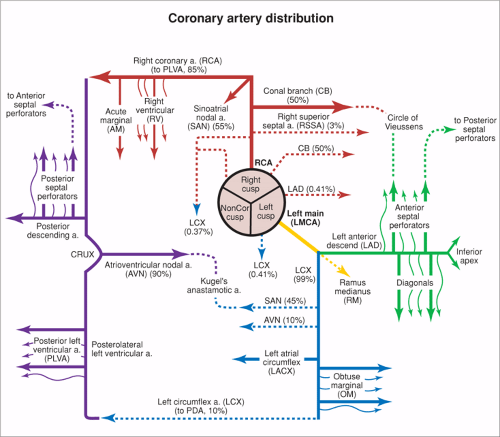 Figure 14-11 Schematic of coronary artery anatomy and common variants. The LM coronary artery is shown (yellow line). The three main systems, the RCA coronary system (red lines), the LAD coronary system (green lines), and the LCX coronary system (blue line) and associated branches are depicted. The purple lines indicate the variable contributions influenced by coronary artery dominance, where roughly 70% of the time the supply is from the RCA, 20% from the LCx, and 10% as a balanced contribution from both. (Adapted from Frandics Chan, MD.) |
The LCX coronary artery courses along the left AV groove, around the obtuse margin, and posteriorly toward the crux of the heart. When the LCX coronary artery reaches the crux of the heart and supplies the posterior descending coronary artery, the left coronary system is termed dominant, occurring in approximately 10% of patients. Atrial branches may arise from the LCX coronary artery and supply the sinus node in 40% of patients. Obtuse marginal branches arise from the LCX system to supply the posterolateral aspect of the left ventricle. In approximately 70% of patients, a coronary branch arises early off the left coronary system (referred to as the ramus medianus, intermedius, or intermediate branch) to supply an area between diagonal branches from the LAD and obtuse branches from the LCX.
The normal coronary arteries situated subepicardially can be subdivided into coronary segments that are numbered
according to a model suggested by the American Heart Association (56). The right coronary artery is situated at the right AV sulcus and is divided into four segments. The proximal segment (segment 1) begins at the ostium of the right coronary sinus and ends at the acute marginal branch, the middle segment (segment 2) continues to the bottom of the heart, followed by the distal segment (segment 3) that ends at the crux cordis. At the crux cordis, the right coronary artery turns by 90 degrees and runs into the posterior interventricular sulcus and is then called the posterior descending coronary artery
(segment 4). It is often necessary to generate several renderings to display all features of the RCA (Fig. 14-15).
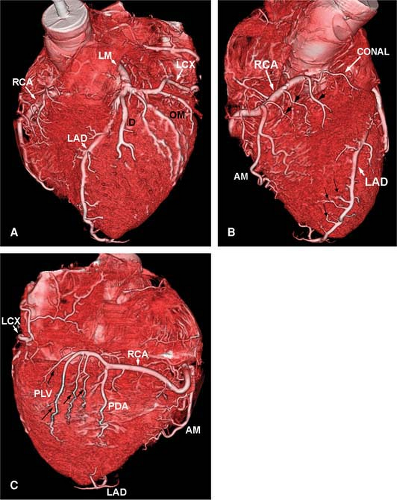 Figure 14-12 Coronary artery anatomy as demonstrated by MDCT of a human heart specimen injected with dilute iodinated solution into the aortic root. A: VR frontal reconstruction emphasizing the LCA. The LM appears from under the pulmonary outflow track and gives rise to the LAD and LCX. Left ventricular branches that arise from the LCX artery are designated as marginal branches, whereas those arising from the LAD are designated as diagonal (D) branches. In this case, the large D artery originates close to the LAD/LCX bifurcation and can be referred to as an intermediate branch. B: VR frontal oblique reconstruction emphasizing the LAD and RCA. The first branch is the conus, which extends anteriorly from the RCA. Of the many branches supplying the right ventricular wall (arrowheads), the largest vessel can typically be identified—the acute marginal branch. The LAD is well seen in this projection, including numerous septal perforators (arrows). C: VR reconstruction emphasizes the coronary anatomy on the posterior surface of the heart. The RCA, after having given off the AM branch, is seen tracking posteriorly along the right AV sulcus. The PDA extends toward the apex along the interventricular septum, and multiple PLV branches (black arrows) are seen in the terminus of the RCA. The posterior extension of the LCX is seen giving off posterior atrial branches toward the base. The distal aspect of the LAD is seen as it curves around the apex of the heart. (RCA, right coronary artery; LAD, left anterior descending artery; LCX, left circumflex coronary artery; LM, left main artery; AM, acute marginal branch; PDA, posterior descending coronary artery; PLV, posterior left ventricular artery.) (Courtesy of Stanford Cardiovascular Imaging.) |
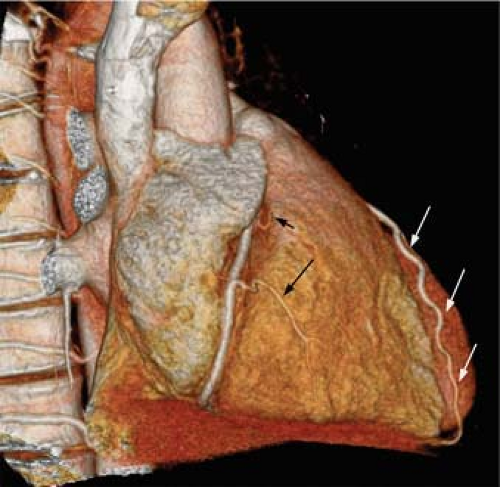 Figure 14-13 Normal coronary anatomy with MDCT. This ECG-triggered MDCT VR image shows segments the RCA with a conus branch (short black arrow) and an acute marginal branch (long black arrow). The acute marginal branch is the point of reference for division of the RCA into segments 1 and 2. The proximal RCA is obscured by the right atrium. Also note that the distal LAD can be seen as well (white arrows). (Courtesy of Stanford Cardiovascular Imaging.) |
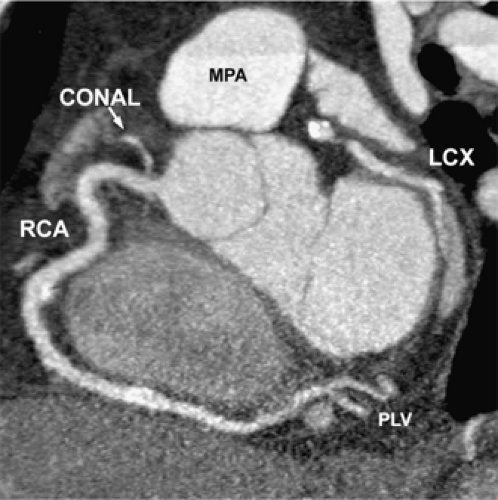 Figure 14-14 Normal coronary anatomy with MDCT. This thin-slab restricted MIP image from a MDCT study shows a tortuous RCA with its conal branch. The right conus artery (conal branch) is the first ventricular branch of the RCA, which courses anteriorly to supply the muscular right ventricular outflow tract or infundibulum. The RCA is well visualized in this projection to the base of the heart, where the PLV origin is seen. (RCA, right coronary artery; MPA, main pulmonary artery; LCX, left circumflex artery; PLV, posterior left ventricular branch.) (Courtesy of Stanford Cardiovascular Imaging.) |
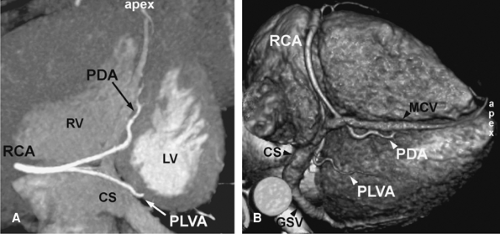 Figure 14-15 Normal coronary anatomy with MDCT. A: Thin-slab restricted MDCT MIP showing that the inferior surface of the heart nicely demonstrates the RCA and its distal branching into the PLVA branch and the anteriorly coursing PDA, the latter running in the posterior interventricular sulcus. Note the relationships to the right ventricle and the coronary sinus (CS). B: A VR image from the inferior surface of the heart shows the RCA and its distal branches, the PLVA, and the PDA partially obscured by the CS and the middle cardiac vein, respectively. The PDA courses toward the cardiac apex. (LV, left ventricle; PLVA, posterior left ventricular artery; RCA, right coronary artery; PDA, posterior descending artery.) (Courtesy of Stanford Cardiovascular Imaging.) |
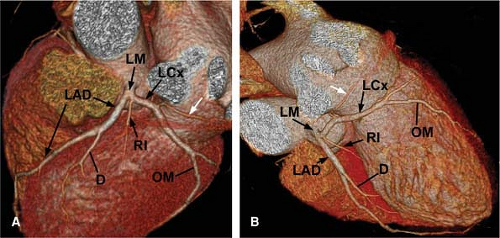 Figure 14-16 Normal left coronary anatomy with MDCT. VR left ventricular view in the frontal/cranial projection (A) and a steeper oblique projection (B) from an MDCT acquisition. The LM bifurcates into the LAD and the LCX. Note the ramus intermedius, an early branch off the left coronary system supplying the area between diagonal branches from the LAD and obtuse marginal branches from the LCX. Given its small size and origin just beyond the bifurcation at the proxima LCX, this vessel could also be considered as a very proximal obtuse marginal. The white arrow depicts an atrial branch off the LCX. (Courtesy of Stanford Cardiovascular Imaging.) |
Numbering continues with the LM coronary artery (segment 5) originating from the left coronary sinus. This LM may vary in size and branches early into the LAD (segment 6) and LCX (segment 11). The LAD coronary artery is situated in the anterior interventricular sulcus and is divided into the proximal (segment 6), middle (segment 7), and distal (segment 8) segment. This vessel also provides the first (segment 9) and second (segment 10) diagonal branch as well as penetrating septal branches. The proximal (segment 11) and distal (segment 13) part of the circumflex coronary artery is situated in the left AV sulcus and provides the obtuse marginal branch (segment 12). The most distal branches of the circumflex coronary artery are the posterolateral and posterior descending branch (segments 14 and 15).
Commonly, the coronary vein can be identified in the anterior interventricular sulcus accompanying the LAD coronary artery. At the level of the proximal segment of the LAD coronary artery, the coronary vein turns 90 degrees to dorsal, crossing over the circumflex coronary artery. Here, it runs parallel to the circumflex coronary artery in the left AV sulcus to the bottom of the heart opening up to the coronary sinus and draining into the right atrium.
Dominant Coronary Artery
The vessel and branches of the coronary artery tree—in particular, the most distal branches—may vary widely from patient to patient. Commonly, one of the three major coronary arteries is larger, has more side branches, and provides a larger portion of the myocardium with blood than the others. This coronary artery is called the dominant coronary artery, and stenoses in this vessel may be of higher clinical relevance than in other vessels.
The lateral wall of the myocardium is furthest away from the coronary artery ostium and most of the coronary variances are seen here. As described previously, the right as well as the circumflex coronary artery may both provide a posterior descending coronary branch (segments 4 and 15). In this indeterminate type, the lateral wall of the myocardium is supplied by both the right and left coronary artery. In fact, this type accounts for only 8% of all coronary supplying types. The right-supplying type with segments 4 and 14 coming from the right coronary artery accounts for approximately 89%. The left-supplying type with both branches coming from the circumflex coronary artery is only rarely found in approximately 3% of patients (57).
Asymptomatic Anatomy Variant
The incidence of coronary anomalies is variable and has been reported for up to 5.6% of all patients undergoing coronary angiography (57). Most of the coronary anomalies are asymptomatic and only found incidentally. In normal coronary anatomy, the left and the right coronary artery originate from the left and right coronary sinus, respectively. However, in coronary anomalies, the left and right coronary artery may originate from any other: right, left, or noncoronary sinus. When the aberrant coronary artery is situated
posterior the aortic root, it is currently considered as a benign course with usually no therapeutic implication.
posterior the aortic root, it is currently considered as a benign course with usually no therapeutic implication.
Symptomatic Anatomy Variant
Coronary anomalies may be a significant cause of chest pain, myocardial ischemia, and sudden cardiac death. For instance, in young athletes, coronary anomalies may account for up to 20% of unheralded deaths (58). In these instances, the aberrant left or right coronary artery is situated in between the aortic root and pulmonary outflow tract. Currently, the hypothesis exists that the aberrant coronary artery may be squeezed within the two major vessels—in particular, under high pressure or stress leading to myocardial ischemia. Depending on the anatomical situation, these kinds of coronary anomalies may require reinsertion or protection against ischemia by bypass grafting.
Bland-White-Garland Syndrome
With an incidence of 1 in 3,000 newborns, Bland-White-Garland syndrome describes a coronary in which the left coronary artery (LCA) starts from the pulmonary artery (PA) instead of the ascending aorta, leading to left ventricular failure, either congenitally or shortly after birth. Symptoms include failure to thrive, dyspnea, tachypnea, precordial pain, sweating, pallor, and crying after feeding and exertion. If untreated, death is likely in childhood or adolescence. Treatment may require surgical correction by reinsertion or bypass grafting. It is only rarely described that the right coronary may originate from the PA (reverse Bland-White-Garland syndrome), leading to atypical symptoms in the adolescent.
Clinical Studies
At the time of this writing, the largest body of published clinical experience has been with the ECG-triggered 2D or targeted 3D segmented k-space gradient-echo coronary MRI approaches, with increasing preliminary reports on whole heart SSFP, intravascular contrast, and 3T methods. MDCT studies are rapidly proliferating, with data available using 4 through 64 detectors and steady improvements being realized with higher detector systems.
Evaluation of Normal Coronary Arteries
Contrast-enhanced MDCT with submillimeter collimation and retrospective ECG-gated image reconstruction permits successful noninvasive visualization of the coronary arteries (Fig. 14-17). For MRI, a relatively low spatial resolution (1.5 ÷ 2.0 mm) breath-hold 2D segmented k-space gradient echo approach (36) was the first robust approach for imaging the native coronary arteries. As implemented across numerous vendor platforms, the LM, LAD, and RCA are visualized in nearly all subjects (59,60,61,62,63,64), with proximal coronary artery diameter similar to that reported by x-ray angiography and pathology.
Currently, both targeted 3D segmented k-space gradient echo and whole-heart SSFP coronary MRI methods have reported successful visualization of all the major vessels in nearly every subject and predominate in current practice. A distinct advantage of the 3D approaches is increased contiguous visualization of length/distal segments (33,49).
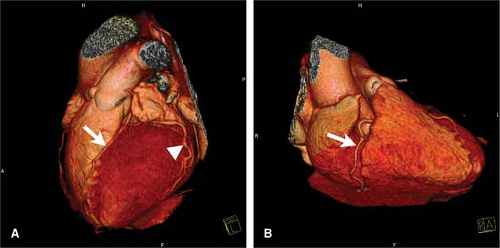 Figure 14-17 Normal anatomy in a 64-year-old female, depicted with MDCT. A: VR nicely displays the course of the LCX coronary artery (arrow) and the circumflex coronary artery (arrowhead). B: The RCA courses in the right AV groove. |
Anomalous Coronary Disease
The detection and exact anatomic definition of coronary artery anomalies is necessary for establishing a prognosis and initiating upcoming therapeutic procedures. The potential association with myocardial ischemia and sudden cardiac death highlights the need to identify those individuals with at-risk aberrant vasculature, often referred to as the malignant variety. Moreover, the capacity to distinguish benign anomalies from those associated with serious complications represents an important contribution from both CT and MRI, and these modalities can be clarifying when other imaging studies, including conventional angiography, are suggestive.
While the majority of coronary artery anomalies are not thought to be hemodynamically significant, the origin of a coronary artery from the contralateral side with subsequent passage between the aorta and PA has the potential to impair myocardial perfusion (65,66) (Figs. 14-18, 14-19).
Invasive coronary angiography is limited to a projectional 2D view of the coronary arteries and can lead to misinterpretations (67). Contrast-enhanced electron beam tomography has a lower spatial but higher temporal resolution than MDCT and has considerably lower radiation exposure. MRI offers a noninvasive, nonionizing radiation method that does not require contrast media. It does, however, require expertise for consistent results.
Computed Tomography
The reliability of MDCT coronary CTA for the evaluation of anomalous coronary arteries has been shown (68,69,70). In a recent study, all patients with coronary artery anomalies and all controls with normal coronary anatomy were identified by MDCT (70). In that study, the origins and course concerning their anatomical relationship to adjacent cardiac structures were visualized in all patients (Figs. 14-20, 14-21). Interestingly, one study showed that selective cannulation and final diagnosis was possible in only 11 of the 20 catheter angiograms performed, suggesting that MDCT may outperform conventional catheter angiography for this application (68).
Coronary Magnetic Resonance Imaging for Anomalous Coronary Disease
Coronary MRI has several advantages in the diagnosis of coronary anomalies. In addition to not employing ionizing
radiation (an important consideration among children, adolescents, and younger adults), coronary MRI also does not require placement of an intravenous catheter or administration of contrast (Fig. 14-22).
radiation (an important consideration among children, adolescents, and younger adults), coronary MRI also does not require placement of an intravenous catheter or administration of contrast (Fig. 14-22).
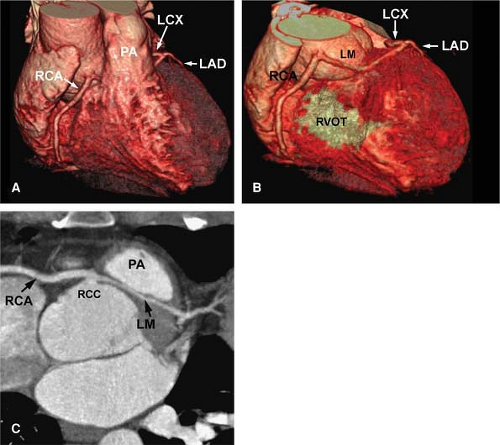 Figure 14-18 Aberrant left main coronary artery (malignant variety). VR and curved reformatted images from gated multislice CTA (64-slice scanner); 0.6-mm detector width with 0.75-mm reconstruction. A: The LM coronary artery arises from the anterior or right coronary cusp of the aorta and courses between the aorta and pulmonary outflow tract. The PA obscures the proximal LM. B: With an anterior cut plane, the PA has been removed from the image, revealing the right ventricular outflow tract (RVOT) and allowing for a better demonstration of the aberrant LM coronary artery. In both images, the LM can be seen to bifurcate into the LCX and LAD. C: This curved reformatted image nicely shows the malignant course of the LM in a format that is readily appreciated. (RCA, right coronary artery; LCX, left circumflex coronary artery; LAD, left anterior descending artery; RCC, right coronary cusp; PA, pulmonary artery.) (Courtesy of Stanford Cardiovascular Imaging.) |
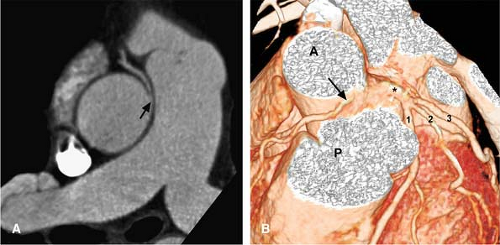 Figure 14-19 Aberrant RCA (malignant variety) and left main trifurcation shown with CTA. A: This source image offers a straightforward demonstration of an anomalous RCA (arrow), insinuating between the aorta and PA. B: This VR view shows the aberrant origin of the RCA (arrow) coming off between the aorta (A) and pulmonary artery (P). The LM coronary artery (*) is seen as well, trifurcating into the LAD (1)
Get Clinical Tree app for offline access
Stay updated, free articles. Join our Telegram channel
Full access? Get Clinical Tree


|