(1)
Department of Medicine, Johns Hopkins University School of Medicine, Baltimore, MD, USA
Keywords
NormalRateRhythmAxisIntervalsWaveformPRQRSQTSTThe heart is a remarkable organ, responsible for the coordinated pumping of blood through the pulmonary and systemic circulations. The muscular contraction of the chambers (systole), followed by a slightly longer period of relaxation (diastole), proceeds continuously, day in and day out, with precision and reliability in most circumstances. This book is an approach to the manifestations of the normal and abnormal electrical events associated with the function of the heart as a pump.
The electrocardiogram (EKG) is a graphic representation of the electrical activity of the heart. The heart’s electrical waveform can be detected by electrodes placed on the surface of the body. From the initial 3 leads of Einthoven, who inaugurated electrocardiography, current EKGs are composed of 12 leads, each of which records the electrical pattern from a slightly different orientation or perspective. There are two types of leads (Table 1.1): (1) the limb leads, and (2) the precordial leads. The limb leads include Einthoven’s original three, still called I, II, and III, plus the “augmented limb leads,” aVR, aVL, and aVF. The precordial leads are denoted V1, V2, and so on through V6. The leads are recorded by modern electrocardiography equipment by properly attaching the electrodes on the patient’s surface (Fig. 1.1) and entering the patient’s identifying information into the machine. The wiring in most current machines provides for recording at least 3 leads concurrently and then automatically switching to the next 3 leads until all 12 are recorded. The leads are recorded in a routine order, which is usually as follows: I, II, and III; then aVR, aVL, and aVF; next V1, V2, and V3; and finally V4, V5, and V6. Some machines record and display 6 leads concurrently, some all 12 leads.
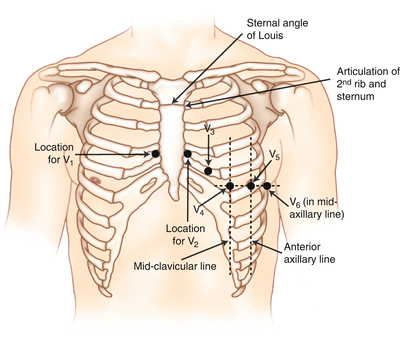
Table 1.1
Electrocardiographic leads
Limb | Precordial |
|---|---|
I, II, III | V1, V2, V3 |
aVR, aVL, aVF | V4, V5, V6 |
Fig. 1.1
Landmarks for placement of precordial leads
When recorded in the usual format of three concurrent leads, the recorded tracing is usually displayed in a 3 × 4 pattern: three down and four across, and sometimes includes a rhythm strip across the bottom (Fig. 1.2).
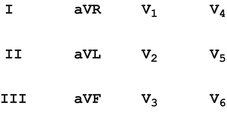
Fig. 1.2
Usual orientation of leads on the EKG taken with current machines, recording three leads simultaneously
Earlier EKG machines recorded only 1 lead at a time (single-channel), and a small section from the recorded strip from each of the 12 leads was cut from the strip and mounted on a single page. These 12 leads were typically mounted 3 across (I, II, III, then aVR, aVL, aVF, etc.) and 4 down (Fig. 1.3). The reason to include this information on the variability of EKG recording is twofold: (1) single-channel machines are still in use and (2) old EKGs in the patient’s medical record could have been recorded in different ways, and one should be aware of the different fashions in which tracings may be presented.
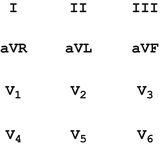
Fig. 1.3
Typical orientation of leads on EKGs recorded one lead at a time
The EKG records three electrical cardiac events: (1) atrial depolarization, (2) ventricular depolarization, and (3) ventricular repolarization. The electrocardiographic correlates of these events are called the P wave, the QRS complex, and the T wave, respectively [1] (Fig. 1.4). Atrial repolarization is not usually reflected on the EKG tracing because it occurs at about the same time as ventricular depolarization; the electrical manifestation of atrial repolarization is usually obscured by the QRS complex. Each contraction of the heart is dependent on electrical activation; the electrical event must take place before a mechanical event can occur. Depolarization must occur to cause the contraction of either the atrial or ventricular muscle fibers (i.e., systole), and repolarization must occur to allow the heart muscle to relax (i.e., diastole). The electrical events occur fractions of seconds prior to the mechanical events (Fig. 1.5). In certain situations, the electrical events occur but because of a pathological condition the mechanical events do not follow (“electrical–mechanical dissociation” or “pulseless electrical activity”).
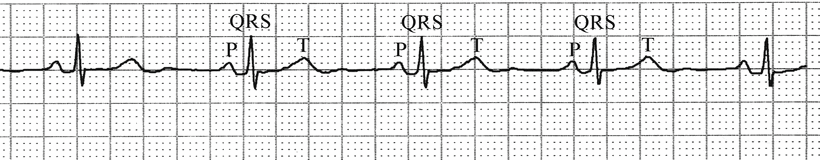
Fig. 1.4
The basic waves and complexes of the cardiac cycle. The P waves, QRS complexes, and T waves are labelled
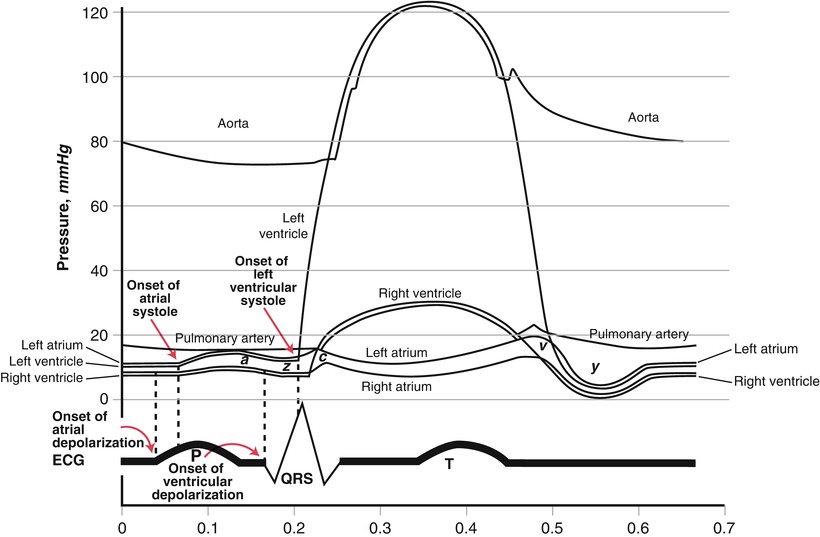
To summarize, the P wave is the electrical manifestation of atrial depolarization, not atrial systole; the QRS complex is the electrical manifestation of ventricular depolarization, not ventricular systole; and the T wave is the electrical manifestation of ventricular repolarization, not ventricular diastole. One systole/diastole, contraction/relaxation, P/QRS/T constitutes a cycle, the “cardiac cycle,” which repeats an average of about 80 times per minute.
As one can see, the P and T waves are rounded or curved, while the QRS is sharp or spiked (see Fig. 1.4). The QRS complex can be a variety of shapes and sizes. These various configurations can be described by using the letters Q, R, and S with their associated definitions. The Q wave is the part of the QRS complex that is a negative (downward) deflection that may initiate the QRS complex. The R wave is the first positive (upward) deflection of the QRS complex, and the S wave is a negative deflection after the R wave. If another positive deflection follows the S wave, it is called R′ (“R-prime”). Not all QRS complexes have a Q, R, and S wave. In fact, a QRS complex may have only one of these waves. A positive deflection alone for the QRS is called an R wave, while only a negative deflection is called a QS wave, a notation that specifically indicates the absence of any positive deflection or R wave (Fig. 1.6). But even when only an R wave is present, for example, the whole complex is still called a QRS complex as a general term.
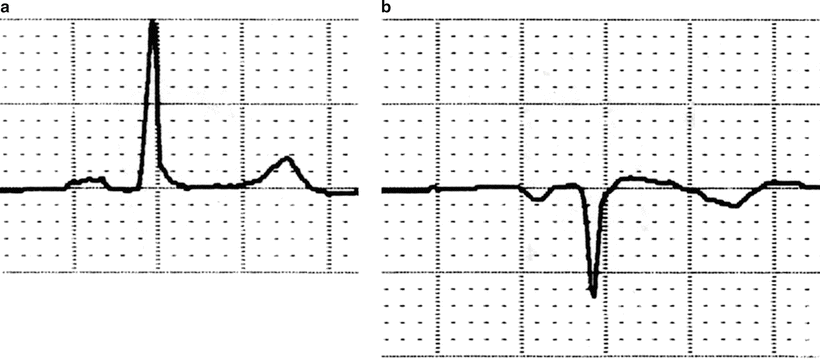
Fig. 1.6
(a) QRS complex comprised solely of an R wave. (b) QRS complex comprised of a QS wave
Occasionally one sees the letters of the QRS complex written with some letters in lower case and other letters capitalized. This is a convention used to reflect the relative size of each of the components of the QRS complex. Thus, a “Q” wave is deeper and wider than a “q” wave; an “R” wave is taller and wider than an “r” wave; and an “S” wave is deeper and wider than an “s” wave. Proper terminology can also describe the relative size of one component of the QRS compared to the other components. When one sees “qRs” written to describe a complex, one should expect to see a small initial downward deflection, followed by a tall, wider upward deflection, and a small terminal downward deflection. Examples of various QRS configurations are given in Fig. 1.7.
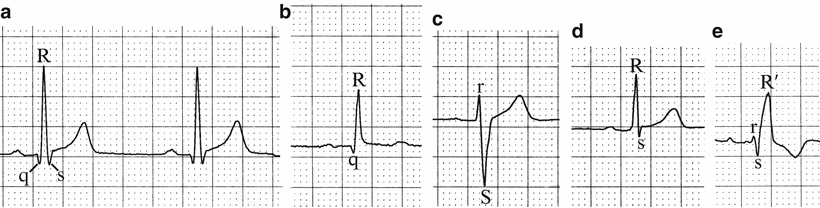
Fig. 1.7
QRS complexes: (a) qRs. (b) qR. (c) rS. (d) Rs. (e) rsR′
Sometimes people use incorrect nomenclature for the QRS complex. The R wave is not defined as the largest or most prominent part of the QRS complex. Rather, it is the first positive deflection of the QRS, regardless of its size. And there is no such thing as an “inverted R wave.” Such a deflection would have to be a Q or S. There can be inverted P or T waves, but never inverted Q, R, or S waves.
When the EKG is recorded properly, the paper speed is 25 mm/s. Electrocardiographic paper is printed with intersecting lines 1 mm apart, and so by measuring the distance covered by each part of the cycle it is possible to determine the duration of each component (Fig. 1.8). The EKG paper has darker lines every 5 mm, and since the lines are printed both vertically and horizontally, square boxes are created. Each small box, since it is 1 mm in length and the paper speed is 25 mm/s, is equivalent to 1/25 of a second, or 0.04 s. Each large box, composed of five small boxes, is therefore equal to 5/25 of a second, or 0.2 s. Five large boxes comprise 1 s.
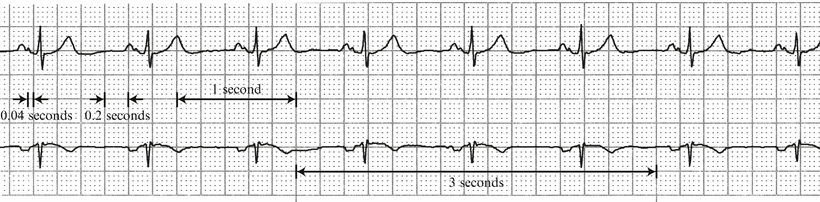
Fig. 1.8
Time/distance relationships at proper paper speed (25 mm/s)
Small vertical marks at the top or at the bottom of the paper are separated by 15 large boxes, or 3 s. These vertical marks allow more rapid calculation of time on long electrocardiographic tracings, called “rhythm strips,” either recorded concurrently in three or more leads (usually V1, II, and V5) or in one single lead on single-channel machines (typically, lead II). When making EKG measurements, it is customary to estimate intervals to the nearest 1/4 of a small box, or 1/4 mm, and therefore to the nearest 0.01 s.
Now that you can recognize the electrical components of each cardiac cycle and know how to determine and how to time the electrical events, you are ready to set out on interpretation of the EKG. Each time you formally interpret an EKG, five principal items need to be included: (1) rate, (2) rhythm, (3) axis, (4) intervals, and (5) waveform (Table 1.2). Each of these five items will be covered separately. After you have reviewed and reported each of these five items, you provide an overall summary of the EKG. This is not a recapitulation of the information given in the five areas above, but rather a brief statement which provides a synthesis of the information gathered in the five categories.
Table 1.2
Components of the formal interpretation of an EKG
Rate |
Rhythm |
Axis |
Intervals |
Waveform |
Summary |
Rate
The heart rate is the number of cardiac cycles per minute. Two similar methods to determine heart rate are (1) recording a 60-s strip and simply counting the number of P waves or QRS complexes included, or (2) by recording a 6-, 10-, 15-, or 30-s rhythm strip, counting the number of complexes present, and multiplying by the correct number to convert to beats per minute. Both of these methods are tedious and hardly ever done, except in the presence of an irregular rhythm. Instead, the heart rate can be determined from the time elapsed between successive beats and converting this time to beats per minute. It is customary to determine both the atrial and ventricular rates. Usually these are the same, but in certain arrhythmias they are different. The atrial rate is determined by measuring the P–P interval (the distance between consecutive P waves), and the ventricular rate is determined by measuring the R–R interval (the distance between consecutive QRS complexes), and then converting the intervals into beats per minute by dividing 60 by the P–P or R–R interval. When the atrial and ventricular rates are the same, as in normal sinus rhythm, one can measure just the R–R interval and determine the ventricular rate, which will be equal to the atrial rate.
The most accurate method to determine heart rate is to measure the R–R interval in seconds and divide that interval into 60 (Fig. 1.9). This is easily accomplished with a pocket calculator or computer, less easily by long division, and perhaps most easily by using Table 1.3.
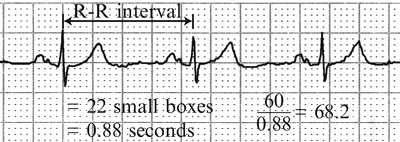
Fig. 1.9
Determining the heart rate. The R–R interval in this example is 18 small boxes, or 0.72 s, since each small box = 0.04 s. To determine the heart rate, divide 0.72 into 60, which is 83.3, and round off to the nearest whole number. With an R–R interval of 0.72 s, the heart rate is 83 beats per minute
Table 1.3
Converting R–R interval to heart rate
R–R interval | Heart rate | R–R interval | Heart rate |
|---|---|---|---|
0.40 | 150 | 0.81 | 72 |
0.41 | 146 | 0.81 | 73 |
0.42
Stay updated, free articles. Join our Telegram channel
Full access? Get Clinical Tree
 Get Clinical Tree app for offline access

|