Enlarged cardiac silhouette on chest x-ray (CXR) in the absence of cardiopulmonary disease is often dismissed as “pseudocardiomegaly.” We aimed to assess the impact of epicardial adipose tissue (EAT) on radiographic heart size and to determine the clinical significance of cardiomegaly caused by EAT. In total 112 patients (52 ± 13 years old, 53% women, body mass index 32 ± 8 kg/m 2 ) with structurally normal hearts by transthoracic echocardiography underwent cardiac computed tomography (CCT). EAT volume was measured by CCT and cardiothoracic ratio (CTR) and cardiac transverse and lateral horizontal transverse diameters were measured on posteroanterior and lateral view CXR. EAT volume (mean 122 ± 49 ml) correlated directly with age, body mass index, hypertension, hyperlipidemia (p <0.05 for all comparisons), transverse diameter (r = 0.50, p <0.001), CTR (r = 0.45, p <0.001), and lateral horizontal transverse diameter (r = 0.38, p <0.001). EAT volume was larger in those with increased (n = 22) compared to those with normal (n = 90) CTR (154 ± 54 vs 115 ± 54 ml, p = 0.0005). Patients with cardiomegaly were also older (58 ± 13 vs 50 ± 12 years old, p = 0.009) and more often had diabetes (32% vs 9%, p = 0.03), hypertension (86% vs 46%, p = 0.001), hyperlipidemia (68% vs 44%, p = 0.04), or obstructive coronary artery disease by CCT (32% vs 11%, p = 0.04). Coronary artery calcium score was also higher in those with cardiomegaly (median 56 [first tertile 0, third tertile 298] vs 0 [0, 55], p = 0.006). In conclusion, cardiomegaly on CXR can be caused by excessive EAT. This is associated with several coronary risk factors and with coronary calcification and stenosis. Cardiomegaly in this setting may be regarded as another noninvasive marker of coronary atherosclerosis.
The epicardium in most residents in western societies contains adipose tissue. At necropsy, epicardial adipose tissue (EAT) adds markedly to total cardiac weight. This visceral depot has also been examined by noninvasive cardiac imaging techniques such as echocardiography, cardiac computed tomography (CCT), and cardiac magnetic resonance imaging. These studies have established a close relation between EAT and atherosclerotic risk factors (obesity, hyperlipidemia, metabolic syndrome) and coronary calcium. Some data have indicated that large deposits of EAT are associated with the presence of inducible myocardial ischemia and adverse cardiac events and that weight loss and aerobic exercise can lead to a decrease in the size of the EAT compartment. Because chest x-ray (CXR) is the most commonly performed cardiac imaging procedure, we aimed to determine whether cardiomegaly in the absence of apparent cardiopulmonary abnormalities would provide an initial clue to the presence of cardiac adiposity and its associated heightened risk of coronary atherosclerosis.
Methods
The study population consisted of 112 adults from 356 consecutive admissions to the Geisinger Medical Center Chest Pain Decision Unit who underwent technically adequate posteroanterior and lateral view CXR, transthoracic echocardiography, and CCT during the same short stay (23-hour observation). They also fulfilled the following criteria: had normal cardiac size and function and no pericardial effusion by transthoracic echocardiography, had no pulmonary disease by CXR or CCT, and had high-quality, digitally acquired, and stored studies for review. Clinical information was available for all patients through the medical center’s electronic health record system.
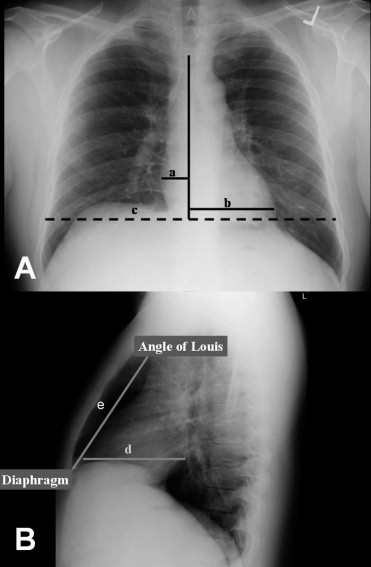
Posteroanterior and lateral CXRs were obtained using standard radiographic techniques with a patient positioned upright and at a distance of 6 feet from the camera. All CXRs were stored digitally and selected measurements including cardiothoracic ratio (CTR), transverse diameter, lateral horizontal transverse diameter, and percent retrosternal air space obliteration were made offline ( Figure 1 ). Potential retrosternal air space was defined as the distance from the angle of Louis to the sternal-diaphragmatic angle on the lateral film. The following values were considered normal CXR measurements: <50% for CTR, ≤14.5 cm for transverse diameter, ≤11.6 cm for horizontal transverse diameter, and ≤33% for retrosternal air space obliteration. All measurements were obtained independently of the results of other diagnostic studies.
Complete transthoracic 2-dimensional echocardiographic (in fundamental and harmonic modes) and Doppler ultrasound examinations at rest were performed using a broadband (S 3 ) transducer attached to an iE33 ultrasound system (Phillips Ultrasound, Andover, Massachusetts). Images were obtained and stored digitally. Parameters used for assessment of chamber sizes included 2-dimensional measurements of ventricular septal thickness, left ventricular internal dimension, and left ventricular posterior (inferolateral) wall thickness in diastole and left ventricular internal dimension in systole and left atrial anteroposterior diameter in the parasternal long-axis view. In addition, left atrial surface area and left ventricular end-diastolic and end-systolic volumes were measured in the apical 4-chamber view. Left ventricular mass was calculated by the standard cube formula and was indexed to body surface area. All echocardiographic measurements were made offline using a workstation by an expert blinded to the CXR and cardiac computed tomographic findings.
All patients were in sinus rhythm at the cardiac computed tomographic study that included calcium scoring and gated contrast coronary angiography using a 64-slice scanner (General Electric, Minneapolis, Minnesota). A steady heart rate <60 beats/min was achieved using β-blocking agents if necessary. Scanning started superiorly at the level of carina and extended 10 mm beyond the left ventricular apex. A semiautomated volumetric method was developed for quantification of EAT as previously described. Briefly, using 2.5-mm-thick axial slices that were used for calcium scoring, the parietal pericardium was traced manually in every fourth slice starting from the aortic root to the apex. The number of slices that had to be traced manually ranged from 7 to 10 in each patient. The computer software then automatically interpolated and traced the parietal pericardium in all slices interposed between the manually traced slices. Total number of slices traced manually or automatically ranged from 28 to 40 in each patient. Two histograms were then generated to depict total cardiac and EAT volumes. Fat voxels were identified by threshold attenuation values from −30 to −250 HU. Intraobserver and interobserver variabilities for quantification of EAT volume were <5%.
Results from normally distributed continuous data are presented as range (mean ± SD) and categorical data as number (percentage). Categorical data were analyzed by chi-square test and normally distributed continuous data by Student’s t test. The relation between the known clinical, electrocardiographic, and CXR variables and EAT volume was examined using the Spearman correlation. Univariate regression analysis was used to identify predictors of cardiomegaly by CXR. Significant differences were defined as p values <0.05. The study was reviewed and approved by the Geisinger Medical Center institutional research review board.
Results
The age ranged of the 112 patients was 26 to 79 years (mean 52 ± 13) and 59 were women (53%). Average body weight, height, and body mass index were 93 ± 21 kg, 170 ± 10 cm, and 32 ± 8 kg/m 2 , respectively. Diabetes mellitus, hypertension, and hypercholesterolemia were present in 15 (13%), 60 (54%), and 55 (49%), respectively, and 22 (20%) were smokers.
CTR ranged from 36% to 70% (mean 50 ± 7) and exceeded the upper normal limit in 22 patients (20%). Corresponding numbers for transverse and lateral horizontal transverse diameters were 10.3 to 21.2 cm (15.2 ± 2.3, 64 abnormal, 57%) and 7.6 to 18.3 cm (12.1 ± 1.9, 62 abnormal, 55%), respectively. Degree of retrosternal air space obliteration by cardiac shadow averaged 44.4% (first tertile 36.5, third tertile 58.5).
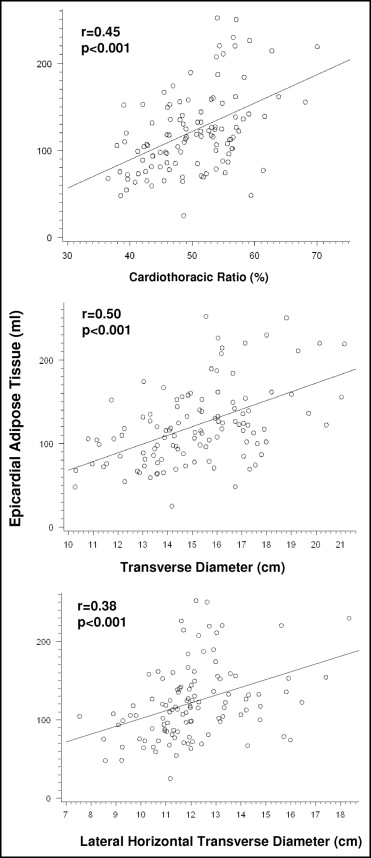
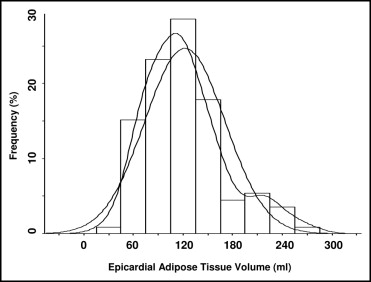
As measured on cardiac computed tomogram, EAT volume ranged from 25 to 274 ml (mean 122 ± 49). Distribution of EAT volume in the 112 patients is shown in Figure 2 . Compared to 90 patients with normal CTR, the 22 patients with increased CTR were older and more often had diabetes, hypertension, hyperlipidemia, and obstructive coronary artery disease (p <0.05 for all comparisons; Table 1 ). In addition, coronary calcium score and EAT volume were significantly increased in those with than without increased CTR ( Table 1 ). There was no significant correlation between EAT volume and percent retrosternal air space obliteration by cardiovascular shadow. Table 2 lists univariate correlates of EAT volume. Overall, EAT volume directly correlated with age (r = 0.27, p = 0.004), body mass index (r = 0.37, p = 0.0001), and coronary calcium score (r = 0.29, p = 0.002). EAT volume also directly correlated with CXR measurements of cardiac size.
| Normal CTR | Increased CTR | p Value | |
|---|---|---|---|
| (n = 90) | (n = 22) | ||
| Age (years) | 50 ± 12 | 58 ± 13 | 0.009 |
| Body mass index (kg/m 2 ) | 32.0 ± 8.0 | 32.7 ± 8.0 | 0.7 |
| Diabetes mellitus | 8 (9%) | 7 (32%) | 0.03 |
| Hypertension ⁎ | 41 (46%) | 19 (86%) | 0.001 |
| Hyperlipidemia † | 40 (44%) | 15 (68%) | 0.04 |
| Obstructive coronary artery disease | 10 (11%) | 7 (32%) | 0.04 |
| Coronary artery calcium score | 0 (0, 55) | 56 (0, 298) | 0.006 |
| Sum of 12-lead electrocardiographic QRS voltage (mm) | 128 (111, 138) | 124 (101, 141) | 0.6 |
| Epicardial adipose tissue volume (ml) | 115 ± 44 | 154 ± 54 | 0.0005 |
⁎ Blood pressure at rest >140/90 mm Hg or on medical therapy for hypertension.
† Total cholesterol >200 mg/dl or on medical therapy for hypercholesterolemia.
| Variable | Correlation Coefficient (r) | p Value |
|---|---|---|
| Age (years) | 0.27 | 0.004 |
| Body mass index (kg/m 2 ) | 0.37 | 0.0001 |
| Chest x-ray measurements | ||
| Transverse diameter (cm) | 0.50 | <0.001 |
| Cardiothoracic ratio (%) | 0.45 | <0.001 |
| Lateral horizontal transverse diameter (cm) | 0.38 | <0.001 |
| Retrosternal air space obliteration (%) | 0.14 | 0.1 |
| Coronary artery calcium score | 0.29 | 0.002 |
| Sum of 12-lead electrocardiographic QRS voltage (mm) | −0.10 | 0.3 |
Correlation between EAT volume and cardiac size on CXR was found to be linear and predictable, as shown in Figure 3 . On average, an increase of 1% in CTR or 1 mm in transverse diameter or lateral horizontal transverse diameter was associated with an increase in EAT volume of 1.8, 6.5, and 7 ml, respectively ( Table 3 ). EAT volume was directly proportional to the number of CXR criteria for cardiomegaly (0 = 90 ± 29 ml, 1 = 110 ± 32 ml, 2 = 136 ± 50 ml, 3 = 174 ± 50 ml, p <0.001), as illustrated in Figure 4 .