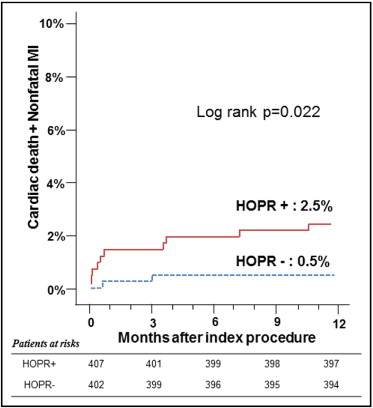
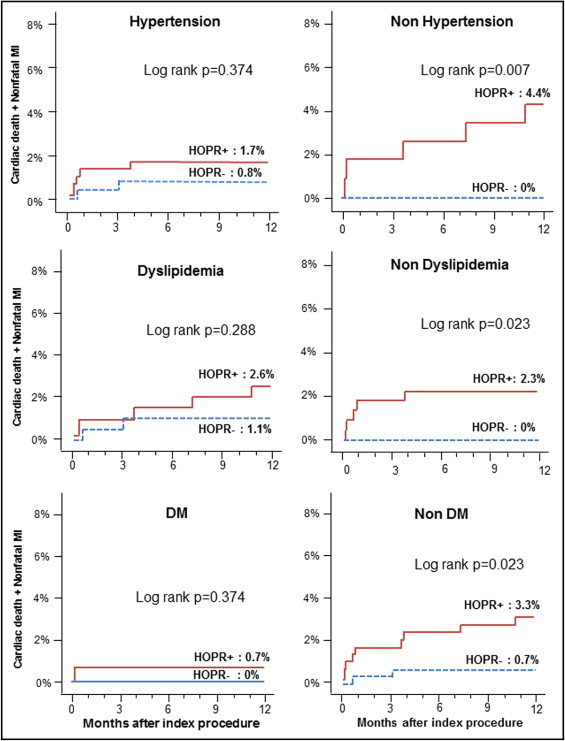
Platelet reactivity after clopidogrel therapy varies among patients. Whether clopidogrel response variability can predict clinical outcomes has not been verified in Asians. A prospective cohort was analyzed to evaluate clinical impact of clopidogrel response variability in patients who underwent elective percutaneous coronary intervention (PCI). A total of 809 consecutive patients receiving clopidogrel after elective PCI were followed for 1 year. On-treatment platelet reactivity (OPR) after clopidogrel therapy was measured with a point-of-care test, the VerifyNow P2Y12 assay. The primary end point was the composite of cardiac death and nonfatal myocardial infarction (MI) at 1 year. In this exclusively Korean cohort, the median OPR was 236 P2Y12 reactivity units. Using the definition of OPR ≥235 P2Y12 reactivity units as high OPR (HOPR), 50.3% of the cohort showed HOPR. The group with HOPR had significantly higher rates of cardiac death and spontaneous MI (2.5% vs 0.5%, p = 0.022) than the group without HOPR. Multivariate-adjusted analysis showed that HOPR was an independent predictor of the composite of cardiac death and nonfatal MI. The difference in major adverse cardiac events between the groups with and without HOPR was more profound in those without major cardiovascular disease, such as hypertension, diabetes mellitus, or dyslipidemia. In conclusion, HOPR to clopidogrel was significantly associated with cardiac death and spontaneous MI after elective PCI, suggesting that clopidogrel response variability may be a significant risk factor of hard end points in Koreans.
It is well known that interindividual variability exists in response to clopidogrel. Because clopidogrel is a prodrug that needs to be metabolized by the cytochrome P450 system for transformation to its active form, a variety of environmental and genetic factors have been reported by our group and others to affect individual response to clopidogrel. Previous reports have shown that response to clopidogrel may predict outcomes after percutaneous coronary intervention (PCI). However, these studies were all performed in Western populations, and therefore, the relation between clopidogrel response variability and outcomes needs to be confirmed in Asian populations, given that ethnic differences have been reported.
Methods
The Measuring Clopidogrel Resistance to Assure Safety After Percutaneous Coronary Intervention Using VerifyNow (CROSS-VERIFY) study was a prospective cohort including all patients that agreed to measurement of clopidogrel responsiveness with the VerifyNow P2Y12 assay (Accumetrics, Inc., San Diego, California) after clopidogrel therapy at Seoul National University Hospital (Seoul, Korea). The inclusion criteria for the present analysis were elective PCI with stent implantation for native coronary artery stenosis. Exclusion criteria included urgent, emergent, or primary PCI; diagnosis of acute myocardial infarction (MI); cardiac enzyme elevation before coronary angiography; the use of glycoprotein IIb/IIIa inhibitors; uncontrolled malignant disease; bleeding tendency; contraindication to aspirin or clopidogrel; planned elective surgery within the next 6 months; and patient refusal. This protocol was approved by the local institutional review board and was in accordance with the Declaration of Helsinki. All patients gave written informed consent to be included in the cohort.
Coronary angiography and PCI were performed according to current standard guidelines. Patients were premedicated with aspirin and clopidogrel before stenting. Those who had been taking clopidogrel for >7 days underwent PCI without loading doses. Loading doses of clopidogrel 300 mg were administered in patients who had been taking clopidogrel for <7 days. Patients who were expected to undergo PCI in <6 hours were given loading doses of 600 mg. Dual-antiplatelet therapy (aspirin 100 mg/day and clopidogrel 75 mg/day) was continued for ≥6 months after PCI. Physicians were blinded to the results of the platelet function test, and all patients were treated with best medical therapy.
On-treatment platelet reactivity (OPR) to clopidogrel was measured using the VerifyNow P2Y12 assay. Technical details and reliability of the test have been reported previously. The VerifyNow P2Y12 assay reports results as P2Y12 reactivity units (PRU), percentage inhibition, and BASE. Percentage inhibition of the P2Y12 receptor is calculated as (1 − [PRU/BASE]) × 100. The coefficient of variation for the test was 7.5% at our institution. The definition of high OPR (HOPR) was ≥235 PRU, which was proposed in several previous studies to detect clopidogrel hyporesponsiveness.
The primary end point of the study was major adverse cardiac events (MACEs), defined as the composite of cardiac death and nonfatal spontaneous MI, at 1 year. Secondary end points included stent thrombosis (ST), periprocedural MI, and target vessel revascularization. Clinical end point definitions followed the Academic Research Consortium consensus and the universal definition of MI. We segregated periprocedural MI from the definition of MI and analyzed them separately, because there is still controversy over the clinical significance of periprocedural cardiac enzyme elevation immediately after PCI. Target vessel revascularization was defined as any repeat percutaneous intervention or surgical bypass of any segment of the target vessel, and periprocedural MI was defined by cardiac enzyme (creatine kinase-MB or troponin I) elevation >3 times the 99th percentile upper limit, which was checked at 6, 12, and 24 hours after PCI.
Power calculations showed that ≥800 patients would need to be enrolled to have >80% power to detect differences in the 2 primary end points. The assumption was 5% and 1% cumulative incidence of MACEs and ST, respectively, at 1 year and the proportion of the HOPR group to be 25% of the total study population. The incidence of MACEs in patients with elective PCI was estimated on the basis of the Clinical Outcomes Utilizing Revascularization and Aggressive Drug Evaluation (COURAGE) trial, in which patients with stable coronary disease were enrolled. The estimation of the incidence of ST was conservative under the consideration that its incidence is reported to be lower in Asians than in Caucasians. Given the odds ratio of 3.0 for risk for MACEs, this analysis would have 88% power with a 5% significance level. ST was defined as definite or probable ST according to the level of certainty according to Academic Research Consortium consensus. Assuming the odds ratio of ST in HOPR group to be 8.0, statistical power to reject the null hypothesis was 83% with a 5% significance level.
Clinical follow-up information was collected by independent research nurses. Clinical events of interest were adjudicated by 2 independent physicians. The final vital status of every patient was confirmed by the National Statistical Office using a unique personal identification number.
Variables are presented as frequencies, mean ± SDs, or medians with interquartile ranges. Continuous variables were compared using Student’s t tests, and categorical variables were compared using chi-square tests. A receiver-operator characteristic curve was used to determine the function of the VerifyNow P2Y12 assay to predict cardiovascular events after PCI. Survival data were analyzed using the Kaplan-Meier method, and statistical significance was assessed using the log-rank test. We performed multiple adjusted analyses, including multivariate-adjusted, propensity score–adjusted, and inverse probability–weighted analyses, to adjust for possible confounding effects of baseline characteristics, laboratory findings, and concomitant medications on VerifyNow P2Y12 measurements (detailed in the Supplementary File ). Two-sided p values <0.05 were considered significant for all tests. All statistical analyses were performed using SPSS version 17.0 (SPSS, Inc., Chicago, Illinois).
Results
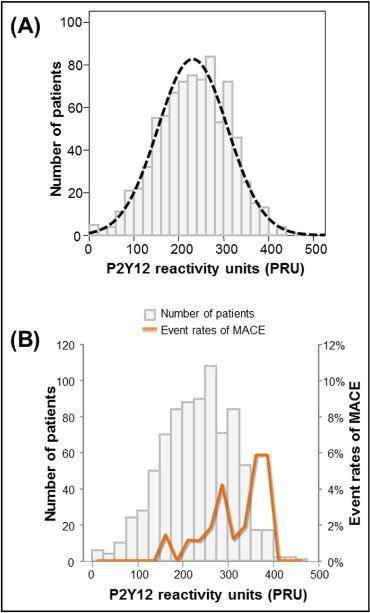
From June 2006 to July 2008, a total of 816 patients matching the inclusion and exclusion criteria were enrolled in the study. Of these patients, 809 (99.1%) completed 1-year clinical follow-up ( Supplementary Figure 1 ) . The vital status of patients who were lost to follow-up was confirmed by the data from the National Statistical Office. Baseline clinical characteristics, angiographic data, and concomitant medications are summarized in Table 1 . As shown in Figure 1 , OPR was normally distributed, with a median value of 236 PRU (interquartile range 177 to 290).
| Variable | No HOPR ⁎ | HOPR ⁎ | p Value |
|---|---|---|---|
| (n = 402) | (n = 407) | ||
| Age (years) | 62.0 ± 9.5 | 65.8 ± 8.3 | 0.003 |
| Men | 299 (74.4%) | 242 (59.5%) | <0.001 |
| Clinical diagnosis: stable angina pectoris | 250 (62.2%) | 267 (65.6%) | 0.174 |
| Body mass index (kg/m 2 ) | 24.7 ± 3.3 | 25.0 ± 3.3 | 0.452 |
| Hypertension † | 243 (60.4%) | 294 (72.2%) | <0.001 |
| Diabetes mellitus † | 109 (27.1%) | 138 (33.9%) | 0.022 |
| Dyslipidemia † | 179 (44.5%) | 189 (46.4%) | 0.317 |
| Current smoker | 80 (19.9%) | 63 (15.5%) | 0.060 |
| Chronic kidney disease | 4 (1.0%) | 8 (2.0%) | 0.198 |
| Previous MI | 31 (7.7%) | 28 (6.9%) | 0.375 |
| History of cerebrovascular accidents | 25 (6.2%) | 24 (5.3%) | 0.482 |
| Peripheral vascular disease | 4 (1.0%) | 8 (2.0%) | 0.198 |
| Hemoglobin (g/dl) | 13.8 ± 1.6 | 13.1 ± 1.4 | 0.080 |
| Platelet count (×10 3 /μl) | 222.3 ± 61.0 | 222.0 ± 58.0 | 0.630 |
| Total cholesterol (mg/dl) | 162.3 ± 41.5 | 160.0 ± 38.3 | 0.035 |
| Triglyceride (mg/dl) | 146.3 ± 83.7 | 139.3 ± 86.8 | 0.467 |
| High-density lipoprotein cholesterol (mg/dl) | 42.3 ± 9.8 | 43.5 ± 11.2 | 0.044 |
| Low-density lipoprotein cholesterol (mg/dl) | 95.4 ± 35.5 | 93.8 ± 33.2 | 0.475 |
| Serum creatinine (mg/dl) | 1.1 ± 0.4 | 1.1 ± 0.3 | 0.803 |
| C-reactive protein (mg/dl) | 0.4 ± 1.5 | 0.4 ± 0.9 | 0.183 |
| Left ventricular ejection fraction (%) | 60.6 ± 8.6 | 60.8 ± 8.8 | 0.696 |
| Number of coronary arteries involved | |||
| 1 | 141 (35.1%) | 144 (35.4%) | 0.493 |
| 2 | 131 (32.6%) | 133 (32.7%) | 0.519 |
| 3 | 130 (32.3%) | 130 (31.9%) | 0.482 |
| Target coronary artery | |||
| Left anterior descending | 209 (52.0%) | 199 (48.9%) | 0.209 |
| Left circumflex | 69 (17.2%) | 75 (18.4%) | 0.353 |
| Right coronary | 99 (24.6%) | 106 (26.0%) | 0.351 |
| Left main | 25 (6.2%) | 27 (6.6%) | 0.461 |
| Drug-eluting stent implantation | 395 (98.3%) | 398 (97.8%) | 0.411 |
| Number of implanted stents | 1.8 ± 1.1 | 1.7 ± 1.1 | 0.353 |
| Maximal stent diameter (mm) | 3.4 ± 2.3 | 3.3 ± 1.4 | 0.126 |
| Total stent length (mm) | 46.3 ± 37.0 | 42.6 ± 31.6 | 0.318 |
| Medications | |||
| Calcium-channel blockers | 93 (23.1%) | 124 (30.5%) | 0.011 |
| β blockers | 187 (46.5%) | 167 (41.0%) | 0.670 |
| Angiotensin-converting enzyme inhibitors | 45 (11.2%) | 37 (9.1%) | 0.191 |
| Angiotensin receptor blockers | 72 (17.9%) | 93 (22.9%) | 0.049 |
| Lipophilic statins | 107 (26.6%) | 86 (21.1%) | 0.040 |
| Hydrophilic statins | 65 (16.2%) | 46 (11.3%) | 0.028 |
| Oral hypoglycemic agents | 51 (12.7%) | 61 (15.0%) | 0.199 |
| Cilostazol | 102 (25.4%) | 108 (26.5%) | 0.327 |
| Proton pump inhibitors | 7 (1.7%) | 7 (1.7%) | 0.596 |
| Nitrates | 64 (15.9%) | 76 (18.7%) | 0.173 |
| Nonsteroidal anti-inflammatory drugs | 9 (2.2%) | 11 (2.7%) | 0.422 |
⁎ HOPR was defined as OPR greater than the optimal cut-off value of 235 PRU.
† Hypertension, diabetes mellitus, and dyslipidemia represented patients who were diagnosed and taking medications or newly diagnosed patients during admission for PCI. Hypertension was defined as blood pressure at rest ≥140/90 mm Hg and diabetes mellitus as fasting blood glucose ≥126 mg/dl. Dyslipidemia was defined as a range of disorders that included abnormal lipid and lipoprotein levels (triglyceride ≥150 mg/dl, low-density lipoprotein ≥130 mg/dl, or high-density lipoprotein < 40 mg/dl).
The cumulative incidence of MACEs, defined as the composite of cardiac death and nonfatal spontaneous MI, was 1.4% at 1 year (cardiac death 0.6%, and nonfatal MI 0.9%). ST occurred in 7 patients (0.9%); 4 cases were definite and the other 3 were probable according to the Academic Research Consortium consensus. Classified by the timing of onset, 6 cases were subacute (within 30 days), and 1 was late ST.
The incidence of MACEs at 1 year had a linear relation with OPR ( Figure 1 ): as OPR increased by 10 PRU, the odds ratio increased by 9% (95% confidence interval 1.01 to 1.18, p = 0.035). Using a definition of OPR ≥235 PRU as the cut-off value for HOPR, 50.3% of patients (407 of 809) could be classified as having HPR in our population. The MACE rate was significantly higher in the group with HOPR than in the group without HOPR ( Figure 2 ) . Although the trend of increase in MACEs in those with HOPR was universal, the difference in MACEs between the 2 groups was more profound in those without major cardiovascular disease, such as hypertension, diabetes mellitus, or dyslipidemia. In those with these risk factors, the group with HOPR showed numerically higher rates of MACEs compared to the group without HOPR, but the difference did not reach statistical significance ( Figure 3 ) .
As for secondary end points, there was a trend toward a higher rate of ST in the HOPR group, but this was not statistically significant (p = 0.060). The incidences of repeat revascularization and periprocedural MI were similar between the groups with and without HOPR (p = 0.861 and p = 0.435, respectively; Supplementary Figure 2 ). Next, the patients were analyzed according to the loading dose or time of clopidogrel. Those loaded with clopidogrel 600 mg showed a trend toward lower OPR compared to chronic users or those loaded with 300 mg, but the clinical outcomes were similar among the 3 groups ( Supplementary Figure 3 ). OPR and clinical outcomes were all similar regardless of the timing of PCI after clopidogrel loading ( Supplementary Figure 4 ) .
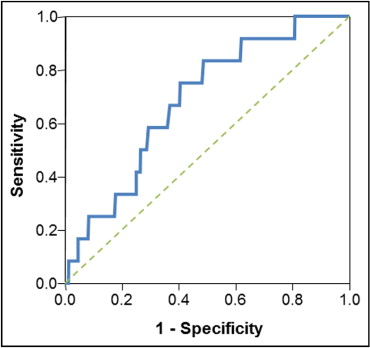
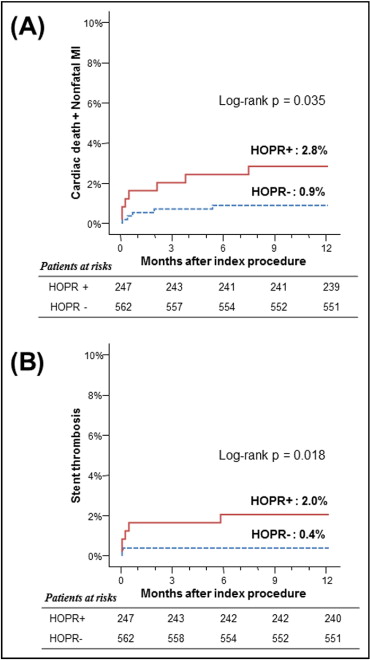
Figure 4 shows the receiver-operating characteristic curve for platelet reactivity versus MACEs. The analysis yielded a cut-off value of 275 PRU to discriminate hard end points, with sensitivity of 58.3% and specificity of 70.6% and an area under the curve of 0.68 (95% confidence interval 0.55 to 0.81, p = 0.029). Incorporating this definition as HOPR, 30.5% of patients (247 of 562) could be classified as having HOPR. This cut-off point was significantly associated with a greater risk for MACEs and ST ( Figure 5 , Table 2 ). In addition to OPR, the change in platelet reactivity in response to clopidogrel (platelet response measured as P2Y12 percentage inhibition) could also be used to predict clinical outcomes. The area under the receiver-operating characteristic curve of platelet response and MACEs was 0.68 (95% confidence interval 0.57 to 0.78, p = 0.034). Using the definition of <5% inhibition of platelet response after clopidogrel treatment as hyporesponsiveness, 195 subjects (24.1%) could be categorized as hyporesponders. The cumulative MACE and ST rates at 1 year were 3.1% versus 1.0% (p = 0.035) and 2.6% versus 0.3% (p = 0.003), for hyporesponders versus responders, respectively ( Supplementary Figure 5 ).
| Clinical Event | No HOPR ⁎ | HOPR ⁎ | p Value † |
|---|---|---|---|
| (n = 562) | (n = 247) | ||
| Primary end points | |||
| MACEs | 0.9% (5) | 2.8% (7) | 0.035 |
| Cardiac death | 0.5% (3) | 1.2% (3) | 0.299 |
| Nonfatal MI | 0.5% (3) | 1.6% (4) | 0.124 |
| ST | 0.4% (2) | 2.0% (5) | 0.018 |
| Definite ST | 0.4% (2) | 0.8% (2) | 0.395 |
| Probable ST | 0.0% (0) | 1.2% (3) | 0.009 |
| Secondary end points | |||
| Target vessel revascularization | 11.2% (63) | 13.8% (34) | 0.315 |
| Periprocedural MI | 14.2% (80) | 17.0% (42) | 0.311 ‡ |
Stay updated, free articles. Join our Telegram channel

Full access? Get Clinical Tree


