Epicardial fat volume (EFV) quantified on noncontrast cardiac computed tomography relates to cardiovascular prognosis. We sought to define the upper normal limit of body surface area (BSA)-indexed EFV (EFVi) in a healthy population and to validate it as a predictor of major adverse cardiovascular events (MACE). We analyzed noncontrast cardiac computed tomography scans of 226 healthy subjects with a low Framingham Risk Score (FRS; ≤6%) performed for coronary calcium scoring (CCS). EFV was quantified using validated software and indexed to BSA. We defined the 95th percentile as the upper normal limit. Subsequently, we reanalyzed a separate cohort of 232 participants from a previously published case–control study with 4-year follow-up and 58 cases of MACE to test the additive value of an abnormally high EFVi for predicting MACE. Of the 226 healthy participants 51% were men (mean age 52 ± 9 years). EFV correlated to BSA (r = 0.373, p <0.0001). Median, range, and 25th and 75th percentiles of the non-normally distributed EFVi were 33.3, 10.8 to 96.6, and 24.5 and 45.5 cm 3 /m 2 . The 95th percentile definition of the upper normal limit of EFVi was 68.1 cm 3 /m 2 . For prediction of MACE, EFVi values higher than the newly defined threshold emerged as a significant and independent predictor after controlling for confounders (odds ratio 2.8, 95% confidence interval 1.3 to 6.4, p = 0.012) and trended in its additive value to the combination of CCS ≥400 and FRS (area under the receiver operating characteristic curve 0.714 vs 0.675, p = 0.1277). In conclusion, in a healthy population we determined 68.1 cm 3 /m 2 as the 95th percentile threshold for abnormally high EFVi. EFVi exceeding this value independently predicted MACE and trended to add to CCS and FRS in this prediction.
Recently, multiple studies have shown a deleterious relation between epicardial fat burden and coronary atherosclerosis, arrhythmogenesis, and major adverse cardiovascular events (MACE), which generated interest in quantifying epicardial adipose tissue. Previous reports validated echocardiographically measured epicardial fat thickness. More recent reports have used noncontrast-enhanced cardiac computed tomography to measure epicardial fat volume (EFV) and have shown its reproducibility and correlation to coronary artery disease presence, severity, and prognosis. Whether body surface area (BSA)-indexed EFV (EFVi) values predictive of MACE can be identified using healthy population-defined normal limits remains unknown. Therefore, the aim of this study was to determine the upper normal threshold of EFVi on noncontrast-enhanced cardiac computed tomography in a healthy population and to test its ability to predict MACE.
Methods
The derivation cohort consisted of 226 consecutive healthy participants who volunteered to undergo noncontrast-enhanced cardiac computed tomography for coronary calcium scoring as part of the Early Identification of Subclinical Atherosclerosis by Noninvasive Imaging Research (EISNER) cohort. Inclusion criteria included asymptomatic status; no known cardiovascular disease, diabetes mellitus, or smoking; a coronary calcium score (CCS) of 0; low-density lipoprotein levels <160 mg/dl; triglyceride levels <500 mg/dl; and a Framingham Risk Score (FRS) ≤6%. Exclusion criteria were pericardial effusion or thickening and a lower-than-excellent image quality on noncontrast-enhanced cardiac computed tomography. All participants provided written consent according to our institutional review board policy.
Noncontrast-enhanced cardiac computed tomography performed for CCS screening was used to quantify EFV as previously described. Briefly, noncontrast-enhanced cardiac computed tomography was acquired using an electron-beam computed tomography scanner (e-Speed, GE Healthcare, Milwaukee, Wisconsin) or a 4-slice computed tomography scanner (Somatom Volumezoom, Siemens Medical Solutions, Forchheim, Germany). Scan parameters included heart rate–dependent electrocardiographic triggering (typically 45% to 60% of R-R interval), 35-cm field of view, and 512 × 512 matrix size. Tube voltage was 120 kVp. Slice thickness was 2.5 mm. Foci of coronary calcification were identified by an experienced technician using semiautomatic commercial software on a NetraMD workstation (ScImage, Los Altos, California). Using the Agatston method, the software calculated the total CCS. All noncontrast-enhanced cardiac computed tomography images and scoring were reviewed by an expert reader.
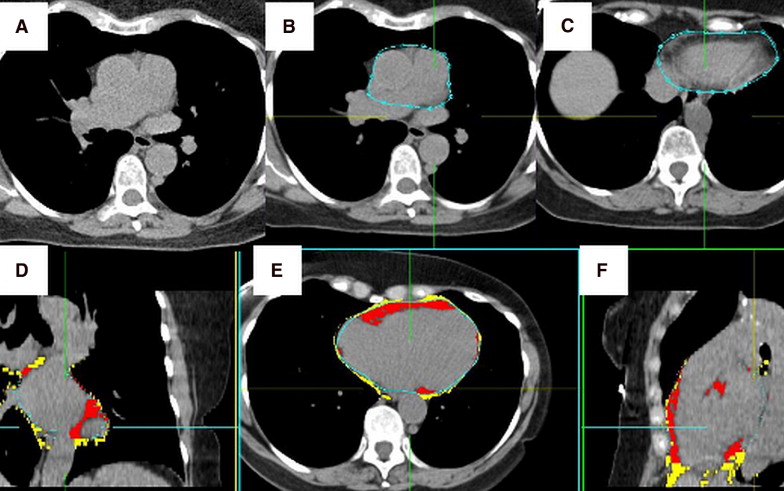
Acquired noncontrast-enhanced cardiac computed tomography images were transferred to a separate workstation. Each noncontrast-enhanced cardiac computed tomography scan was evaluated by a blinded experienced reader who quantified EFV using the validated QFAT software (Cedars-Sinai Medical Center, Los Angeles, California; Figure 1 ). QFAT uses algorithms for automatic thoracic cavity and heart segmentation and quantification of thoracic fat, as previously described. Image data were processed as follows. First, the upper and lower slice limits were manually defined using axial views. The upper slice limit was marked at the bifurcation of the pulmonary artery trunk to its right main pulmonary artery stem, and the lower slice limit was chosen as the last slice containing the posterior descending coronary artery in the inferior atrioventricular groove. Next, the reader defined 5 to 10 control points on the pericardium in sequential axial views and the software automatically generated a smooth closed pericardial contour and calculated EFV. Contiguous 3-dimensional voxels from the limits of −190 to −30 HU were defined as fat voxels. EFV was reported in cubic centimeters and indexed to BSA (EFVi).
To assess the clinical utility of the newly derived upper normal EFVi threshold, we analyzed a separate EISNER population previously published by our group. In this case–control study each of 58 patients with MACE (event group) were matched by propensity scores to 3 same-gender event-free control subjects (control group), generating 232 patients. Briefly, 79% were men, mean age was 61 ± 9 years, and mean FRS was 13 ± 7, without significant differences between the event and control subgroups. This previous work showed that increased EFV (a nonindexed value of 125 cm 3 ) trended to predict MACE at 4 years of follow-up independent of CCS ≥400 and FRS. MACE consisted of cardiovascular death, myocardial infarction, stroke, and percutaneous or surgical coronary artery revascularization. In this cohort we reanalyzed the patients using the newly derived upper normal threshold of EFVi to assess the ability of higher-than-normal EFVi to discriminate between those who developed MACE and those who did not.
Distribution of EFVi in the healthy derivation cohort was found to be non-normal and therefore reported as median with interquartile range, and nonparametric statistical tests were used: Spearman for correlations between EFV and BSA and between EFVi, and age and Mann–Whitney for correlation between EFVi and gender. An abnormally high EFVi was defined as >95th percentile according to the threshold definition recommended for any range of biological values. Mann–Whitney test was used to compare medians of EFVi between the event and control subgroups. Chi-square test was used for analyzing the difference in frequencies of high EFVi between the same subgroups. Odds ratio (OR) and 95% confidence interval (CI) of the newly defined abnormal threshold were calculated for the prediction of MACE after adjusting for CCS ≥400 and FRS using a multivariable logistic regression model. Area under the receiver operating characteristic curve was used to compare prediction of MACE by FRS, CCS ≥400, and abnormally increased EFVi to prediction by FRS and CCS ≥400 alone. FRS was considered a continuous variable. CCS was considered as clinically driven binary variable with a threshold of 400. Increased EFVi was present if EFVi exceeded the 95th percentile calculated in the derivation cohort. We also repeated this analysis to test the 90th percentile as a cutoff and also used absolute rather than EFVi as suggested by Thanassoulis et al. All p values were 2-tailed and considered statistically significant if <0.05.
For quality control each noncontrast-enhanced cardiac computed tomography scan, CCS, and pericardial contour and upper and lower slice limits were rechecked. Cases in which image quality was not excellent and epicardial fat border determination was discrepant between the software and the reader (n = 4) were excluded.
Results
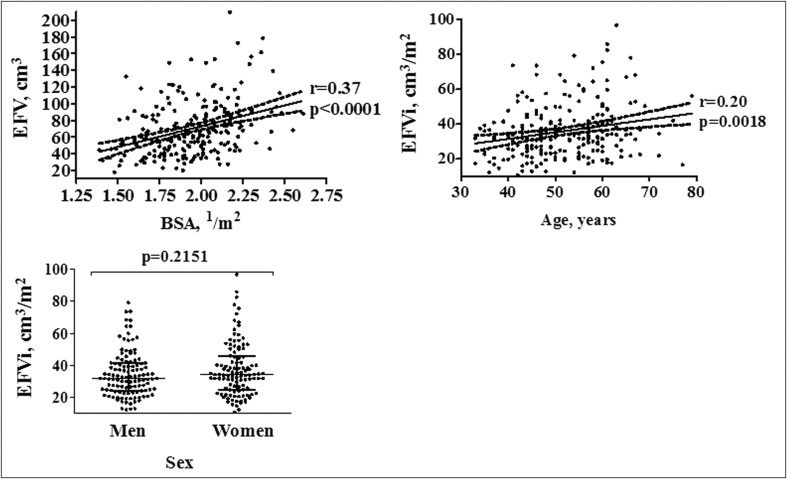
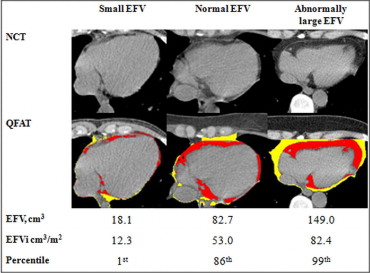
Demographic characteristics of the derivation cohort are presented in Table 1 . Median, range, and 25th and 75th percentiles of EFVi were 33.3, 10.8 to 96.6, and 24.5 and 42.1 cm 3 /m 2 , respectively. EFV correlated modestly to BSA (r = 0.37, p <0.0001). There was no significant difference in median EFVi between men and women (median 31.8 cm 3 , interquartile range 24.2 to 41.3, vs 34.2 cm 3 , 24.8 to 45.5, p = 0.2151). There was a weak correlation between EFVi and age (r = 0.20, p = 0.0018; Figure 2 ). The 95th percentile of EFVi distribution was 68.1 cm 3 /m 2 . Examples of patients with normal and abnormal values of EFVi are shown in Figure 3 .
| Age (years) | 52 ± 9 |
| Men | 116 (51%) |
| Body mass index (kg/m 2 ) | 26.8 ± 4.9 |
| Body surface area (1/m 2 ) | 1.9 ± 0.2 |
| Hypertension | 77 (34.1%) |
| Hyperlipidemia | 60 (26.5%) |
| Diabetes mellitus | 0 (0%) |
| Smoking | 0 (0%) |
| Family history of premature coronary artery disease | 77 (34.1%) |
| Framingham Risk Score, median (range) | 2.0 (0.5–6) |
| Epicardial fat volume (cm 3 ), median (range) | 64.8 (18.1–209.7) |
| Indexed epicardial fat volume (cm 3 /m 2 ), median (range) | 33.3 (10.8–96.6) |
| Indexed epicardial fat volume (cm 3 /m 2 ), 95th percentile | 68.1 |
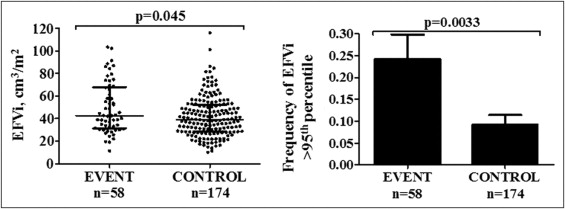
Demographic and risk factor data of the event and control subgroups were previously reported. There were no significant differences in age, CCS, and prevalence of traditional risk factors between subgroups. Patients in the event subgroup had significantly greater median EFVi (median 42.7 cm 3 , range 31.3 to 67.9, vs 39.2 cm 3 , 28.5 to 52.3, p = 0.045) and greater frequencies of abnormally high EFVi (24.1% vs 9.2%, chi-square 10.4, degrees of freedom 1, p = 0.0033; Figure 4 ) than patients in the control subgroup. When repeating this analysis to test the 90th percentile as a cutoff, valued at 57.0 cm 3 , the difference between the frequencies was weaker (32.8% in the event subgroup vs 18.4% in the control subgroup, chi-square 5.2, degrees of freedom 1, p = 0.043). Abnormally high EFVi was significantly associated with MACE (OR 3.1, 95% CI 1.4 to 6.9, p = 0.0033) and remained so after adjustments for CCS ≥400 and FRS (OR 2.8, 95% CI 1.3 to 6.4, p = 0.012).