Cardiac resynchronization therapy (CRT) decreases the morbidity and mortality in patients with end-stage heart failure. However, patient selection remains challenging, because a considerable 30% to 50% do not respond. Controversy exists on the cutoff values for the QRS duration and the optimal lead location. The present study relates these parameters on an individual basis to acute pump function improvement using invasively obtained pressure-volume loops. Fifty-seven patients with symptomatic end-stage heart failure were included in our temporary biventricular stimulation study and were grouped according to the QRS duration (QRS <20 ms, QRS ≥120 ms but <150 ms, and QRS ≥150 ms). All patients underwent pressure-volume loop assessment of the response to biventricular pacing, comparing the baseline measurements to both right ventricular apex pacing combined with a left ventricular lead in the posterolateral and anterolateral region of the LV. Group analysis during conventional (posterolateral and right ventricular apex) CRT did not show improvement in stroke work and dP/dt max (−2%, p = NS; and −7%; p <0.001) in the narrow QRS group but a significant increase in the intermediate (+27%, p = 0.020, and +5%, p = 0.044) and wide (+48%, p = 0.002, and +18%, p <0.001) QRS groups. CRT using the anterolateral and right ventricular apex configuration evoked a consistently lower response compared to posterolateral and right ventricular apex, resulting in a significant hemodynamic deterioration in the narrow QRS group. However, analysis on an individual basis identified 25% of patients with narrow QRS duration showing possible hemodynamic benefit from CRT compared to 83% of patients with intermediate and wide QRS combined. In contrast, 15% of patients had deterioration by conventional (posterolateral right ventricular apex) CRT in the intermediate and wide QRS groups compared to 31% in the narrow QRS group; 19% of patients could be improved by lead placement in the anterolateral rather than the posterolateral region. In conclusion, the acute hemodynamic response to CRT is generally in line with the long-term results from large randomized trials; however, the individual variation is large. The temporary biventricular stimulation protocol might aid in individual patient selection and in research aiming at a reduction of nonresponders and improvement in lead positioning.
Cardiac resynchronization therapy (CRT) is an established treatment option for patients with end-stage heart failure; however, long-term follow-up has shown a considerable nonresponse. The presence of dyssynchrony is generally assumed to be a prerequisite for successful treatment with CRT, which is thought to restore synchronous left ventricular (LV) contraction by pre-excitation of the late activated LV region. Two major issues hamper optimal treatment results: the detection of clinically relevant dyssynchrony and optimal lead placement. Current CRT guidelines use a prolonged QRS duration as the determinant for dyssynchronous contraction, resulting in a good response, especially in the subgroup of patients with a QRS duration of ≥150 ms. However, in patients with a QRS duration <150 ms and even a QRS duration <120 ms, improvement with CRT has also been reported. The assessment of dyssynchrony using echocardiography did not improve the prediction of response in individual patients and could not reliably determine the optimal LV lead location. An invasive assessment of pump function using, for example, LV pressure-volume analysis, has been proposed as a more valuable tool for selecting patients for CRT and selecting the optimal LV stimulation site. This strategy is supported by our recent finding that invasively obtained stroke work (SW) improvement accurately predicts the long-term outcome. The present study was designed to relate the acute hemodynamic response to the QRS duration and LV pacing location using pressure-volume loops in a cohort of CRT candidates.
Methods
The patients were selected from the VU Medical Center Temporary Biventricular Stimulation (TBS) study. The TBS study evaluated the relation between the acute hemodynamic effects of multisite LV and/or right ventricular (RV) temporary pacing and the long-term response to CRT in patients with advanced heart failure. The inclusion criteria were moderate to severe heart failure (New York Heart Association class III or IV), severely depressed LV function (LV ejection fraction ≤35%), sinus rhythm, and ≥3 months of stable optimal tolerated medical therapy (including angiotensin-converting enzyme inhibitors, diuretics, β blockers, and spironolacton). The QRS duration was not an inclusion criterion. The exclusion criteria were myocardial infarction or acute coronary syndrome within 3 months before the study procedure, previous pacemaker implantation, aortic valve stenosis, mechanical aortic valve replacement, and the presence of LV thrombus.
For the present study, the data were extracted from the TBS database of patients who underwent a successful TBS study with pacing leads in the RV apex, the anterolateral region, and the posterolateral region, allowing for biventricular stimulation using both LV posterolateral and RV apex (PLRVA) and LV anterolateral and RV apex (ALRVA) lead combinations. In addition, only patients who underwent magnetic resonance imaging for reliable assessment of the LV volumes were eligible.
The patients were divided into 3 groups according to the QRS duration (narrow, QRS <120 ms; intermediate, QRS ≥120 but <150 ms, and wide, QRS ≥150 ms).
At 2 weeks before device implantation, the patients underwent clinical screening and cardiac magnetic resonance imaging. Subsequently, all patients underwent an invasive temporary pacing procedure. The local research ethics committee approved the conduction of the present study, and all patients provided written informed consent before the study procedures.
The patients underwent imaging using a 1.5 T whole body magnetic resonance imaging scanner (Magnetom Sonata, Siemens, Erlangen, Germany) with a 6-channel phased-array body coil. After the survey scans, a retro-triggered, balanced, steady-state free precession gradient-echo sequence was used for cine imaging. Long-axis cine images were obtained in the 4-, 3-, and 2-chamber views. Subsequently, a cine data set was acquired, planned on a 4-chamber view and perpendicular to the ventricular septum, fully covering the left ventricle. The cine images were acquired during 1 breath hold in mild expiration. For these images, the parameters were as follows: field of view 330 × 270 mm 2 , flip angle 60°, repetition time 3.2 ms, echo time 1.6 ms, receiver bandwidth 930 Hz/pixel, matrix size 256 × 208, slice thickness 5 mm, temporal resolution 35 to 48 ms.
The end-diastolic volume, end-systolic volume, stroke volume, and ejection fraction were derived from the cine images, using dedicated software (MASS Analytical Software, Medis, Leiden, The Netherlands). These absolute cardiac magnetic resonance imaging-derived volumes were used to calibrate the conductance catheter measurements.
The day after the cardiac magnetic resonance imaging session, the patients underwent temporary biventricular stimulation to assess the acute response to CRT. After arrival at the catheterization laboratory, the invasive procedure was performed in patients in an unsedated state and in the supine position. Access was obtained to the right femoral artery and left and right femoral vein, and heparin was administered. An Amplatz-guiding catheter was introduced and positioned in the ostium of the coronary sinus. After visualization of the sinus and its tributaries using balloon occlusive venography, 2 unipolar pacing electrodes (Visionwire, Biotronik, Berlin, Germany) were placed in the epicardial veins in the posterior/posterolateral and anterior/anterolateral regions. Subsequently, bipolar pacing leads (NBIH, 6F, Bard Electrophysiology Department, Lowell, Massachusetts) were placed in the RV apex and in the right atrium, allowing atrial-sensed ventricular pacing. Definitive pacing locations were determined by oblique 2-directional fluoroscopy and scored using a LV segmentation bullseye. Finally, a conductance catheter (CD Leycom, Zoetermeer, The Netherlands) was retrogradely placed in a stable position in the LV apex. The conductance catheter was connected to a Cardiac Function Laboratory (CFL 512, CD-Leycom), enabling on-line measurements of the LV volumes, LV pressures, and electrocardiographic findings. The LV volume and pressure signals were digitized and stored for off-line analysis.
The pacing leads were connected to an external stimulation module, and atrial-sensed ventricular stimulation was performed using the RV apex lead alternately combined with the posterolateral lead (PLRVA) and anterolateral lead (ALRVA). The atrioventricular delay was set to ≤100 ms, ensuring full ventricular capture, and ventricular pacing was performed with a VV interval of 0 ms.
LV pressure-volume loops were recorded during pacing with each lead combination, and baseline (no pacing) measurements were taken before and after each biventricular run. The data were acquired during baseline conditions and 30 seconds after initiating pacing. Approximately 30 representative cardiac cycles were subsequently averaged, disregarding all inappropriate beats (i.e., extrasystoles).
LV function was quantified by assessment of the end-diastolic and end-systolic pressure-volume points, estimated from the pressure-volume loop. From the volume data, the stroke volume, ejection fraction, and cardiac output were calculated. From the pressure registration rate of the systolic and diastolic pressure change (dP/dt max , dP/dt min ) were determined. Stroke work was directly calculated as the surface of the pressure-volume loop, independently from the measured end-diastolic and end-systolic pressure-volume points. Changes by biventricular pacing were calculated relative to the mean of the 2 flanking baselines. From the published data, we assumed that a 10% increase or decrease in SW indicated a significant change.
The commercially available Statistical Package for Social Sciences software (SPSS, Chicago, Illinois) was used for statistical analysis. The numeric values are expressed as the mean ± SD. One-way analysis of variance or the chi-square test was used to compare the groups when appropriate. A paired t test was used to compare the baseline and pacing and different pacing location data. A p value of <0.05 was considered statistically significant.
Results
A total of 57 patients (age 66 ± 10 years, range 40 to 85) with drug-refractory end-stage heart failure resulting from ischemic (n = 36, 63%) and nonischemic (n = 21, 37%) cardiomyopathy were included in the present study. The patients were divided into 3 groups according to the QRS duration: narrow QRS group, QRS <120 ms (n = 16; 28%); intermediate QRS group, QRS ≥120 but <150 ms (n = 14; 25%); and wide QRS group, QRS ≥150 ms (n = 27; 47%). The baseline patient characteristics are listed in Table 1 .
| Parameter | QRS <120 ms (n = 16) | QRS ≥120 but <150 ms (n = 14) | QRS ≥150 ms (n = 27) | p Value |
|---|---|---|---|---|
| Age (years) | 63 ± 8 | 71 ± 8 | 65 ± 10 | NS |
| Men/women | 10/6 | 8/6 | 15/12 | NS |
| Ischemic origin | 14 (88%) | 10 (71%) | 12 (44%) | 0.014 ⁎ |
| New York Heart Association class (3–4) | 16/0 | 14/0 | 26/1 | NS |
| NT-pro-brain natiuretic peptide (nmol) | 4,004 ± 6,243 | 1,766 ± 1,482 | 1,700 ± 1,336 | NS |
| QRS duration (ms) | 98 ± 9 | 131 ± 10 | 169 ± 12 | < 0.001 |
| Medication | ||||
| Diuretics | 14 (88%) | 10 (71%) | 23 (85%) | NS |
| Angiotensin-converting enzyme inhibitors | 15 (94%) | 13 (93%) | 20 (74%) | NS |
| Spironolacton | 9 (56%) | 7 (50%) | 13 (48%) | NS |
| β Blockers | 15 (94%) | 14 (100%) | 20 (74%) | NS |
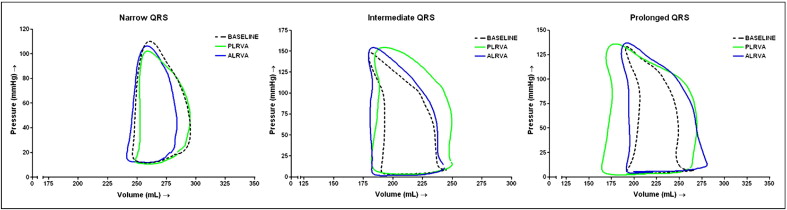
The hemodynamic measurements are listed in Table 2 . The baseline hemodynamic characteristics did not differ among the 3 groups, except for the dP/dt max , which significantly decreased with increasing QRS duration (p = 0.01). Typical examples of pressure-volume loops without pacing and with pacing in PLRVA and ALRVA configurations are displayed in Figure 1 .
| Variable | Groups | ||||||||
|---|---|---|---|---|---|---|---|---|---|
| QRS <120 ms | QRS ≥120 but <150 ms | QRS ≥150 ms | |||||||
| Baseline | PLRVA | ALRVA | Baseline | PLRVA | ALRVA | Baseline | PLRVA | ALRVA | |
| Heart rate (beats/min) | 77 ± 14 | 77 ± 15 | 78 ± 15 | 69 ± 11 | 70 ± 11 | 69 ± 10 | 77 ± 12 | 75 ± 11 † | 76 ± 12 † |
| End-diastolic pressure (mm Hg) | 21 ± 10 | 21 ± 11 | 22 ± 10 | 18 ± 7 | 19 ± 6 | 18 ± 7 | 17 ± 8 | 16 ± 8 | 17 ± 9 |
| End-systolic pressure (mm Hg) | 102 ± 22 | 99 ± 24 ⁎ | 98 ± 23 † | 119 ± 27 | 117 ± 26 | 116 ± 28 | 117 ± 24 | 119 ± 23 | 119 ± 22 |
| End-diastolic volume (ml) | 266 ± 59 | 267 ± 58 | 269 ± 60 | 264 ± 91 | 272 ± 92 ⁎ | 265 ± 87 | 281 ± 83 | 284 ± 79 | 286 ± 79 ⁎ |
| End-systolic volume (ml) | 202 ± 56 | 206 ± 56 ⁎ | 205 ± 54 | 195 ± 86 | 199 ± 86 † | 198 ± 88 | 220 ± 80 | 217 ± 79 | 218 ± 79 |
| Stroke volume (ml) | 64 ± 18 | 62 ± 20 | 64 ± 23 | 69 ± 11 | 73 ± 17 | 67 ± 14 | 61 ± 23 | 67 ± 29 ⁎ | 68 ± 29 † |
| Ejection fraction (%) | 25 ± 8 | 24 ± 8 | 24 ± 8 | 28 ± 8 | 29 ± 9 | 28 ± 10 | 23 ± 9 | 25 ± 10 ⁎ | 25 ± 10 ⁎ |
| Cardiac output (L/min) | 4.9 ± 1.4 | 4.7 ± 1.7 | 5.0 ± 2.0 | 4.8 ± 1.0 | 5.1 ± 1.3 | 4.6 ± 1.1 | 4.6 ± 1.7 | 5.0 ± 1.9 ⁎ | 5.0 ± 2.0 ⁎ |
| Cardiac index (L/min/m 2 ) | 2.4 ± 0.7 | 2.3 ± 0.8 | 2.4 ± 0.9 | 2.5 ± 0.5 | 2.7 ± 0.7 | 2.4 ± 0.6 | 2.3 ± 0.8 | 2.5 ± 0.9 ⁎ | 2.5 ± 1.0 ⁎ |
| Stroke work (ml·mm Hg) | 5.2 ± 2.4 | 5.1 ± 2.2 | 4.4 ± 1.9 ⁎ | 5.3 ± 1.4 | 6.7 ± 2.2 ⁎ | 5.6 ± 1.6 | 4.9 ± 2.7 | 6.8 ± 3.9 † | 6.6 ± 3.5 ⁎ |
| dP/dt max (mm Hg/s) | 1,046 ± 356 | 977 ± 375 ‡ | 919 ± 339 ‡ | 946 ± 190 | 986 ± 195 ⁎ | 932 ± 180 | 865 ± 206 | 1,009 ± 243 ‡ | 930 ± 216 ‡ |
| dP/dt min (mm Hg/s) | −960 ± 190 | −895 ± 218 ‡ | −850 ± 216 ‡ | −1,027 ± 214 | −1,071 ± 229 ⁎ | −1,011 ± 207 | −867 ± 410 | −1,029 ± 493 ‡ | −939 ± 432 ‡ |