Cerebral Arteries and Veins
Stephan G. Wetzel
In 1927, about 30 years after Conrad Wilhelm Roentgen’s detection of x-rays, Egas Moniz of Portugal performed the first cerebral arteriogram in a human by direct puncture of the carotid artery. Since then, conventional angiographic technique has been continuously refined to reduce the risk of the procedure and to increase the diagnostic yield. Major technical developments along the way included a technique to facilitate percutaneous access, the Seldinger technique in 1953, the development of digital subtraction angiography (DSA) by C. A. Mistretta in 1973, improvements of contrast agents and catheters, and more recently, the introduction of rotational acquisitions that have made three-dimensional (3D) DSA imaging possible. For half a century, conventional angiography was the method for imaging of the cerebral vasculature.
In the early 1970s, Godfrey N. Hounsfield introduced “computer tomography” (CT), and Paul Lauterbur laid the foundation for magnetic resonance imaging (MRI). These cross-sectional imaging techniques revolutionized diagnostic strategies in clinical neurology and neurosurgery. Refinements in the technique soon allowed not only detection of parenchymal brain disease (e.g., tumors) or sequela of vascular disease (e.g., bleedings and infarcts) but dedicated assessment of the cerebral vasculature as well.
The non- or minimally invasive nature of these techniques, combined with the ability to obtain information about the brain parenchyma within the same examination, represent clear advantages of CT angiography (CTA) and MR angiography (MRA) compared with all other imaging techniques. Continuing developments in the field of CT (e.g., advanced multidetector techniques) as well as MR (e.g., parallel imaging techniques and high field imaging) steadily enable improved assessment of the cerebral arteries and veins. The trend toward greater diagnostic accuracy of these techniques has led to expanded clinical indications. CTA, for example, is beginning to challenge the role of DSA for search of aneurysms in patients presenting with subarachnoid hemorrhage.
Based on these encouraging developments, one would assume that CTA and MRA, by replacing established imaging techniques such as conventional angiography, would lead to a decline in the use of these modalities. Interestingly, an analysis of trends in neuroimaging based on U.S. nationwide Medicare data revealed that the use of conventional angiography increased by almost 25% between 1993 and 1998 (1). While a thorough discussion about the merits, pitfalls, and implications of these data is beyond the scope of this text, it is plausible to consider that a limited understanding of
the techniques and advantages inherent to CTA and MRA may substantially contribute. Supporting this assumption is the fact that conventional angiography has had the highest geographic variation in the use of all diagnostic neuroimaging procedures, and MRA has had the highest of the noninvasive cross-sectional techniques.
the techniques and advantages inherent to CTA and MRA may substantially contribute. Supporting this assumption is the fact that conventional angiography has had the highest geographic variation in the use of all diagnostic neuroimaging procedures, and MRA has had the highest of the noninvasive cross-sectional techniques.
For CTA and MRA of the cerebral vasculature to replace DSA, the essential information to make a diagnosis and to establish a treatment plan must be obtainable in a reliable and reproducible manner. Apart from clinical and technical knowledge, dedication to analyzing the images is required to achieve this goal. Despite advances in postprocessing, a rigorous and sometimes tedious analysis of source images or of tailored targeted views is often necessary to provide the diagnostic information. An analysis of CTA images in the search for an aneurysm is often more time consuming than the analysis of the images from conventional angiography.
Because CTA and MRA should be considered as methods that can replace conventional angiography for many indications, knowledge of the specific imaging properties of DSA is required. This and the indications and limitations of ultrasonography, the other important noninvasive imaging technique, are outlined here.
DSA is still considered to be the standard of reference for the depiction of the cerebral vasculature and for most vascular pathology. The main advantages of the technique compared with CTA and MRA are the unsurpassed spatial and temporal resolution, and the ability to selectively view vessels.
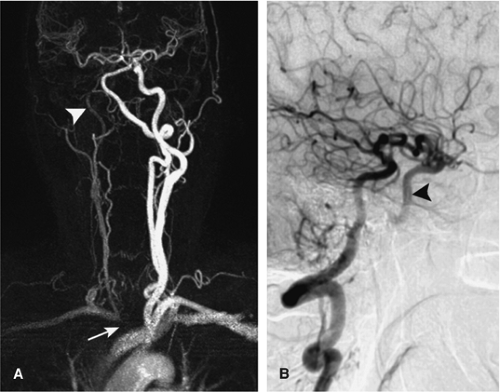 Figure 11-1 A: CE MRA MIP image of the cervicocranial vessels. Occlusion of the brachiocephalic trunk (arrow), the right ICA is poorly delineated (arrowhead), the left VA is enlarged. B: DSA, injection into the left VA shows cross flow via the PCoA into the distal ICA (arrowhead). |
The spatial resolution with matrix sizes of 1024 ÷ 1024 available on most modern DSA units allows an excellent assessment of the morphological changes of the small intracranial vessels and an anatomic display of arteries that cannot be visualized with even the most advanced CTA or MRA techniques. An example of the latter is the perforating arteries, which are crucial to visualize in the treatment planning of some aneurysms.
The high temporal resolution of DSA together with selective injections into the cervical or cerebral vessels provides the possibility to qualitatively assess cerebral hemodynamics. Such a capacity is used to characterize high-flow arteriovenous malformations with great detail and enables the demonstration of collateralization patterns in steno-occlusive disease (Fig. 11-1).
On the other hand, DSA has definite limitations in that it is time consuming, expensive, and requires exposure to radiation. Moreover, DSA is associated with definable risks. Transient neurological complications occur with selective catheter angiography in approximately 1% of patients, and the risk for permanent neurological deficit is about 0.3%. These complication risks are higher for the subgroup of patients with transient ischemic attacks or stroke, demonstrating transit deficits in 3% and permanent deficits in 0.7% when used as a purely diagnostic tool (2).
As a 2D projectional technique, the DSA assessment is restricted to the intraluminal part of the vessel, which is a further disadvantage of the technique. With DSA, unlike CTA
or MRA, vessel wall pathology, such as mural pathology or thrombus formation, cannot be directly assessed. As well, numerous views with repeated injections of contrast material from different angles are often necessary to obtain the desired display of the vessels. This has been overcome on modern DSA units with the use of rotational acquisitions and 3D reconstructions.
or MRA, vessel wall pathology, such as mural pathology or thrombus formation, cannot be directly assessed. As well, numerous views with repeated injections of contrast material from different angles are often necessary to obtain the desired display of the vessels. This has been overcome on modern DSA units with the use of rotational acquisitions and 3D reconstructions.
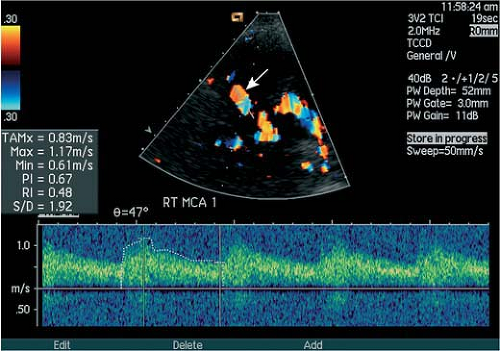 Figure 11-2 TCD of the right MCA. The Doppler probe (arrow) reveals a poststenotic flow pattern. |
Finally, forced arterial injections are required with DSA to obtain the angiographic effect, thus altering hemodynamics. In contrast, flow dynamics visualized with MRA techniques are based on innate flow effects.
Ultrasonographic techniques provide information on hemodynamics and structural changes of the intracranial vessels. Transcranial Doppler sonography (TCD), introduced in the early 1980s (3), depicts hemodynamic information by measuring the difference in frequency between two successive echos—the Doppler shift—thus indicating the velocity and direction of the moving blood cells. The differentiation between individual vessels can be difficult, however, since this method has no imaging component, and the signal obtained is assigned to a specific vessel on the basis of indirect parameters (depth of the sample volume, position of the transducer, direction of the blood flow).
With transcranial color-coded duplex sonography, a frequency-based 2D color-coded depiction of the anatomical course of cerebral vessels became possible, which enabled a more exact, angle-corrected measurement of blood flow velocities (Fig. 11-2). The subsequent development of ultrasonsographic techniques include power Doppler that depicts the integrated intensity of moving particles and contrast-enhanced (CE) sonographic techniques.
A major advantage of sonography is the ability to detect flow alterations of the major cerebral vessels, including cross-flow patterns through the circle of Willis, with a relatively inexpensive bedside examination. A unique feature of TCD is the ability to detect embolic material traveling within the arteries (4), which seems to be a promising tool to assess pathophysiological factors of cerebral ischemia, and to assess, for example, the effectiveness of antiplatelet agents in the prevention of stroke. Furthermore, the technique can be used to detect cardiac and extracardiac right-to-left shunts by monitoring for intravenously injected microbubbles that normally do not survive the pulmonary passage, thus providing information in the workup of patients with stroke.
The main disadvantages of sonography include poor morphological information compared with other neurovascular imaging techniques, operator dependence, and the limited field of view of the insonation window.
The main clinical indications for transcranial ultrasonographic studies are the evaluation of patients with suspected steno-occlusive disease of the cerebral arteries, in particular of the MCA, and the evaluation and follow-up of patients with vasospasm after subarachnoid hemorrhage.
Computed Tomographic and Magnetic Resonance Angiography of Cerebral Arteries and Veins: Technical Considerations
A basic understanding of some key principles of CT and MR physics is necessary for optimizing protocols and for
maximizing the diagnostic yield of the obtained information (Chapters 1 and 2). In this section, a clinician’s view on the essential technical considerations for CTA and MRA of the cerebral vasculature is provided.
maximizing the diagnostic yield of the obtained information (Chapters 1 and 2). In this section, a clinician’s view on the essential technical considerations for CTA and MRA of the cerebral vasculature is provided.
Computed Tomographic Angiography
Until the late 1980s, CT scanners acquired data in discrete slices of patient anatomy, a method often called axial scanning. The advent of slip-ring technology and new reconstruction techniques provided a gateway to the data acquisition currently in use, spiral or helical CT, and multislice spiral or multidetector/multirow CT (MDCT) data acquisition systems, that, in turn, have paved the way toward the high-quality dedicated CTA examinations of the cerebral vessels currently obtainable.
In spiral or helical CT, the patient translates through the gantry while the x-ray tube rotates around the patient. Compared with conventional or axial CT a volume of data is collected, the spatial resolution in the z-axis is improved, and the scan time is reduced. These features are the prerequisites for optimized CT angiography and an enhanced capacity to generate meaningful multiplanar (MPR) or 3D renderings.
Key parameters for spiral tomography are section collimation, the table feed per rotation, and the pitch (table feed per rotation/section collimation). By extending the pitch factor (e.g., from 1 to 1.5) for a given scan length, the patient dose can be reduced (in this example by 33%) as well as the acquisition time. The accompanying trade-off is a slight broadening of the slice sensitivity profile (effective axial slice thickness). Recent implementations of faster gantry rotations can further speed up acquisitions or be used to obtain higher z-axis resolution.
The development of spiral CTs with multiple-row detectors, MDCT, has allowed a more efficient use of the x-rays produced by the tube while improving z-axis resolution. Owing to the faster acquisition of a long scanning range, MDCT is particularly useful for the evaluation of the thoracoabdominal region, where large organs can be scanned during a single breath hold.
As applied to neurovascular imaging, MDCT yields near isotropic submillimeter resolution scanning. A depiction of the circle of Willis in the arterial phase without venous contamination is now readily obtainable, in particular if MDCTs capable of acquiring greater than four sections per rotation are used.
As in spiral CT, section collimation and the table feed per rotation are the most important acquisition parameters. Unfortunately, different definitions of the pitch factor are used with multislice CT scanners, depending on whether the total collimation (number of active arrays ÷ section collimation) or a section of the detector array is chosen as a reference. In the first case, the pitch is termed beam pitch or volume pitch and often is denoted with P [table feed per rotation/(number of active arrays ÷ section collimation)] consistent with the notion of pitch used in single-row detector helical CT. The detector pitch, denoted P*, used by most vendors, indicates the width of a single active detector channel (table feed per rotation/section collimation). The relation between the two definitions of pitch is:
Protocols
Optimized patient preparation is a prerequisite for any neurovascular CTA examination. In those patients who are confused, irritable, or uncooperative, strategies to reduce motion artifacts such as immobilization of the head by using an adhesive tape or the administration of a short-acting sedative should be considered.
To achieve a reasonably homogenous vascular opacification, the use of a power injector is mandatory, and an injection rate of 3 to 5 mL per second should be chosen. For all neurovascular applications, 80 to 100 mL of iodinated contrast material is usually sufficient. With MDCT, the dosage might be reduced especially if a small volume of anatomy (e.g., the circle of Willis) is scanned with a high acquisition speed (e.g., ≥16-slice CT). To assure that the contrast material is pushed forward through the venous system past the end of the actual contrast injection, a saline chaser bolus (e.g., 40 mL, injection rate of 3 to 5 mL per second, identical to that used for the contrast media) should be injected immediately after contrast administration.
Scanning should only take place during the plateau phase of vessel enhancement. Due to known large variation of circulation times of patients (5), the synchronization of the start of the scan with the arrival of the contrast material in the arteries of the brain should be planned on a per patient basis (Fig. 11-3). The synchronization is important to ensure maximal contrast within the vessels if single slice CT is used but becomes crucial if fast MDCT for arterial imaging with little or no venous overlay is desired, given the short arteriovenous transit time within the brain of about 6 to 8 seconds.
For synchronization, two methods are available. With the first method, the test-bolus injection, a small amount of contrast (15 to 20 mL) is injected. Following an empiric 10-second delay, a low-dose dynamic, nonincremental CT scan at the midcervical level or at the level of the frontal sinus (e.g., 15 slices at a rate of 1 image per second) is performed to determine the arrival time of the small test-dose bolus. Based on the test-bolus arrival time, the CTA examination can be adequately planned and based on the physiology of the individual. Thus, with the test bolus, two separate injections are necessary—one for the arrival time assessment followed by a diagnostic run with a full dose of contrast media.
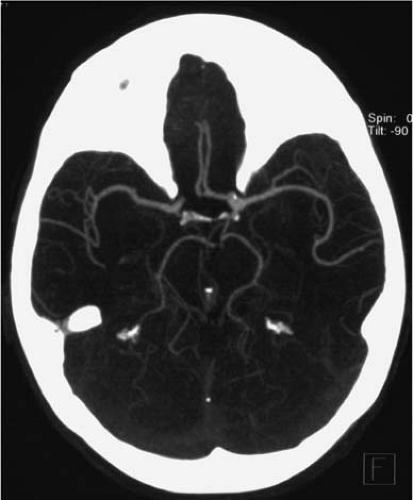 Figure 11-3 CTA MIP image of the intracranial arteries obtained with a 16-slice scanner using the test bolus injection. The opacification of the veins and sinuses is minimal. |
To avoid these separate injections, many CT scanners have a bolus-triggering feature built into their system. With this approach, online monitoring of a region-of-interest (e.g., carotid or cerebral arteries) is carried out using low-dose, nonincremental scans during the injection of contrast medium. Then, the diagnostic CTA acquisition is initiated on achieving a predefined enhancement threshold (e.g., 100 HU). However, a drawback of this method is a delay time in the start of the actual acquisition—depending on the scanner model—in the order of 2 to 8 seconds, which might be too long to image within the arterial phase.
Table 11.1 Imaging Parameters for Computed Tomographic Angiography of the Intracranial Arteries* | ||||||||||||||||||||||||||||||||||||||||||||
|---|---|---|---|---|---|---|---|---|---|---|---|---|---|---|---|---|---|---|---|---|---|---|---|---|---|---|---|---|---|---|---|---|---|---|---|---|---|---|---|---|---|---|---|---|
| ||||||||||||||||||||||||||||||||||||||||||||
For imaging of the venous system, an individual timing of the contrast administration is not necessary from our experience. In this scenario, we usually start scanning 30 seconds after contrast administration, which ensures a good opacification of the cerebral veins and sinuses.
The coverage of the investigation volume depends on the clinical demand. For cerebral arterial imaging, our standard protocol covers the distance from the anterior arch of C1 to the top of the frontal sinus. Depending on the clinical question, it is restricted to the central section (e.g., for imaging of a middle cerebral artery stenosis) or expanded to include the cervical vessels as well. For venous imaging, the entire head is scanned.
Protocols for performing dedicated CTA examinations depend in detail on the equipment being used. Detailed imaging protocols depend on the type of CT scanner used. Table 11-1 gives the protocols we found useful for a 4-slice, a 16-slice, and a 64-slice scanner (Siemens, Erlangen, Germany).
Visualization Techniques
Image acquisition with thin collimation is a prerequisite to obtain secondary reconstructions with a high spatial resolution. Four main visualization techniques are currently in use to evaluate the volumetric data sets—multiplanar reformations (MPR), maximum-intensity projections (MIP), shaded surface display (SSD), and volume rendering (VR). On most commercially available 3D workstations, it is possible to display images in three planes simultaneously to allow for cross referencing and to change the display mode on the fly (Fig. 11-4).
MPR images that are single voxel tomograms are usually the primary mode of evaluation. They are particularly
useful when evaluating intraluminal pathologies and for the visualization of brain parenchyma or osseous structures in conjunction with the vessels. Because the course of most vessels does not lie within a single plane, however, the entirety of a vessel can rarely be depicted. To overcome this problem, curved planar reformats can be reconstructed. These images are created from a line that connects points that were manually positioned over a vessel as viewed on standard MPR, MIP, SSD, or VR. Depending on the software, these reconstructions can be rotated, and sections perpendicular to the central pathline can be obtained, allowing for precise assessment of vessel cross section and degree of stenosis.
useful when evaluating intraluminal pathologies and for the visualization of brain parenchyma or osseous structures in conjunction with the vessels. Because the course of most vessels does not lie within a single plane, however, the entirety of a vessel can rarely be depicted. To overcome this problem, curved planar reformats can be reconstructed. These images are created from a line that connects points that were manually positioned over a vessel as viewed on standard MPR, MIP, SSD, or VR. Depending on the software, these reconstructions can be rotated, and sections perpendicular to the central pathline can be obtained, allowing for precise assessment of vessel cross section and degree of stenosis.
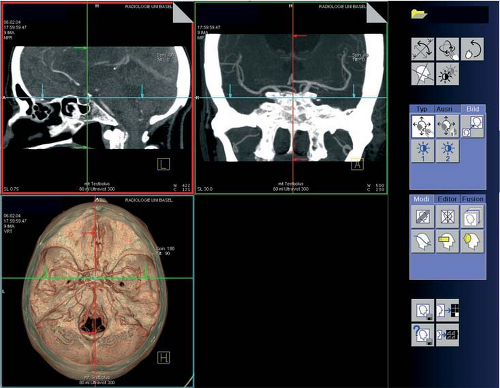 Figure 11-4 Desktop screenshot of a commercially available 3D workstation. Three visualization techniques are displayed. Top left: MPR image in sagittal plane. Top right: 30-mm MIP slab in coronal plane, centered around the green line as displayed on the image top left (cross referencing). Bottom left: VR image. |
MIPs are created when a specific projection is selected (e.g., anteroposterior), and then rays are cast perpendicular to the view through the volume data, with the maximum value encountered by each ray encoded on a 2D output image. As a result, the entire volume is collapsed, with only the brightest structures being visible. In contrast to MPR, vascular structures that do not lie in a single plane in their entirety can be visualized. MIP images preserve the “attenuation” information (which allows distinguishing between contrast-material–filled vessels and calcifications); however, the “depth” information (which allows distinguishing “closer” from “farther away” anatomic structures) is lost.
A practical limitation to this technique is the obscuration of contrast-enhanced blood vessels by structures that are more attentuative than the vessels—a particular problem in the display of the cerebral vessels due to the close relation between the vessels and the bone. Editing of the data set to obtain images of, for example, the circle of Willis is time consuming; therefore, slab MIPs (targeted MIPs) are an excellent alternative for image display. Slab MIPs are created when a plane through the data is defined
and then “thickened” to the desired width. By selecting a slab thickness and slab orientation that does not include high attenuation structures, an increased display of the vessel throughout its course is available while preserving delineation (Fig. 11-5).
and then “thickened” to the desired width. By selecting a slab thickness and slab orientation that does not include high attenuation structures, an increased display of the vessel throughout its course is available while preserving delineation (Fig. 11-5).
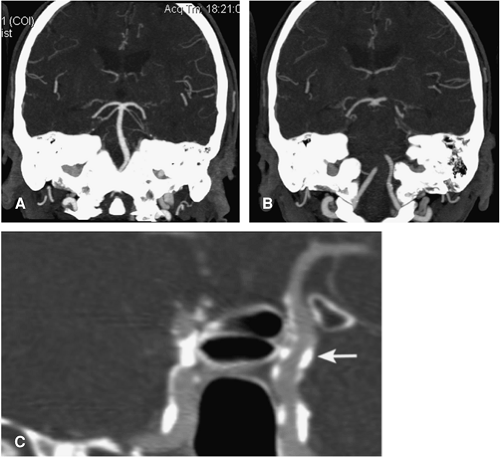 Figure 11-5 CTA MIP slab images of cerebral arteries. A, B: Two thin slices in paracoronal orientation already give a good overview about the anatomy of the vertebrobasilar circulation. C: For evaluation of the intracranial ICA that follows a complex course, curved MIP images (here, 2-mm thickness) can be helpful. Note vessel calcifications on both sides (arrow) that can be well differentiated from the contrast-filled vessel lumen. |
SSD is an efficient modality that usually requires no prior editing to obtain 3D views for the demonstration of complex 3D vascular anatomy. With this technique, the user defines a range of Hounsfield values to select the tissue to be rendered. Rays are passed through the entire volume that “stop” at the point the threshold range is reached for the first time. Only the surface is displayed in this method, and the “depth” information is preserved. Shading the voxels enhances the effect so that the volume appears to be illuminated by a light source.
However, with SSD, the “attenuation” information is lost. The major disadvantage of SSD is the limited accuracy of the 3D images as the display depends on the selected threshold values (Fig. 11-6). Thus, arteries will appear to vary in caliber depending on the thresholds that are selected, unsuitable threshold values may simulate occlusion or stenosis of vessels, and calcified plaque that accompany a stenosis that fall within the same threshold range as the blood vessel lumen result in the appearance of a local dilatation, rather than a stenosis (6).
The VR technique is the most complex rendering method that allows the integration of all available information from a volumetric data set with control of the opacity or translucency of selected tissue types (Fig. 11-7) (7).
There are many different versions of volume rendering, but in general, the user defines the opacity values for various HUs. In a second step, rays are passed through the volume that accumulate values along the way. Groups of voxels within defined attenuation thresholds are assigned a color and an opacity level that can be varied from total transparency to total opacity. With this technique, it is possible to demonstrate, for example, a vessel calcification together with the vessel and the skull base in different colors.
There are many different versions of volume rendering, but in general, the user defines the opacity values for various HUs. In a second step, rays are passed through the volume that accumulate values along the way. Groups of voxels within defined attenuation thresholds are assigned a color and an opacity level that can be varied from total transparency to total opacity. With this technique, it is possible to demonstrate, for example, a vessel calcification together with the vessel and the skull base in different colors.
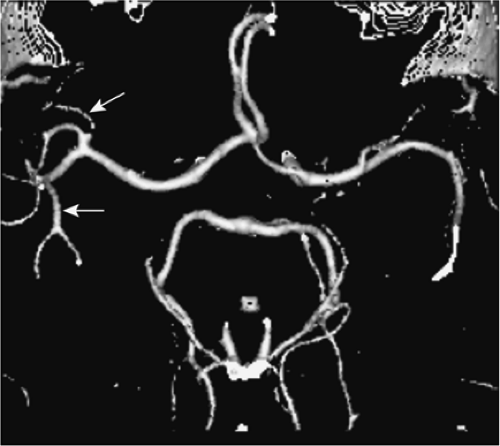 Figure 11-6 SSD of the cerebral arteries. Smaller arteries are rendered irregular or with gaps (arrows). |
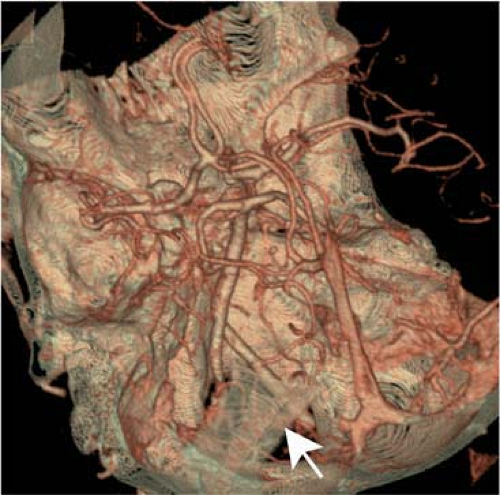 Figure 11-7 VR image of the cerebral vessels. The vessels here can be well differentiated from the bony structures. Due to differences in opacity levels, it is possible to look “through” the bone (arrow). |
For image presentation, some standardized slab MIPs are usually sufficient. However, these images are not sufficient for a reliable image interpretation! The actual analysis of the complex anatomy of the cerebral vessels requires a free-form interrogation of the source data set on the 3D workstation and should include as many types of image display as required to understand the geometry and pathology.
Magnetic Resonance Angiography
MRA was introduced into clinical practice about 15 years ago and has rapidly become a mainstay in the evaluation of neurovascular disease. Compared with CTA, there is no ionizing radiation and no need for nephrotoxic contrast media. Flow-dependent acquisition techniques, phase contrast MRA (PC MRA), and in particular, the time-of-flight MRA (TOF MRA) have predominated for the evaluation of the cerebral vessels.
These techniques are highly versatile and, in addition to the morphological assessment of the neurovascular anatomy, allow the user to determine blood flow direction or the quantification of blood flow. The main drawbacks are the relative long acquisition times and the vulnerability to artifacts—for example, signal loss due to saturation effects or turbulent flow (Chapter 2).
With flow-independent, contrast-enhanced MR angiography (CE MRA) techniques, the hyperintense signal intensities in the vessels result from the T1 shortening of blood in response to an injection of a gadolinium chelate. This approach offers an image that emphasizes morphological features of the vessel lumen rather than the physiological features of blood vessel flow. However, CE MRA requires trade-offs between imaging speed, volume coverage, and resolution in order to obtain satisfactory venousfree images.
At the current time, no single technique for optimal visualization of all intracranial vessels exists. However, for both the flow-dependent and the flow-independent acquisition modalities, numerous technical variations exist for evaluation of the cerebral vessels that are chosen in dependence of the clinical question.
Time-of-flight Magnetic Resonance Angiography
In general, the robust, flow-dependent TOF MRA technique is primarily used for imaging of the cerebral vessels (Fig. 11-8). TOF MRA is based on the differences in saturation between the extravascular and intravascular (moving blood) constituents. The signal intensity of static tissue (extravascular)
is progressively suppressed by repetitive radio frequency pulses, and the inflow enhancement in the investigated vessel produces the angiographic effect.
is progressively suppressed by repetitive radio frequency pulses, and the inflow enhancement in the investigated vessel produces the angiographic effect.
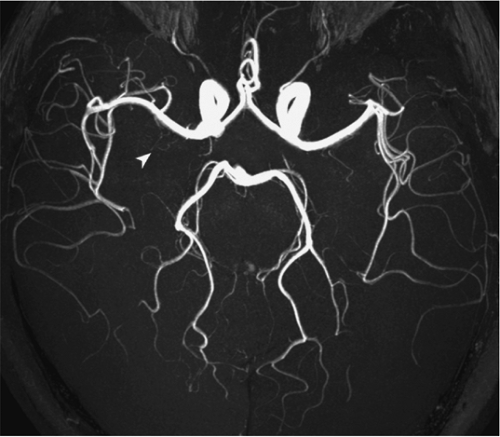 Figure 11-8 3D TOF at 3T with a voxel size of 0.13 mm3 (TE 3.4, TR 26, 832 3 1024 matrix). Small lenticulostriate arteries can be visualized (arrowhead). Courtesy of W. Willineck, University Hospital Bonn, Bonn, Germany. |
The most important drawbacks of TOF MRA are the saturation effect and (poststenotic) signal voids, the latter caused by intravoxel incoherence in regions with turbulent flow. Numerous variations of the technique to reduce these shortcomings and methods to improve the inflow-related enhancement have been introduced.
In 3D TOF, one single volume (slab) is excited and segmented into small slices by a second-phase encoding gradient, while in 2D TOF, multiple single slices are acquired sequentially. Both methods have specific advantages and disadvantages as well as resulting different applications.
A major benefit of 3D TOF acquisition is the optimized resolution in all directions. With 3D techniques, slice thickness can be reduced to below 1 mm. In 2D techniques, slice thickness usually varies between 2 and 3 mm, which makes this technique more prone to dephasing effects as the number of different possible phases within the voxel increase. On the other hand, compared with the 3D technique, the 2D method shows an improved sensitivity for inflowing magnetization based on minimized flow saturation effects: In sequential acquisitions, each slice of the data set represents an “entry” slice with the strongest possible intravascular signal. This enables the use of a slightly higher flip angle and as a consequence an overall improvement in signal-to-noise ratio (SNR). Therefore, this technique is well suited for the detection of slow laminar flow conditions.
Based on these properties, 3D TOF MRA is mainly used for the depiction of the relatively small cerebral arteries, while 2D TOF MRA is used for the depiction of the slower flowing cerebral veins. For both techniques, optimized inflow conditions are achieved by orientating the imaging plane perpendicular to the predominant vascular flow direction—for imaging of the cerebral arteries, the preferred imaging plane is therefore axial; for imaging of the cerebral veins, the coronal plane is preferred.
To reduce saturation effects in 3D TOF MRA, titled optimized nonsaturating excitation (TONE) radio frequency pulses are frequently used. These pulses provide flip angles that are variable along the slice selection direction. Typically, low flip angles are applied at the entrance side of the arteries in the volume of interest to delay saturation. The flip angle is then steadily increased in cranial direction; the increasing flip angles offer maximal signal recovery from that which remains in the flowing blood, deeper in the slab. The gradient of the TONE pulse (or ramped flip angle) depends on the velocity and the slab thickness (e.g., for imaging of the intracranial arteries 10 degrees at the entrance side and 30 degrees near the top of the volume).
Another method to improve the inflow-related enhancement in 3D acquisitions represents the multiple overlapping thin slice acquisitions (MOTSA) technique. Instead of one thick slab, multiple, consecutively acquired 3D data sets are combined to yield a single reconstruction of the final volume (Fig. 11-9). Because the slab excitation profiles in the slice selection direction are never ideal, these 3D acquisitions have to be mutually overlapping in order to portray the vessels in a smooth and continuous manner.
Incorrect matching of the separate volumes due to gross patient motion might occur as well as visible transitions between the different slabs, leading to a slab boundary or “venetian blind” called artifact on the MRA MIP image. The latter artifact can be reduced by increasing the slab overlap and reducing the number of partitions.
A common way to cope with saturation of the intracranial arteries using 3D TOF MRA is to suppress the stationary tissue using a magnetization transfer prepulse. A strong, off-resonance radio frequency pulse saturates the spins of large molecules (macromolecules) that contain protons or are associated with water molecules bound to them. This bound proton pool is able to exchange energy with the free proton pool (water).
The saturated macromolecular spins with zero magnetization will exchange for water spins having magnetization of one.
Thus, when the magnetization of the water spins is subsequently measured, it will be found to be less than one. As a result, the signal of brain tissue decreases, whereas the signal of flowing blood is unaffected.
Thus, when the magnetization of the water spins is subsequently measured, it will be found to be less than one. As a result, the signal of brain tissue decreases, whereas the signal of flowing blood is unaffected.
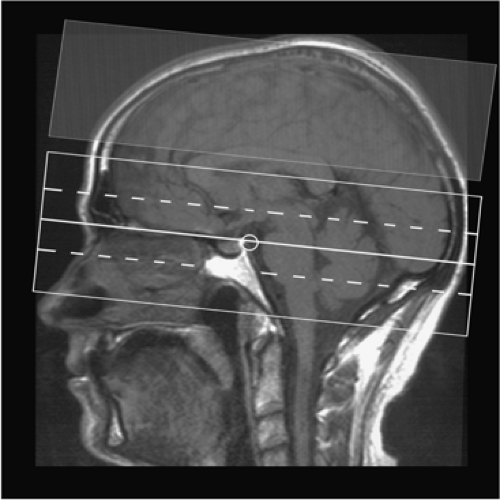 Figure 11-9 Planning of 3D TOF MRA of the cerebral arteries with MOTSA. Three separate volumes are acquired; a saturation pulse is applied cranially to suppress venous structures. |
Finally, in standard TOF sequences, a presaturation pulse is implemented into the sequence, nulling the cephalocaudad (venous) flow. This saturation pulse is placed parallel and directly superior to the imaging plane (Fig. 11-9).
The image quality of the long-established TOF technique can be considerably improved by two recently introduced MR technologies that have become widely available: high-field imaging and parallel imaging. With 1.5T imaging, the spatial resolution of 3D TOF MRA is limited, and attempts to pursue 1024 spatial resolution would be associated with lower SNR with reasonable scan times. Apart from an increased SNR, 3T high-field-strength MR imaging provides an improved vessel-to-tissue contrast due to the shortening of the T1 relaxation (8,9).
In a study comparing standard resolution 3D TOF MRA (true voxel volume 0.92 mm3) at 1.5T and 3T with high resolution MRA (true voxel volume, 0.13 mm3), the high-spatial-resolution 3T examination was found to provide a superior image quality and a significantly better depiction of small vessels segments and vascular disease (9).
Parallel MR imaging techniques, for example, sensitivity encoding (SENSE), facilitate imaging by partially shifting the burden of spatial encoding from magnetic field gradients to receive coils (10). This allows faster imaging, or, alternatively, with an equivalent acquisition time, images with increased spatial resolution can be obtained. However, especially in high spatial resolution examinations at 1.5T where the SNR is already borderline, the relative loss of SNR that scales with the square root of the SENSE reduction factor can be a drawback.
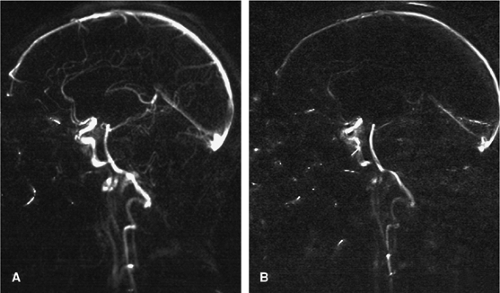 Figure 11-10 Single-slice 2D PC MRA obtained in sagittal orientation. With (A) a VENC of 15 cm per second, the venous structures are considerably better visualized compared with image acquisition with (B) a VENC of 60 cm per second. |
Willinek et al. recently combined the advantages of 3T imaging (high signal-to-noise) with that of SENSE (speed) and found this technique compared with the technique without SENSE promising, as it allowed a substantially reduced measurement time while maintaining the image quality of the 3D TOF MRA examination without SENSE (11).
Phase-contrast Magnetic Resonance Angiography
PC MRA is based on the application of a bipolar gradient pulse pair producing a phase shift depending on the velocity component along the gradient (Fig. 11-10). The technique is very flow sensitive and provides full background suppression but requires a relatively long acquisition time if flow is encoded in all three spatial directions (3D PC MRA).
A velocity-encoding gradient (VENC) of 15 to 20 cm per second for imaging of the venous system and of 60 to 80 cm per second for display of the arteries is usually recommended. However, a variety of velocities can occur in cerebral arterial disease, complicating the correct selection of the VENC. Thus, the method is not as widely used for depiction of the cerebral vessels as is the TOF technique.
Projective 2D PC MRA images on the other hand can be acquired fast (1 min) and easily. This technique is often used to determine the topographic location of the craniocervical
arteries in coronal direction, enabling an adequate volume to be investigated by contrast-enhanced MRA methods. It can also provide a good depiction of flow in the major cerebral veins.
arteries in coronal direction, enabling an adequate volume to be investigated by contrast-enhanced MRA methods. It can also provide a good depiction of flow in the major cerebral veins.
The unique capability for PC MRA to measure the flow velocity offers information unobtainable by other MRA strategies. In neurovascular applications, MR flow quantification techniques have most often been applied to evaluate the carotid arteries, intracranial arteries, and venous sinuses (12,13).
Recent technical advances allow for acquisitions of flow-sensitive time-resolved 3D MR based on ECG synchronized 3D phase contrast MRI. This enables a visual assessment and in vivo evaluation of local cerebral blood flow patterns with high temporal and spatial resolution (Fig. 11-11).
The typically long measurement times associated with MR flow quantification have hindered its widespread use in routine clinical practice. The feasibility of a technique to measure flow velocities of the carotid arteries and the cerebral sinuses in real time without the need for cardiac gating was recently described (14). For that purpose, a real time MR phase contrast technique was applied that uses a 2D selective radio frequency pulse followed by flow-sensitizing gradients with echoplanar readout. With this technique, the flow velocities are displayed as time-velocity curves, closely resembling Doppler flow-velocity distribution plots; hence, the technique was termed duplex MR. By controlling scan position and orientation interactively, flow signal is optimized (Fig. 11-12).
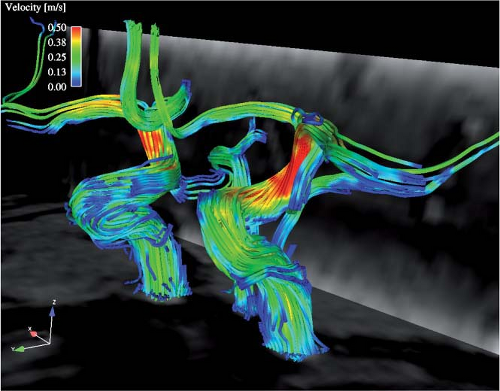 Figure 11-11 Overview of 3D blood-flow patterns and velocities of the circle of Willis. The image is based on an ECG-synchronized 3D phase-contrast MRI technique with advanced postprocessing strategies. The complex flow patterns and segmental changes in absolute blood flow velocities are color coded. |
Contrast-enhanced Magnetic Resonance Angiography
Unlike TOF or PC MRA methods, CE MRA does not rely on the natural flow effects, but on the shortening of the T1 relaxation time of blood after intravenous injection of a paramagnetic contrast agent bolus. While for TOF techniques an acquisition perpendicular to the vessel is recommended to reduce saturation effects, CE MRA can be generated in any
desired orientation, including acquisitions in the plane of the vessels of interest. The considerably shorter measurement times minimize the vulnerability to motion artifacts.
desired orientation, including acquisitions in the plane of the vessels of interest. The considerably shorter measurement times minimize the vulnerability to motion artifacts.
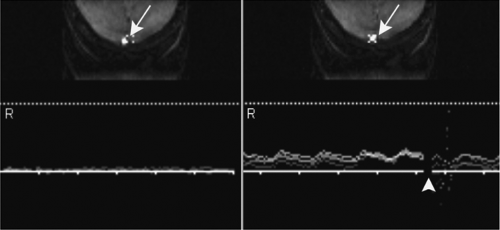 Figure 11-12 Duplex MR imaging of the SSS. At top, the anatomic image is displayed. The region of interest, representing four voxels, is indicated by four white circles (arrows). No flow signal is observed if the region of interest is placed outside the sinus (left). When all voxels are placed over the sinus (right), a slow uniform pulsatile flow can be observed, with craniocaudally directed flow displayed above the baseline (bottom). The distance from the baseline to the measured line represents the velocity (here, 35 cm per second), depending on the VENC (here, 100 cm per second). The baseline tick interval is 1 second; the gap on the baseline indicates the current point of measurement (arrowhead). |
There are two principle techniques of CE MRA that have been applied for imaging of the cerebral vasculature that differ in acquisition time and pharmacodynamic distribution of contrast material during image acquisition: It can either be performed during the steady state after intravenous injection of the contrast medium or during the initial transit of the contrast bolus.
CE MRA during the steady state is technically less demanding, and a high resolution can be obtained (Fig. 11-13). These sequences can be helpful in differentiating true stenosis of large arteries from artifactual narrowing, to visualize distal intracranial arteries, and to image vascular pathologies that can contain areas of slow flow (e.g., large aneurysms, arteriovenous malformations) (15,16,17). For steady state arterial imaging, 3D TOF techniques are typically used with slightly increased flip angles to optimize vessel signal intensities (15).
Jung et al. found a small dose of 5 to 10 mL of gadopentetate dimeglumine to be optimal, as a larger dose of 20 mL limited the interpretation of the small and large arteries due to venous overlap—the shortcoming of CE steady state MRA (18). On the other hand, the dedicated assessment of the venous system is usually not hampered by the arteries.
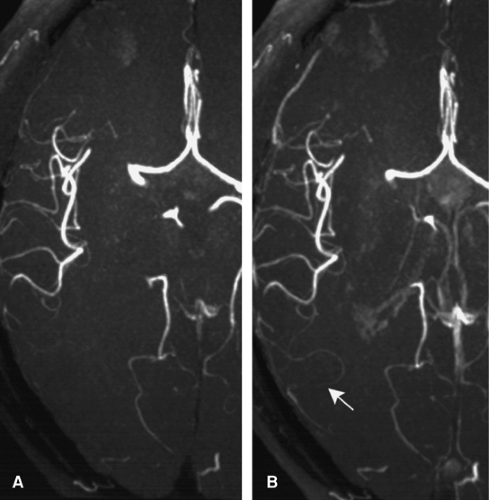 Figure 11-13 A: 3D TOF MRA MIP slab before and (B) after administration of 10 mL of gadopentetate dimeglumine. Smaller peripheral vessel branches are better visualized; however, there is overlap of the cerebral veins. |
Steady state MRA with 3D T1-weighted gradient-echo sequences was found to be an effective way to demonstrate the venous system with high resolution (Fig. 11-14). However, due to the long acquisition time—in the order of minutes—a chronic thrombus might enhance and be obscured if a steady state MRA technique is used. This pitfall is important to know in the work up of patients suspected to have a venous sinus thrombosis (see subsequent discussion) (19,20,21).
First-pass CE MRA is the more recent of the two CE MRA techniques (22). For clinical routine neuroradiological examinations, this technique has been mainly applied for assessment of the extracranial carotid arteries (23,24,25). Given the short transit time of 5 to 6 seconds between the middle cerebral artery and the straight or transverse sinus, the demanding part of this technique is obtaining images of the cerebral arteries without venous overlay. Therefore, to obtain an acceptable resolution, fast sequences that require high-performance gradients with fast rise times and high gradient strength are mandatory.
In general, two methods of first-pass CE MRA can be distinguished (26). In the first, dynamic, or time-resolved CE MRA, a 3D sequence with a measurement time in the order of 5 to 6 seconds is started simultaneously to the contrast injection and sequentially is repeated. This allows to distinguish arterial, early arteriovenous, late arteriovenous, and washout arteriovenous phases. However, due to the
short acquisition time, the spatial resolution and hence the usefulness for arterial imaging is limited. For imaging of the cerebral veins, this fast imaging can be of use (27).
short acquisition time, the spatial resolution and hence the usefulness for arterial imaging is limited. For imaging of the cerebral veins, this fast imaging can be of use (27).
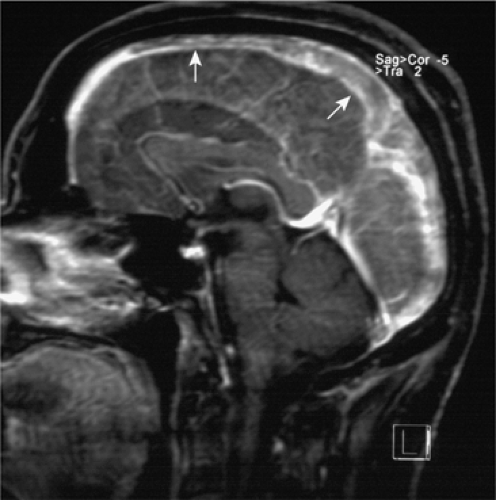 Figure 11-14 MIP slab in sagittal orientation of CE MRA in the steady state showing an extensive cerebral venous thrombosis in the SSS (arrows) (compare with Fig. 11-52A–D). |
An alternative and effective way to visualize the dynamic transit of a contrast bolus from the arterial to the venous phase represents dynamic 2D MR projection angiography, also termed magnetic resonance digital subtraction angiography (28,29). This technique employs a modified gradient-echo sequence that is combined with a subtraction technique to maximize vessel-to-background contrast and allows 2D projection angiograms to be obtained of the entire cerebral circulation at a subsecond temporal frame rate with a high in-plane resolution (e.g., 1 mm2). In practice, the sequence is simultaneously started to the injection of the contrast bolus, and the first images before arrival of the contrast are used to form a mask image. All further images are then calculated by complex subtraction of the mask from the subsequent images.
 Figure 11-15 Time-resolved whole-brain 3D contrast-enhanced MRA with parallel imaging. Subsequently acquired data sets are displayed as MIP images in coronal and sagittal orientation (gray values inverted). The temporal resolution of 1.5 seconds allows visualizing of the dynamics of the contrast bolus passage through the brain (voxel size 2 mm2). |
The technique can be extremely valuable for the detection of vascular pathologies that are characterized by fast arteriovenous transit times, parenchymal arteriovenous malformations, and foremost in the detection of dural arteriovenous fistulas (30,31). The lack of volumetric information with these 2D images, however, represents a limitation. More recently, the advantages of parallel imaging were exploited to obtain whole-brain 3D CE MRA images with high temporal resolution (<2 seconds per image). Although the spatial resolution is still limited (voxel size 2 mm2), the information can be likewise of value for numerous pathologies that are characterized by fast arteriovenous transit times (Fig. 11-15).
To obtain first-pass CE MRA volumetric data sets with high spatial resolution that allow for detailed visualization
of smaller intracranial arteries, longer measurement times are necessary. For venous contamination to be minimized, the data acquisition must be synchronized with the arrival of the contrast bolus such that the filling of central k-space lines (where the key determinants of image contrast are established) coincides with the maximal arterial signal prior to the arrival of contrast media in the veins. In the central part of k-space, the low frequencies are sampled, whereas at the periphery of k-space, the higher frequencies are sampled. At the periphery of k-space, the key determinants of image resolution are established.
of smaller intracranial arteries, longer measurement times are necessary. For venous contamination to be minimized, the data acquisition must be synchronized with the arrival of the contrast bolus such that the filling of central k-space lines (where the key determinants of image contrast are established) coincides with the maximal arterial signal prior to the arrival of contrast media in the veins. In the central part of k-space, the low frequencies are sampled, whereas at the periphery of k-space, the higher frequencies are sampled. At the periphery of k-space, the key determinants of image resolution are established.
In a linear phase-encoding table (symmetrical sampling), the low frequencies are sampled in the middle of the measurement time. If the bolus arrival time is determined with a small test bolus of contrast agent (1 to 2 mL) by a rapid and repetitive acquisition of 2D images, an exact timing of the bolus and the sequence becomes possible, and images with little or, ideally, no venous overlay can be generated. As in the case for the fast time-resolved techniques, a precontrast image set is usually subtracted from a postcontrast image set to maximize vessel-to-background contrast.
When this approach is compared with 3D TOF technique, the resolution is limited. However, CE MRA can be valuable, for example, for the detection and characterization of intracranial aneurysms by boosting intravascular contrast, minimizing vulnerability to slow flow signal loss, and the lack of a T1 contamination artifact from blood clot (16,32).
The use of fluoroscopic triggering in CE MRA overcomes the need for the separate test bolus. The arrival of the contrast agent bolus is displayed on-line with the 2D sequence. When the arteries in the monitoring image enhance, the operator starts the angiographic 3D sequence without delay. The contrast determining parts of k-space must be sampled early because the bolus maximum has arrived at the time the 3D MRA sequence begins.
This requires a specific order for k-space sampling in which the central portions of k-space are obtained at the beginning of the data acquisition. Referred to as centric view ordering, or elliptical centric view ordering if it is centric in both phase-encoding directions, this technique has been shown to be feasible for arterial imaging (33). Since the image contrast is established early in the acquisition, a much longer sampling time can be pursued with less chance of venous contamination.
Farb et al. used the centric-ordered technique with a long measurement time of about two minutes (34). In that study of arteriovenous malformations, pure arterial imaging was thus not possible, but images with a high resolution were created that were valuable for the evaluation of arteriovenous malformations (34).
Intracranial Vascular Anatomy
A thorough understanding of the brain vascular anatomy is fundamental to making accurate interpretations in neuroimaging. Numerous excellent neuroradiological textbooks and atlas provide an exhaustive anatomic description of the normal vessels, the embryology of vessel formation, and anatomic variations (35,36,37). This is beyond the scope of this text. Rather, this chapter intends to give a description of the major cerebral vessels that are of importance for the assessment of CTA and MRA. Moreover, common variants and anatomic structures that are of special importance in certain clinical contexts are highlighted as well as some limitations in the anatomic display of the noninvasive techniques compared with DSA.
Arterial Anatomy
Neurovascular Extracranial Arteries
The right and left common carotid arteries (CCA) arise from the brachiocephalic trunk and the aortic arch, respectively. The CCAs typically divide at the C3 to C5 level into the external and internal carotid arteries (ECA and ICA). The first segments of the ICA are extracranial: (a) the carotid bulb, a dilatation at the origin of the ICA; and (b) the cervical segment of the ICA that terminates where the artery enters the temporal bone (petrous segment).
The ECA supplies most extracranial structures of the head and neck. The major branches are the superior thyroid, ascending pharyngeal, lingual, facial, occipital, posterior auricular, internal maxillary, and superficial temporal arteries.
The right and left vertebral arteries (VA) typically arise from the subclavian arteries. They normally ascend through the transverse foramen from C6 to C1. After looping posteriorly above the posterior part of the atlas, they pass through the foramen magnum and unite intradurally to form the basilar artery (BA). Small extracranial branches of the VA supply the spine and muscles; the posterior meningeal artery supplies the falx cerebelli and a part of the dura of the occipital bone.
Variants and clinical remarks. It is evident that the anatomic evaluation of the supra-aortic arteries is essential for a thorough analysis of numerous cerebrovascular disorders, foremost in the evaluation of patients with stroke. The major locations for atherosclerotic plaque formation that might lead to embolic infarcts or a critical hypoperfusion are the carotid bifurcation and the origin of the vertebral arteries. Dissections that may also result in cerebral infarcts are likewise more commonly extracranial in location: (a) at the ICA about two centimeters distal to the bifurcation; and (b) at the VA between the distal cervical segment and skull base.
Anastomoses between the extracranial and intracranial vasculature exist that can provide collateral flow in cases of
vessel stenosis or occlusion (e.g., between the angular branch of the facial artery and the ICA). A surgical bypass (“iatrogenic bypass”) between the extra- and intracranial vasculature is most commonly formed between the superficial temporal and the middle cerebral artery (Fig. 11-16).
vessel stenosis or occlusion (e.g., between the angular branch of the facial artery and the ICA). A surgical bypass (“iatrogenic bypass”) between the extra- and intracranial vasculature is most commonly formed between the superficial temporal and the middle cerebral artery (Fig. 11-16).
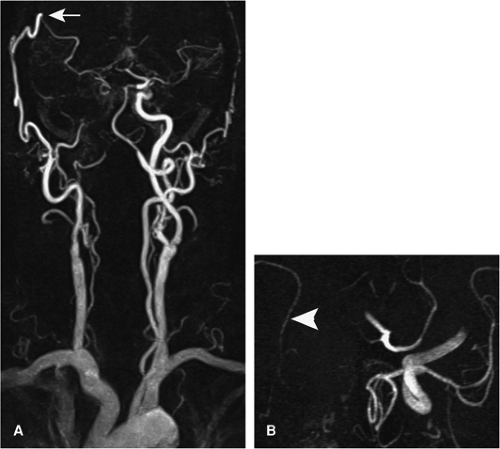 Figure 11-16 A: CE MRA of the cervico-cranial vessels showing a bypass between the right superficial temporal artery and the MCA (arrow). B: On 3D TOF MRA, flow is depicted in the periphery of the MCA (arrowhead), but not in the proximal part due to saturation effects. |
Numerous variants on the origin of the great vessels from the aortic arch have been described. In order from proximal to distal, the most common are described: (a) right subclavian artery arising as the last instead of the first brachiocephalic vessel (aberrant right subclavian artery); (b) right CCA arising directly from the aortic arch; (c) left CCA as common origin or arising from the brachiocephalic trunk; and (d) left ICA, ECA, and left VA with direct origin from the aortic arch. The anatomy of the ECA branches and the hemodynamic balance between adjacent branches are highly variable.
Intracranial Arteries
The Circle of Willis
The circle of Willis is an arterial polygon surrounding the ventral surface of the diencephalon. The following vessels comprise the circle of Willis (Figs. 11-17, 11-18): (a) the two ICAs; (b) the first segment (A1) of both anterior cerebral arteries (ACAs); (c) the basilar artery (BA); (d) the first segment (P1) of both posterior cerebral arteries (PCA); (e) the anterior communicating artery (ACoA); and (f) the two posterior communicating arteries (PCoAs). This polygon that surrounds the ventral surface of the diencephalon is the principal source of collateral flow in cases of an occlusion or severe stenosis of a major cerebral artery. A complete circle of Willis with no absent or hypoplastic segment is seen only in about 25% of cases.
The ICAs usually supply the territory of the ACAs and the middle cerebral arteries (MCAs), often termed the anterior circulation. The posterior circulation refers to the vascular territory supplied by the VA and BA, including the PCA.
The parenchymal vascular supply of the cerebral arteries is depicted in Figure 11-19, although individual vascular territories have considerable variability (38).
The Anterior Circulation
The Internal Carotid Artery.
Numerous anatomic classification schemes exist for the ICA, and this can be a source of confusion. A simple anatomic description is to divide the artery into five segments, in ascending order: (a) the extracranially located carotid bulb; (b) the extracranially located cervical segment; (c) the intraosseous petrous segment; (d) the cavernous segment; and (e) the intracranial segment.
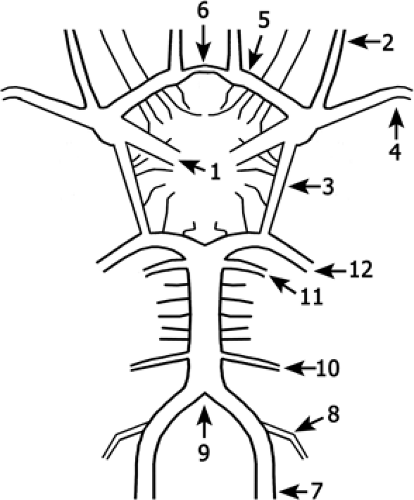 Figure 11-17 Schematic drawing of the circle of Willis. Branches of the ICA (1) are the ophthalmic artery (2) and the posterior communicating artery (3). The artery divides into the MCA (4) and the ACA (5) that is connected via the ACoA (6) to the contralateral side. The VA (7) gives rise to the PICA (8) and unites to form the BA (9). The basilar gives rise to the AICAs (10), the SCAs (11), and divides into the PCAs (12) that are connected via the posterior communicating artery (3) to the anterior circulation. |
A more detailed classification proposed by Bouthillier et al. in 1996 separates the artery into seven segments according to the adjacent structures and the compartments transversed (39). The segments are C1, cervical; C2, petrous; C3, lacerum; C4, cavernous; C5, clinoid; C6, ophthalmic; and C7, communicating. This classification system takes modern anatomic and clinical considerations into account and utilizes a logical scale in the direction of blood flow (Fig. 11-20; Table 11-2).
However, the classification system by Fischer published in 1938 that is based on the angiographic course of the intracranial ICA rather than its arterial branches or anatomic compartments is still widely used. With this classification system, the segments are numbered opposite to the direction of blood flow, and the extracranial ICA is excluded (40).
Numerous branches arise from the ICA. The ophthalmic artery, arising from the anterosuperior ICA (C6) and passing through the optic canal, and the PCoA, arising from the posterior aspect of the intradural ICA (C7), are usually visible on CTA and MRA (41). However, small but important branches—foremost the anterior choroidal artery (AChA) that arises a short distance above the PCoA and supplies crucial anatomic structures including the posterior limb of the internal capsule—are not visible unless pathologically enlarged (e.g., in the presence of arteriovenous malformations).
 Figure 11-18 3D TOF MRA MIP image of the circle of Willis. The left PCoA (3), the right AICA (10), and the left PICA (8) are well displayed, but not their counterparts on the contralateral side. Note the ICA (1), the ophthalmic artery (2), the MCA (4), the ACA (5), the ACoA (6), the VA (7), the BA (9), and the SCAs (11), with numbering as in Fig. 11-17. |
Variants and clinical remarks. In patients with an occlusion of an ICA, a small (<1 mm) or absent PCoA is a risk factor for ischemic cerebral infarction, which indicates the importance of the collateral pathways provided by this artery (42). Aneurysms at the origin of the PCoA are common, and as the artery courses posterolaterly over the oculomotor nerve, a third nerve palsy can result. This is a classic example of cranial neuropathies caused by aneurysmal compression.
Distinguishing aneurysms of the cavernous segment of the ICA from those that involve the proximal intradural portion of the artery is of importance for determining treatment options. Intradural aneurysms are at risk for subarachnoid hemorrhage and are usually treated with endovascular or surgical obliteration. In contrast, extradural aneurysms involving the cavernous segment of the ICA pose little or no risk of hemorrhage and are commonly monitored unless they enlarge and produce symptoms related to compression of cavernous sinus structures.
The ophthalmic artery has traditionally served as a landmark in distinguishing extradural (below the ophthalmic artery) from intradural (at or above the ophthalmic artery) aneurysms (43). This origin is variable, however, and may be extradural in 10% of cases.
According to first results from a recent study by Gonzalez et al., the inferior border of the optic strut as identified on CTA might be a more reliable anatomic location to discriminate between intradural and extradural aneurysms (Fig. 11-21) (44). This structure is the inferior root that connects the anterior clinoid process with the lesser wing of the sphenoid bone and separates the optic canal from the
superior orbital fissure. Aneurysms that arose distal (with respect to the blood flow) to the optic strut were located intradurally. Conversely, aneurysms that arose proximal to the optic strut were located within the cavernous sinus. Aneurysms at the optic strut were located within the clinoid segment or the interdural space.
superior orbital fissure. Aneurysms that arose distal (with respect to the blood flow) to the optic strut were located intradurally. Conversely, aneurysms that arose proximal to the optic strut were located within the cavernous sinus. Aneurysms at the optic strut were located within the clinoid segment or the interdural space.
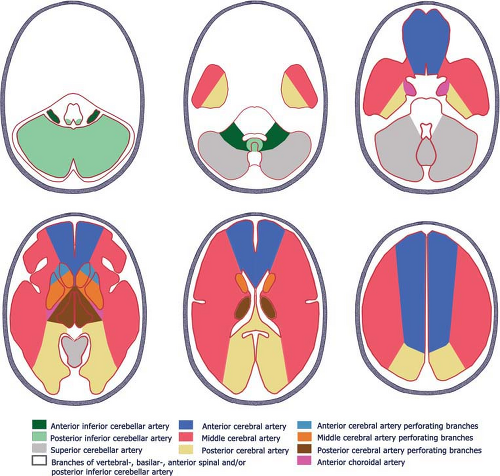 Figure 11-19 Approximate vascular territories of the brain. Note that there is considerable variability in the borders and size of the territories. Adapted and modified from Osborne A. Diagnostic Neuroradiology. St. Louis: Mosby; 1994, and Kretschmann H, Weinrich W. Cranial Neuroimaging and Clinical Neuroanatomy. Atlas of MR Imaging and Computed Tomography. 3rd ed., revised and expanded ed. New York: Georg Thieme Verlag; 2003, with permission. |
The intrapetrous ICA can take an aberrant posterolateral course traversing the hypotympanum. The differentiation of this anomaly from a glomus tympanicum paraganglioma is essential. A rare persistent stapedial artery originating from the petrous ICA is, in the majority of the cases, reported to be enclosed within a bony canal on the cochlear promontory. The artery becomes the middle meningeal artery, and an absent foramen spinosum indicates this anomaly. A possible course of the artery through the footplate of the stapes complicates prosthetic surgery for impaired hearing.
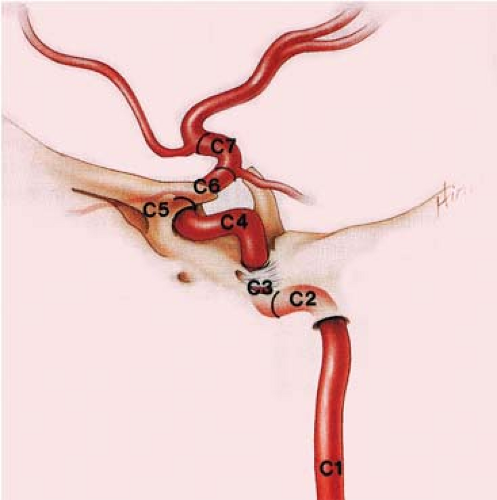 Figure 11-20 Classification of segments of the ICA. Reprinted from Bouthillier A, van Loveren HR, Keller JT. Segments of the internal carotid artery: a new classification. Neurosurgery. 1996;38:425–432; discussion 432–433, with permission. |
The absence of an ICA is rare. When trans-sphenoidal surgery is planned, the intrasellar intercarotid communicating arteries typically seen with this anomaly must be identified.
More common anomalies are carotid-vertebrobasilar anastomoses resembling persisting embryonic connections between the anterior and posterior circulation. The most common anastomosis is the persistent primitive trigeminal artery—present in up to 1%—that arises where the ICA exits the carotid canal (Fig. 11-22). It has two types, the lateral and the medial. The medial type, also termed intrasellar or transhypophyseal artery courses posteromedially, compresses the pituitary gland, penetrates the dorsum sellae, and anastomoses with the BA. This artery must be recognized if trans-sphenoidal surgery is planned (45).
Table 11.2 Classification of Segments of the Internal Carotid Artery* | |||||||||||||||||||||||||||
|---|---|---|---|---|---|---|---|---|---|---|---|---|---|---|---|---|---|---|---|---|---|---|---|---|---|---|---|
| |||||||||||||||||||||||||||
A persistent otic artery arising from the petrous ICA is extremely rare. A little more common are the connections that arise from the cervical ICA: the primitive hypoglossal artery and the proatlantal intersegmental artery.
The Anterior Communicating and Anterior Cerebral Artery.
From the A1 segment, which extends from the ICA bifurcation to the ACoA, arise perforating branches, the medial lenticulostriate arteries that pass cephalad to supply the head of the caudate nucleus and the anterior limb of the internal capsula (Fig. 11-23). These are not visible under normal conditions on CTA or MRA, nor are the branches of the ACoA that supply, for example, the superior surface of the optic chiasm and the anterior hypothalamus. The segment of the ACA between the junction of the ACoA and its bifurcation into the main terminal branches, the pericallosal and callosomarginal arteries, is termed A2. It curves around the genu of the corpus callosum. The largest medial lenticulostriate artery, the recurrent artery of Heubner, arises most commonly from the proximal A2 segment (less common from the A1 segment). Cortical branches of the A2 and A3 segment supply the anterior two thirds of the medial hemispheric surface.
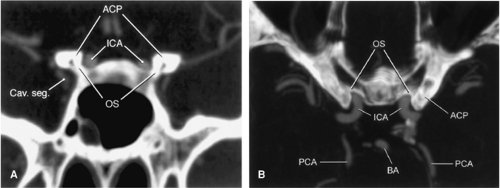 Figure 11-21 A: Coronal reconstructed CTA showing the optic strut and its relationship to the cavernous and intradural ICA. B: Axial reconstructed CTA showing the position of the intradural ICA and the relationships of the optic strut and the anterior clinoid process. (OS, optic strut; ACP, anterior clinoid process; Cav. seg., cavernous segment.) Reprinted from Gonzalez LF, Walker MT, Zabramski JM, et al. Distinction between paraclinoid and cavernous sinus aneurysms with computed tomographic angiography. Neurosurgery. 2003;52:1131–1137; discussion 1138–1139, with permission. |
Variants and clinical remarks. The most common variant is a hypoplastic, very rarely absent A1 segment. If a single trunk arises from the confluence of the A1 segments, instead of the paired A2 segments, it is termed azygous ACA, present in about 0.25% to 4%. A bihemispheric ACA is more common: In this entity, two ACAs exist, but the more dominant ACA sends branches to the contralateral hemisphere.
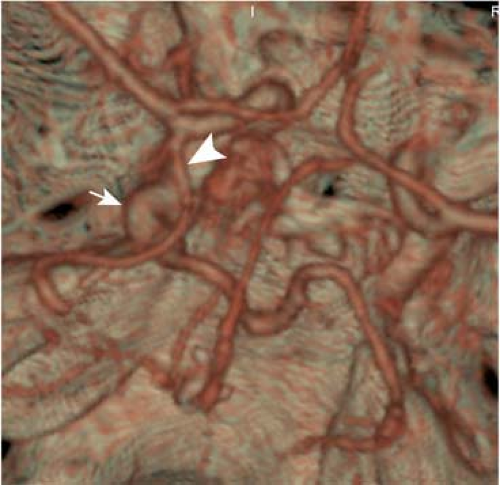 Figure 11-22 CTA VR image of a persistent trigeminal artery (arrow). The large anomalous artery arises from the precavernous segment of the ICA. The PCoA is present on the side of the persistent trigeminal artery (arrowhead); the distal BA is not visible. |
The Middle Cerebral Artery.
The MCA can be divided into four major segments (Fig. 11-23). First is the M1 segment, which is orientated horizontally and laterally, extending from the origin at the ICA bifurcation to the point where the MCA begins to curve posterosuperiorly over the insula, and includes the bifurcation or trifurcation
at the sylvian fissure. Deep perforating branches arise from this segment—the lateral lenticulostriate arteries—which supply the lentiform nucleus, parts of the internal capsula, and the caudate nucleus. The insular M2 segments extend from the genu to the top of the sylvian fissure and loop over the insula. The opercular M3 segments extend laterally through the sylvian fissure. The cortical M4 segments curve over the frontal, temporal, and parietal operculae, supplying large parts of the cerebral cortex and white matter.
at the sylvian fissure. Deep perforating branches arise from this segment—the lateral lenticulostriate arteries—which supply the lentiform nucleus, parts of the internal capsula, and the caudate nucleus. The insular M2 segments extend from the genu to the top of the sylvian fissure and loop over the insula. The opercular M3 segments extend laterally through the sylvian fissure. The cortical M4 segments curve over the frontal, temporal, and parietal operculae, supplying large parts of the cerebral cortex and white matter.
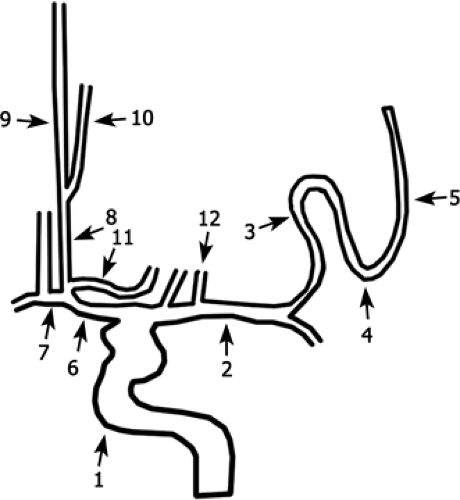 Figure 11-23 Schematic drawing of the ICA branches as viewed in a coronal projection. ICA (1); MCA (M1) (2); MCA (M2) (3); MCA (M3) (4); MCA (M4) (5); ACA (A1) (6); ACoA (7); ACA (A2) (8); pericallosal artery (9); callosomarginal artery (10); recurrent artery of Heubner (11); perforating arteries of the MCA (12). |
Variants and clinical remarks. Variants are rare and include fenestration, duplication, single trunk, and accessory arteries.
The Posterior Circulation
The Arteries of the Posterior Fossa.
The VAs pass through the foramen magnum and unite anteriorly to the medulla oblongata to form the BA (Fig. 11-24). The left VA is commonly the larger, dominant vessel. Important intracranial branches are the anterior spinal artery and the posterior inferior cerebellar artery (PICA).
After its origin from the distal parts of the vertebral arteries of both sites, the anterior spinal artery courses caudally in the anteromedial sulcus of the cervical cord. The PICA likewise originates from the distal VA, courses caudally along the medulla and the cerebellar tonsils, and with its cortical branches provides blood supply to the posteroinferior surface of the cerebellar hemispheres. Furthermore, the artery supplies the posterolateral medulla, the cerebellar tonsils, and parts of the vermis.
The BA runs cephalad in front of the pons and divides in front of the pons into the PCAs. Major branches are the anterior inferior cerebellar artery (AICA), the superior cerebellar artery (SCA), and perforating vessels. The AICA has a posterolaterally orientated course within the cerebellopontine angle cistern, directed toward the internal auditory canal, and supplies the anterolateral surface of the cerebellar hemisphere and parts of the brain stem. The SCA arises near the tip of the basilar artery and curves posterolaterally around the pons and mesencephalon to supply the parts of the vermis and the cerebellar hemispheres. The perforating branches that arise along the entire BA supply the ventral pons and rostral brain stem.
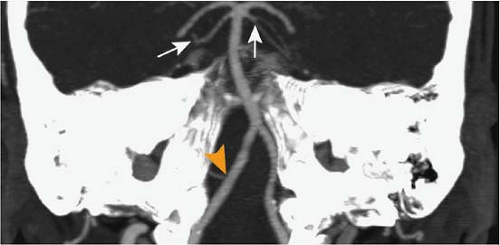 Figure 11-24 CTA MIP slab image in paracoronal orientation. The SCA is well delineated on both sides (arrows) as well as the right PICA (arrowhead). |
Variants and clinical remarks. Occasionally, a hypoplastic VA does not have a connection to the BA and terminates in the PICA. A shared AICA/PICA trunk is relatively common. Rarely, the origin of the PICA might be extradural. The BA may be hypoplastic if the PCA has a fetal origin (see next section) or if rare persistent fetal anastomoses exist. Duplications or fenestrations of the vertebral or basilar arteries have been described.
The Posterior Cerebral Artery.
The PCAs originate usually from the BA (Figs. 11-17, 11-24). The first segment, P1, is termed the precommunicating segment and extends laterally to the junction with the PCoA. Important branches, the posterior thalamoperforating that supply large parts of the thalamus and the midbrain arise from this segment—and from the basilar bifurcation—and are not recognizable on CTA or MRA.
The ambient or P2 segment courses posteriorly around the midbrain. Major branches are the medial and lateral posterior choroidal arteries, and the thalamogeniculate artery. These branches supply the tectal plate; parts of the midbrain, thalamus, and crus cerebri; the pineal gland; and the choroid plexus of the third and the lateral ventricular choroids plexus.
The P3 segment runs behind the midbrain in the quadrigeminal plate cistern. Branches supply the undersurface of the temporal lobe, the posterior third of the interhemispheric surface, the splenium of the corpus callosum, and the occipital pole including the visual cortex (calcarine artery).
Variants and clinical remarks. An origin of the PCA from the ICA, termed fetal origin of the PCA, is a commonly (20%) seen variant. This is by far the most frequently observed form of carotid-basilar anastomoses. If this anomaly is present, emboli from the carotid circulation might cause symptoms that are classically seen in pathologies of the vertebral or basilar arteries—for example, hemianopsia.
Venous Anatomy
Dural Sinuses
The superior sagittal sinus (SSS), located between the skull and the leaves of the falx cerebri, extends from the crista galli anteriorly and extends posteriorly to its confluence with the straight and lateral sinus (Fig. 11-25). The inferior sagittal sinus is located along the inferior free margin of the falx cerebri and, with the vein of Galen, forms the straight sinus. The straight sinus is enclosed by the dura of the falx cerebri and tentorium cerebelli, and drains into the superior sagittal sinus at the confluens sinuum. Near the confluence, multiple tentorial sinuses that drain the adjacent hemispheres and the cerebellum join the neighboring sinuses. The confluens sinuum divides into the transverse sinuses (TS), which course laterally around the tentorial attachment. At the posterolateral wall of the petrous bone, the transverse sinuses turn inferiorly to form the sigmoid sinus, which continues to the jugular bulb at the jugular foramen.
The cavernous sinuses are paired, septated venous structures located on either side of the sella turcica. The carotid artery, oculomotor nerves (third, fourth, and sixth cranial nerves), and the ophthalmic branch of the fifth nerve are contained within its lateral wall or traverse (sixth nerve) the sinus. The sinuses receive venous tributaries from the orbital veins and drain into the superior and inferior petrosal sinuses. They communicate with each other via intercavernous sinuses and posteriorly with the periclival venous plexus. The superior petrosal sinus connects the cavernous with the TS, and the inferior petrosal sinus connects the cavernous sinus with the jugular bulb.
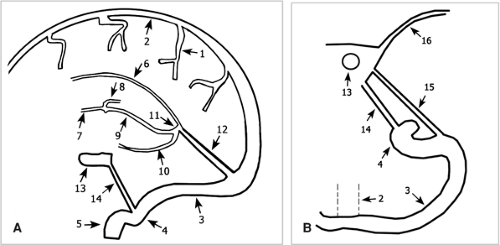 Figure 11-25 Schematic drawing of the cerebral veins in (A) sagittal and (B) axial orientation. Cortical veins (1); SSS (2); TS (3); sigmoid sinus (4); jugular vein (5); inferior sagittal sinus (6); septal veins (7); thalamostriate veins (8); internal cerebral veins (9); basal vein of Rosenthal (10); vein of Galen (11); straight sinus (12); cavernous sinus (13); inferior petrosal sinus (14); superior petrosal sinus (15); sphenoparietal sinus (16). |
Variants and clinical remarks. Common variants that are important to know when searching for cerebral venous thrombosis include a hypoplastic or atretic rostral SSS (in this case, prominent superior cortical veins are present) that should not be mistaken for a venous thrombosis; direct termination of the SSS in a TS (usually the right one; in this case, the straight sinus drains into the left—usually hypoplastic TS); “high-splitting” SSS; asymmetry of the TS (the right TS is usually dominant); or agenesis of the TS (in this case, an occipital sinus is prominent). In the majority of patients, arachnoid villi (pacchionian granulations) are visible on CTA or CE MRA techniques and can usually be differentiated easily by their smooth contour from pathological filling defects, as seen in venous thrombosis.
Cerebral Veins
The cerebral veins are often divided into superficial cortical veins and deep veins (Figs. 11-25, 11-26). The superficial cortical veins are highly variable. Three prominent veins can
be often recognized, however: (a) the vein of Labbé, which extends from the sylvian fissure posterolaterally to the TS; (b) the vein of Trolard, which runs from the sylvian fissure to the SSS; and (c) the superficial middle cerebral veins, which run along the sylvian fissure.
be often recognized, however: (a) the vein of Labbé, which extends from the sylvian fissure posterolaterally to the TS; (b) the vein of Trolard, which runs from the sylvian fissure to the SSS; and (c) the superficial middle cerebral veins, which run along the sylvian fissure.
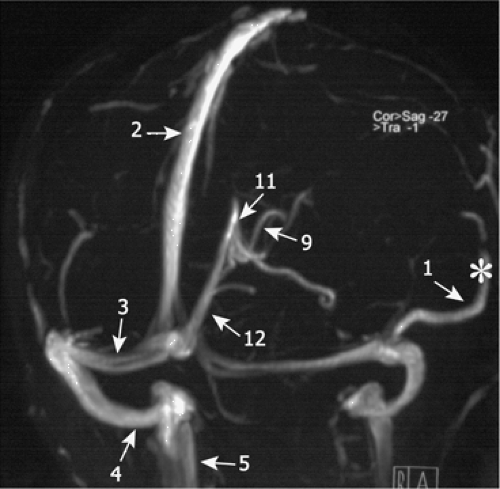 Figure 11-26 2D TOF MRA of the cerebral veins. The numbers refer to Figure 11-25. Cortical veins (1); SSS (2); TS (3); sigmoid sinus (4); jugular vein (5); inferior sagittal sinus; internal cerebral veins (9); vein of Galen (11); straight sinus (12). The ISS is not visualized. The prominent cortical vein is the vein of Labbé (*). |
The deep cerebral veins include the medullary veins, which drain the white matter and course centrally toward the subependymal veins that surround the ventricles. Prominent subependymal veins are the septal veins that run posteriorly from the frontal horn along the septum pellucidum and join near the foramen of Monro with the thalamostriate veins, which course over the caudate nuclei, to form the internal cerebral veins.
The internal cerebral veins course above the roof of the third ventricle and drain into the (unpaired) vein of Galen, which curves under the splenium of the corpus callosum and joins with the inferior sagittal sinus to form the straight sinus. The basal veins of Rosenthal run along the midbrain and drain either into the internal cerebral veins or the vein of Galen. In the posterior fossa, the anterior pontomesencephalic vein lies along the surface of the pons and mesencephalon. The large cerebellar veins are the precentral cerebellar vein and the superior and inferior vermian vein.
Variants and clinical remarks. Although the drainage pattern of the superficial cortical veins and deep veins is highly variable, true anomalies are uncommon.
Clinical Applications of Computed Tomographic and Magnetic Resonance Angiography
Stroke and Atherosclerotic Disease
Clinical Background
Stroke is the third most common cause of death worldwide after myocardial infarction and cancer, and the most common cause for permanent disability in developed countries. The term stroke is commonly used but imprecise. According to the World Health Organization (WHO) definition, stroke describes the rapid onset of a cerebral deficit, which lasts 24 hours or leads to death, with no apparent cause other than vascular. Ischemic stroke is the most common cause, accounting for approximately 80% of all events. Primary intraparenchymal and subarachnoid hemorrhage account for approximately 15% and 5%, respectively. The remainder are due to a miscellany of much rarer causes (e.g., vasculitis, dissection, venous thrombosis) (46).
Numerous classification schemes describing subtypes of ischemic stroke have been proposed. A classification system based on the patient’s neurologic signs, the results of brain imaging, and the findings of ancillary diagnostic tests is widely used. It distinguishes based on etiology large artery or atherosclerotic infarctions, cardioembolic infarctions, and small vessel or lacunar infarctions.
Clinical studies refer to this as the TOAST classification, as it was adopted for the evaluation of patients participating in a trial of low molecular weight heparinoid, the Trial of Org 10172 in Acute Stroke Treatment (47). It should be recognized, however, that it may be difficult in certain clinical settings to determine the clinical subtype, and that many strokes are reported to be of undetermined etiology (48).
The relative frequencies of the stroke subtypes vary from study to study, with incidences of 15% to 40% for large artery or atherosclerotic infarction, 15% to 30% for cardioembolic stroke, and 15% to 30% for lacunar infarctions (46,49).
Atherosclerotic infarctions result from thrombosis directly at the site of atherosclerotic plaque formation or from emboli originating from a plaque that then lodges downstream, causing artery-to-artery embolism. The most common site for atherosclerotic plaque formation is the extracranial circulation, specifically the carotid bifurcation. Another common site of extracranial plaque formation is at the origin of the supra-aortic vessels, including the subclavian and VAs. Common intracranial locations include the carotid siphon, the proximal MCAs and ACAs, the most distal aspects of the VAs, and the BA.
Identification of atherosclerotic stenosis of the major intracranial arteries is important in the workup of a patient with stroke. It is assumed that intracranial arterial stenosis accounts for approximately 10% of ischemic strokes (50). The visualization of a stenosis does not establish the etiology of stroke, however. For example, it had been shown that almost half of the strokes that occur in the territory of a symptomatic carotid appear to be cardioembolic or small artery strokes (51).
Apart from atherosclerosis, numerous other etiologies can lead to large artery thromboembolic stroke. Although these are far less common, they include arterial dissection, vasculitis, and moyamoya disease (discussed in subsequent sections). Hematological disorders that cause hyperviscosity or lead to hypercoagulable state and vasculopathies may also account for large artery territory infarction.
Cardioembolic strokes can be caused by mural thrombus formation in settings of relative stasis (e.g., myocardial infarction or atrial fibrillation or flutter), by valvular heart disease (e.g., development of valvular vegetations, prosthetic valves), or may occur in congenital heart disease.
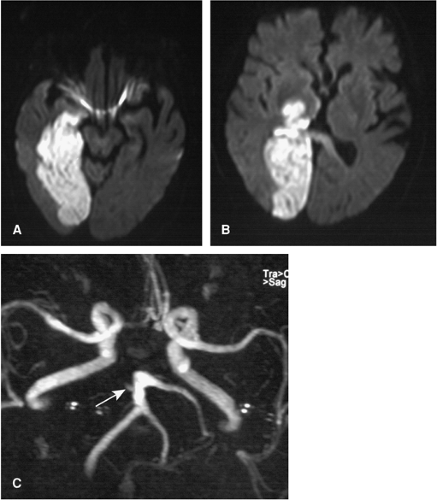 Figure 11-27 A, B: Acute infarction of the entire PCA territory of the right side as displayed on DWI. C: 3D TOF MRA shows an occlusion of the proximal right PCA (arrow). |
Lacunar infarctions are caused by occlusion of small perforating arteries and are generally not larger than 1.5 cm. The perforating arteries in the anterior circulation are the lenticulostriate arteries. In the posterior circulation, the thalamoperforating arteries and the small perforating arteries from the main stem of the BA serve as end vessels. Patients with hypertension and diabetes mellitus are predisposed to lacunar infarctions; however, small vessel infarction can also be a manifestation of nonatherosclerotic etiologies (e.g., collagen-vascular disease and vasculitis).
In the radiological community, the terms territorial infarcts and borderzone infarctions are commonly applied to describe infarct patterns as visualized on CT or MR (Fig. 11-27). Territorial infarctions are confined to the perfusion territory of a cerebral artery. Borderzone infarctions are ischemic lesions situated between two neighboring vascular territories (e.g., between the MCA and PCA territories) (52,53).
Early work suggested that territorial infarctions would likely be embolic from a cardiac source or a carotid plaque, and that lesions restricted to border zones would more likely represent hypotensive events of the most vulnerable tissue in the presence of severe large vessel disease. Continuing research has shown that this concept might be an oversimplification.
In particular, it has been shown by van der Zwan et al. (38,54) that the territorial supply area of the cerebral arteries, and therefore the location of borderzone areas, is individually highly variable. Infarctions formerly classified, based on classical textbook templates, as borderzone infarctions might actually lay entirely within a cerebral territory (55).
The concept of borderzone infarctions was furthermore challenged by the observation that (a) there was no significant difference in the incidence of cortical borderzone infarctions in patients with and without hemodynamic compromise; that (b) borderzone infarctions were rarely the initial manifestation of carotid occlusion, as might be expected for acute low-flow states; and that (c) postmortem examinations revealed emboli as a possible cause of borderzone infarctions (56,57,58).
Only so-called deep borderzone infarctions, small lesions arranged in a linear fashion parallel to the lateral ventricle in the corona radiate or centrum semiovale, seem to correlate with hemodynamic compromise and were seen with a high specificity in patients with carotid occlusion and an increased cerebral oxygen extraction fraction (59).
Stroke treatment has undergone a rapid evolution in the last decade. The most important development has been the recognition of stroke as an acute emergency and the application of acute-phase therapies to improve outcome. This is summed up with the clinical catchphrase “time is brain.”
Of the various therapeutic options available, the administration of intravenous (IV) recombinant tissue plasminogen activator (tPA) within the first 3 hours after stroke is the only thrombolytic therapy approved by the U.S. Food and Drug Administration (60). The approval was based on the results from randomized study of IV tPA versus placebo in the American National Institute of Neurological Disorders and Stroke trial (NINDS) (61).
Patients randomized to IV tPA had, depending on the clinical outcome parameter applied, an 11% to 13% increase in the rate of minimal or no disability compared with those who had received placebo. Despite the higher rate of symptomatic intracranial hemorrhage in the tPA group (6%) versus the placebo group (0.6%), there was no significant difference in mortality between the groups.
Three additional trials, the European Cooperative Acute Stroke Studies (ECASS I and II) and the Acute Noninterventional Therapy in Ischemic Stroke (ATLANTIS), evaluated the use of IV tPA in extended time windows of up to six hours (62,63,64). All had negative results, with no substantial benefit to IV tPA therapy demonstrated beyond three hours of stroke onset using the predetermined primary endpoints of the study.
The debate about tPA treatment of patients remains a matter of intense discussion, however. On the one hand, it has been pointed out that many patients with symptoms of acute ischemic stroke may not have occlusive thromboembolism (65). Thus, many patients might receive a potentially dangerous drug although they do not have the disease for which the drug is intended. On the other hand, given the three-hour window, more than 95% of all patients presenting with symptoms of acute stroke will not be eligible for tPA treatment (66).
Intra-arterial (IA) thrombolysis, as compared with IV therapy, has the advantage that during cerebral angiography, clot lysis can be directly assessed. Since the first report in 1983 (67), numerous case series have been published, with minimal or no neurologic deficit reported in 15% to 75% (68). The rate of complete or partial recanalization was on average 40% and 35%, respectively, and higher than those of IV thrombolysis.
The Prolyse in Acute Cerebral Thromboembolism (PROACT II) showed a benefit of IA thrombolysis up to six hours after ischemic stroke onset (69). The trial randomized patients with MCA thromboembolic occlusion into two arms: (a) IA thrombolytic therapy with prourokinase and low-dose IV heparin, and (b) low-dose IV heparin alone. Despite a higher rate of symptomatic intracranial hemorrhage, treatment with the IA thrombolytic therapy improved the clinical outcome.
Moreover, additional therapeutic protocols for thrombolytic therapy, such as combination of IV and IA therapy, are being evaluated (70). Other therapeutic tools, such as mechanical recanalization of vessels or the administration of neuroprotective drugs to reduce the volume of infarcted tissue, are under investigation.
Apart from efforts to evaluate and optimize the treatment of acute stroke, large efforts are undertaken as well to improve the secondary prevention of stroke. These include optimization of treatment plans for patients presenting with the thromboembolic risk factor of an extracranial or intracranial atherosclerotic vascular lesion. Large multicenter trials have established the efficacy to treat extracranial carotid atherosclerosis with endarterectomy, and current trials compare surgical approaches with endovascular treatment utilizing stents (71,72).
In an effort to reduce the rate of stroke in symptomatic patients with intracranial stenosis of over 50%, the
Warfarin-Aspirin Symptomatic Intracranial Disease (WASID) trial examines the effects of aspirin versus warfarin (50). This study aims to identify patients whose rate of stroke on the best medical therapy is sufficiently high to warrant intracranial angioplasty/stenting.
Warfarin-Aspirin Symptomatic Intracranial Disease (WASID) trial examines the effects of aspirin versus warfarin (50). This study aims to identify patients whose rate of stroke on the best medical therapy is sufficiently high to warrant intracranial angioplasty/stenting.
Imaging Strategies
Acute stroke must be regarded as a medical emergency. The diagnosis of stroke by specialists is reasonably accurate on clinical grounds alone, but in general medical and emergency settings, up to 20% of patients with suspected stroke turn out to have another diagnosis (46,73). As infarction cannot be reliably distinguished from these additional diagnoses, brain imaging plays a pivotal role in the initial workup. The exclusion of hemorrhagic stroke and of lesions that can clinically mimic ischemic stroke (e.g., subdural hematoma, cerebritis, or tumor) remains a major contribution of the radiologist in the setting of acute stroke.
CT is the imaging modality of choice at most institutions for the evaluation of patients in the initial hours of acute stroke because of its widespread availability, rapid acquisitions, capacity to evaluate often uncooperative patients, and the ease of excluding intracranial hemorrhage.
In most cases, a normal unenhanced CT scan is observed within the first 2 to 3 hours; however, some early signs may allude to underlying vascular pathology (Fig. 11-28). These include obscuration of the lentiform nucleus, the insular ribbon sign, and the “hyperdense” media sign or “dot sign.” The lentiform nucleus is supplied by the lenticulostriate branches of the MCA, which are end vessels, and are therefore prone to early irreversible damage after proximal MCA occlusion. The insular ribbon sign refers to relative hypoattenuation of
the insular cortex. The insula is distal to potential collateral supply from the PCAs in the early stage of MCA occlusion and thus is susceptible to early damage. If the MCA is occluded by a fresh thrombus, it may appear as hyperintense relative to the normal contralateral MCA, hence the hyperdense media sign. This sign has a high specificity but a sensitivity of only about 30%. Thrombosis of more distal branches might also be visible as hyperattenuating dots, termed the dot sign (74).
the insular cortex. The insula is distal to potential collateral supply from the PCAs in the early stage of MCA occlusion and thus is susceptible to early damage. If the MCA is occluded by a fresh thrombus, it may appear as hyperintense relative to the normal contralateral MCA, hence the hyperdense media sign. This sign has a high specificity but a sensitivity of only about 30%. Thrombosis of more distal branches might also be visible as hyperattenuating dots, termed the dot sign (74).
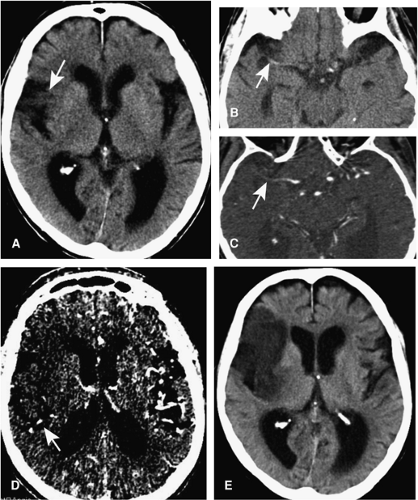 Figure 11-28 Three hours after the clinical onset of a right hemispheric stroke, unenhanced CT shows (A) a hypoattenuation of the insular cortex (arrow) and (B) a positive media sign (arrow). On (C), an axial CTA source image, the MCA is not opacified in the M2 segment (arrow). A source image (D) with a narrow window setting depicts a hypoattenuation of a large area of the MCA territory. Pial vessels are only visualized on the posterior aspect of the area (arrow). Unenhanced CTA five days later (E) reveals a large infarct in the anterior part of the MCA territory. The territory of the perforating vessels that arise from the M1 segment of the MCA have been spared from infarction. The posterior aspect of the MCA territory was most likely supplied by collateral supply via cortical branches of the PCA. |
Conventional MR images are more sensitive and specific than CT for acute cerebral ischemia. Findings include hyperintense signal on T2-weighted images, mass effect in the area of infarction, loss of arterial flow voids, and stasis of contrast material within vessels in affected territories following contrast material administration. As with CT, within the first hours, false negative studies might be seen with MR.
The introduction of diffusion-weighted imaging (DWI), however, revolutionized imaging of patients with (hyper)-acute stroke by demonstrating areas of restricted water movement that occur during the initial onset of ischemia, while T2-weighted images still show a normal appearance (Fig. 11-27) (75). MRI furthermore allows the exclusion of intracranial hemorrhage and possibly the definitive diagnosis of subarachnoid hemorrhage as well (76,77,78).
The large randomized studies of thrombolysis in stroke as mentioned earlier have been based on unenhanced CT findings exclusively. However, the state-of-the-art CT and MR methods can provide more than information on morphological aspects of the brain parenchyma or indirect signs of vessel occlusion. They can now provide information about the perfusion of the brain parenchyma—the microvasculature—and can give detailed information on the larger arteries of the brain—the macrovasculature.
For a comprehensive CT imaging of acute stroke, the unenhanced CT is therefore followed by a perfusion CT examination, which permits the differentiation of irreversibly damaged brain tissue from reversibly impaired “tissue at risk” by assessing changes of cerebral blood flow and volume, and by the CTA examination to assess the cerebral arteries (79,80).
With MR, the combination of DWI with perfusion imaging was found to be of considerable interest in identifying the ischemic yet viable and not fully infarcted areas of the brain surrounding an infarct core (81). For example, it is assumed that in cases where the area of the diffusion abnormality is smaller than the area of reduced perfusion, the area with normal diffusion but decreased perfusion may represent the potentially salvageable tissue, or tissue at risk—that is, the “ischemic penumbra” (82,83).
Several studies have demonstrated the feasibility and the practicality of performing these advanced imaging methods in clinical settings and the use of information obtained to triage patients before therapy (81,84,85). The driving force behind the application of these advanced imaging techniques is to optimize and tailor treatment to the needs of the individual patient in the acute stroke setting. A longer time window of up to 6 hours or even 24 hours might be safe if the decision to treat a patient is not based solely on findings of unenhanced CT, but rather incorporates the additional input from CTA or MRA to assess vessel occlusion and the information about tissue perfusion (86,87,88).
Stay updated, free articles. Join our Telegram channel

Full access? Get Clinical Tree


