Cardiac Radiography: Introduction
As discussed in other chapters in this text (see Chaps. 18, 19, 20, 21, 22, 23, 24, 25), the relatively low-cost chest radiograph is less commonly used as a primary diagnostic technique for determining the presence and severity of cardiac disease even when it provides diagnostic information (eg, pulmonary venous hypertension).
With the development of many new cardiac imaging techniques, familiarity with the altered anatomy and understanding of the underlying pathophysiology of a diseased heart are the cornerstones to appropriate interpretation of its radiographic manifestations. The conventional four-view cardiac series is tabulated in Table 17–1 and the views are illustrated in Fig.17–1C–F.
FIGURE 17–1
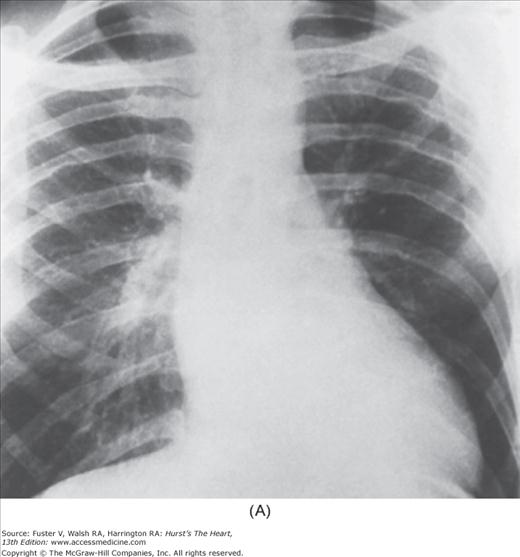
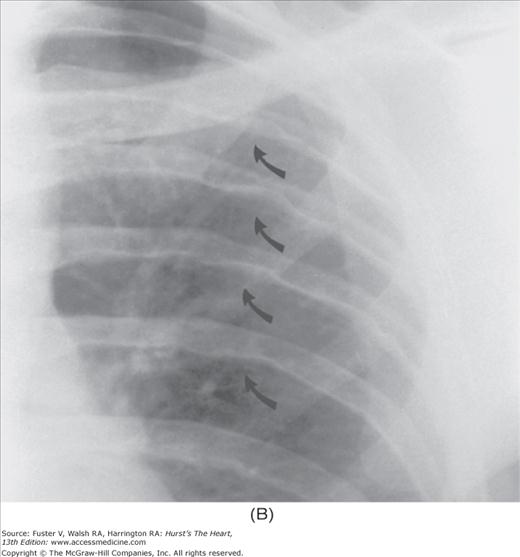
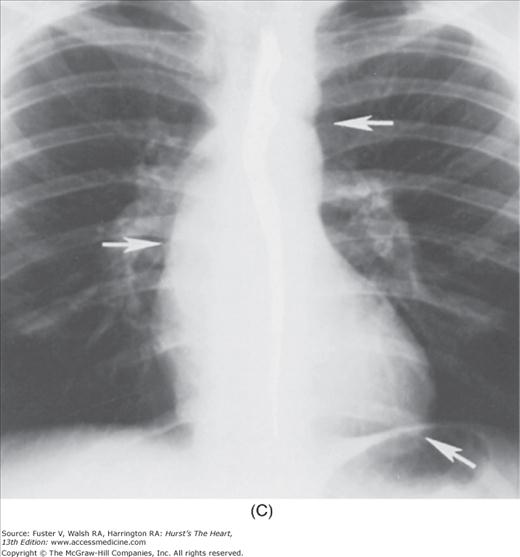
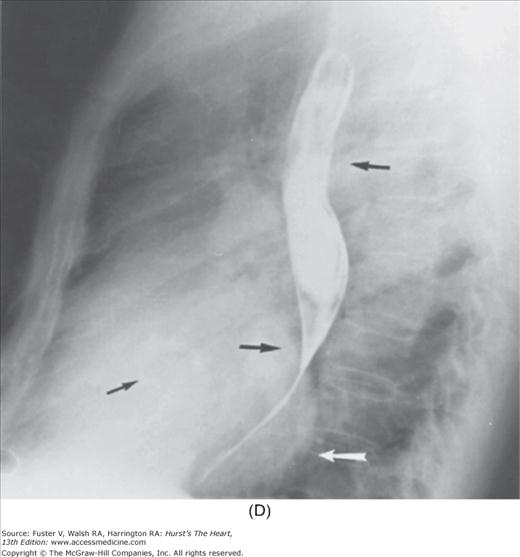
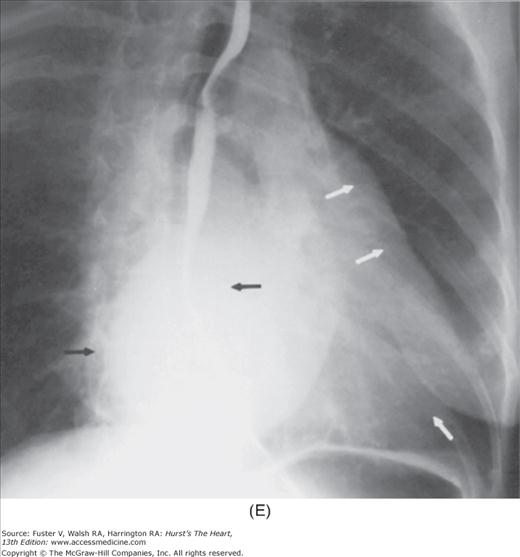
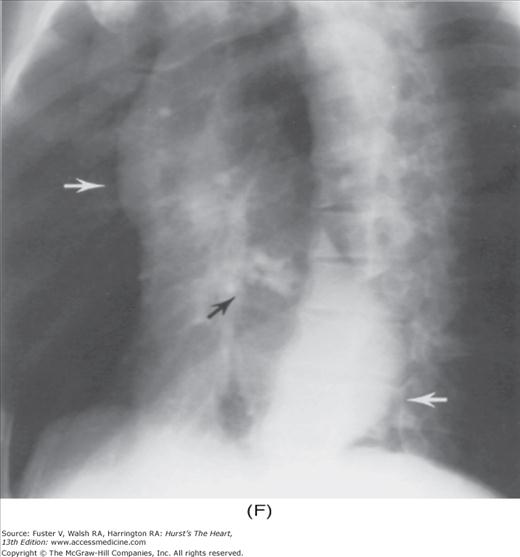
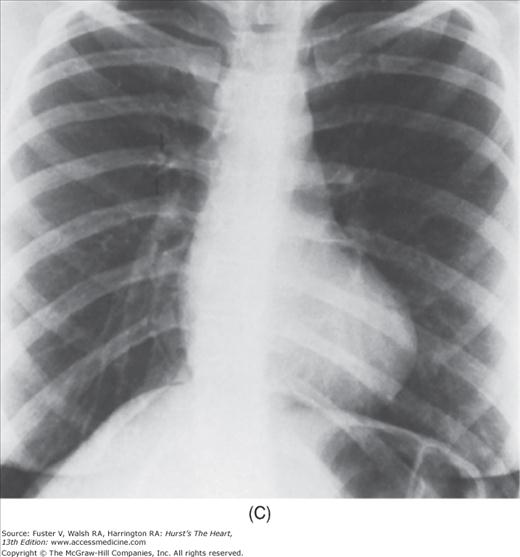
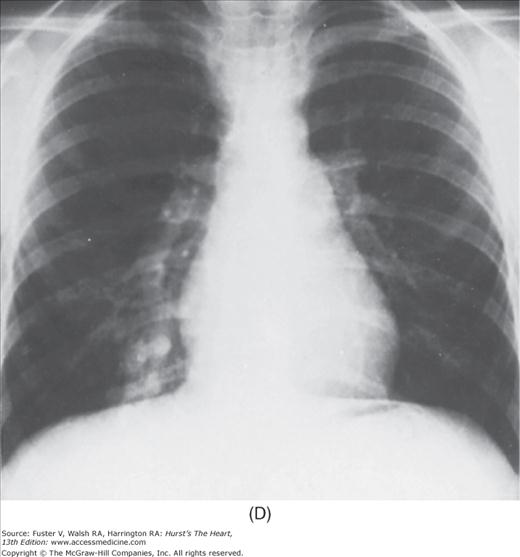
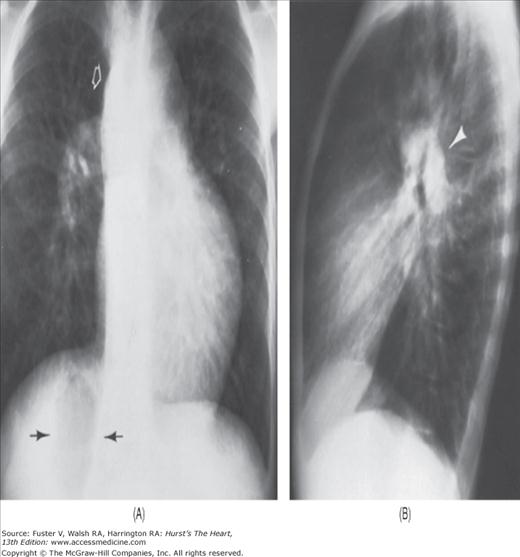
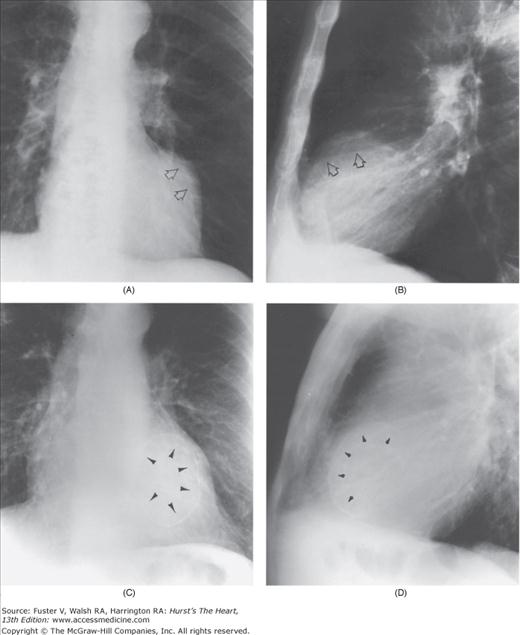
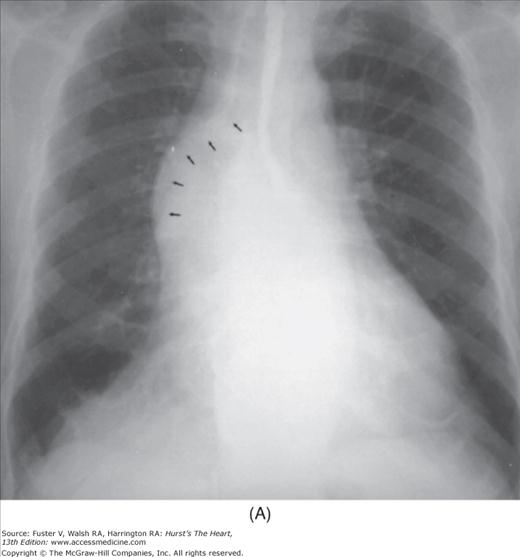
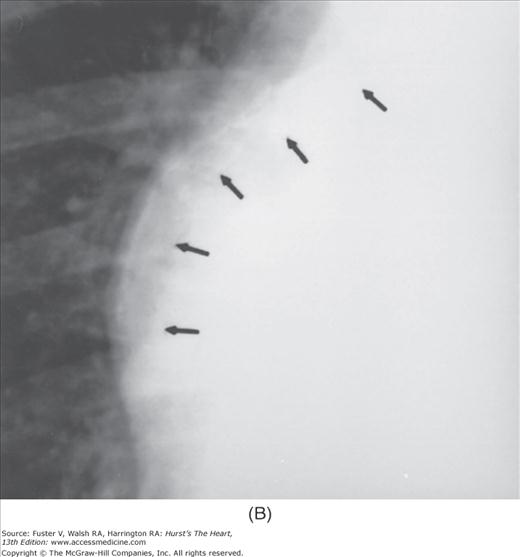
Practical application of four-view cardiac series. A. Posteroanterior (PA) view in a patient with coarctation of the aorta showing areas of rib notching bilaterally and left ventricular (LV) enlargement in the inferior and leftward direction. B. Magnified view of the left upper thorax of the same patient showing multiple areas of rib notching (arrows). C. PA view of another patient with aortic coarctation showing the 3 sign of the deformed descending aorta and E sign on the barium-filled esophagus. The upper arrow points to the level of coarctation, and the lower arrow marks the apex of the enlarged LV. The arrow on the patient’s right indicates the dilated ascending aorta. D. Lateral view of a third patient with the same disease showing a barium-filled esophagus to be pushed forward (upper arrow) by the poststenotic dilatation of the descending aorta and pushed backward (middle arrow) by the enlarged left atrium (LA). The very large LV (lower arrow) simply casts a shadow behind the esophagus without displacing it. The oblique arrow points to the calcified stenotic bicuspid aortic valve. E. Right anterior oblique view of the same patient whose PA view is shown in Fig. 17–7D. Note the huge right atrium (RA) casting a triangular density (lower horizontal arrow) behind the esophagus without displacing it. The esophagus is deviated posteriorly by the enlarged LA (upper horizontal arrow). The upper oblique arrows indicate the direction of the enlarging pulmonary trunk and right ventricle (RV). The lower oblique arrow points to the normal LV with the undisturbed left costophrenic sulcus. F. Left anterior oblique view of a patient with valvular aortic stenosis. The dilated ascending aorta (upper white arrow) is immediately above the flat anterior border of a normal RV. The black arrow points to the calcified aortic valve. The lower white arrow marks the enlarged LV.
The approach to the chest radiograph should be thorough and objective so that no clue is overlooked and no bias is incorporated in the process of radiographic analysis.1-4 Rib notching (Fig. 17–1A,B) provides important clues to the diagnosis of coarctation of the aorta.3,5 To prevent erroneous clinical information from misleading the radiographic interpretation, films should initially be interpreted without any knowledge about the patient.
A secundum atrial septal defect (ASD) can be incorrectly diagnosed as mitral stenosis (MS) because of similar physical signs. The split-second sound can be misinterpreted as the opening snap (see Chap. 14). The diastolic rumble caused by the increased flow through a normal tricuspid valve can mimic the murmur of MS. The radiographic signs of the two entities, however, are quite different (Fig. 17–2B vs 17–3A). The final radiographic diagnosis, however, should be made only after correlating the radiographic findings with clinical information and other laboratory data.6
FIGURE 17–2
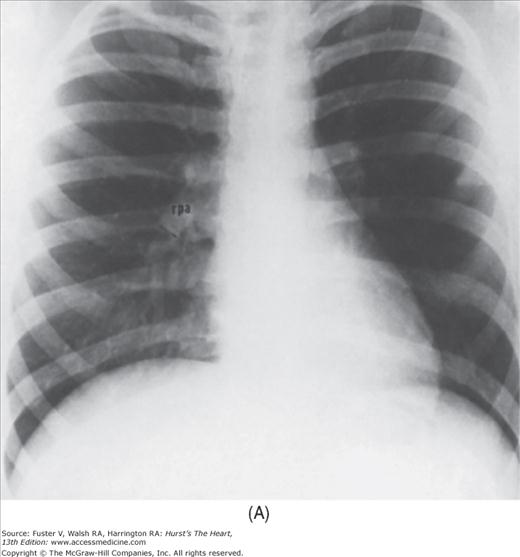
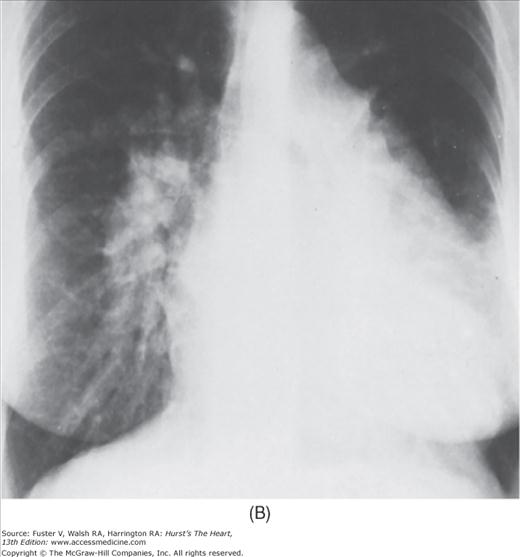
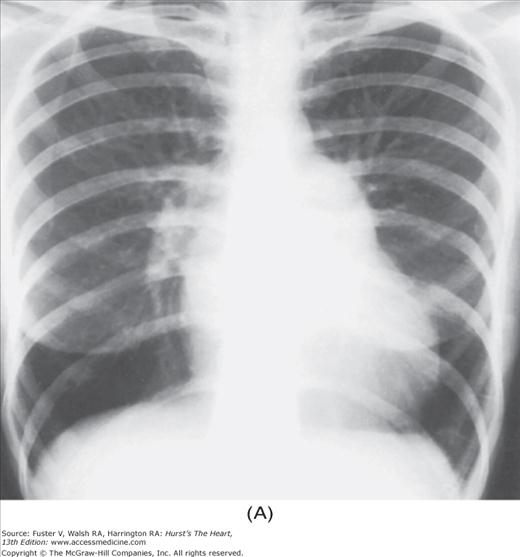
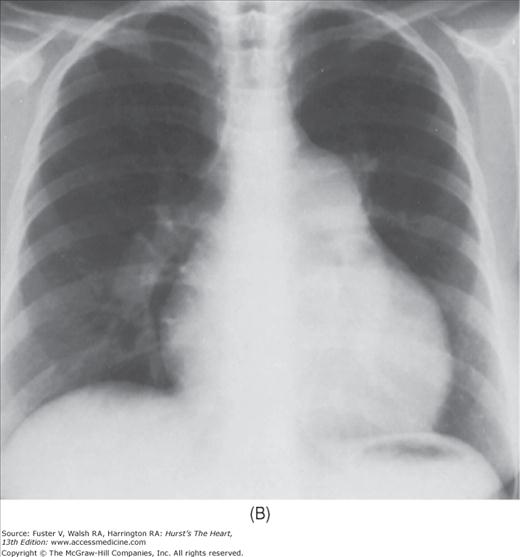
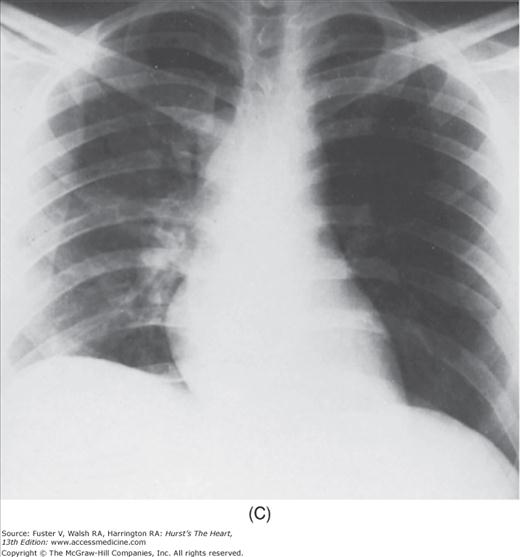
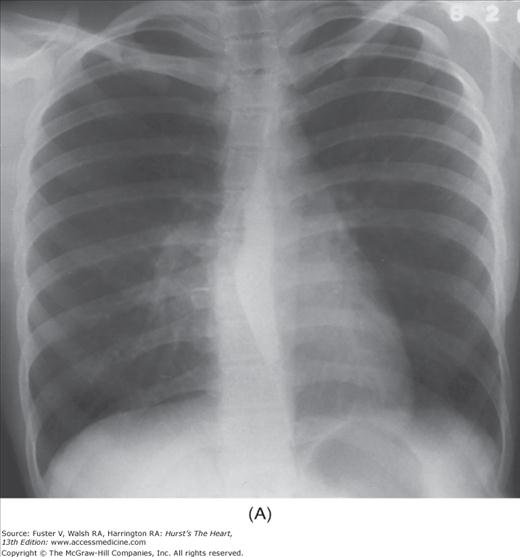
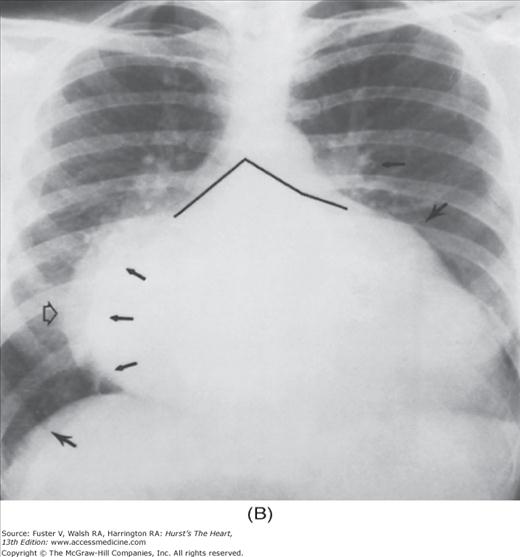
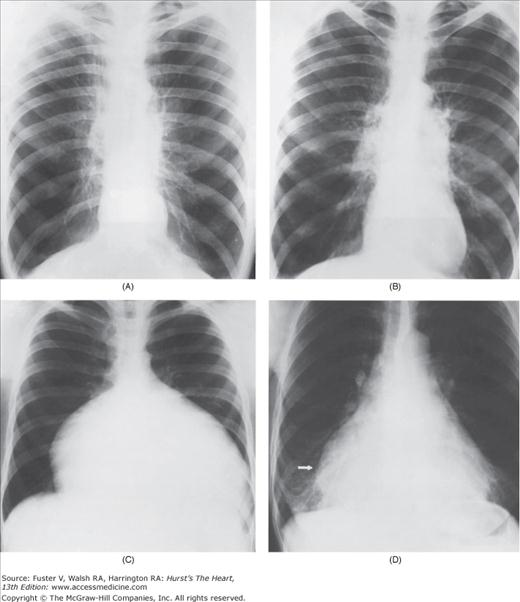
Radiographic assessment of the volume of pulmonary blood flow (PBF). A. Normal PBF. There is caudalization of the pulmonary vascularity because of gravity. The right descending pulmonary artery measures 13 mm in diameter in this young man. B. Increased PBF. Patient with a secundum atrial septal defect showing uniform increase in pulmonary vascularity bilaterally. The right descending pulmonary artery is markedly enlarged, measuring 27 mm. C. Decreased PBF. Patient with tetralogy of Fallot showing a boot-shaped heart and uniform decrease in pulmonary vascularity. The right descending pulmonary artery is much smaller than normal, measuring 6 mm in diameter.
The radiographic examination for heart disease consists of five major steps. They are (1) radiographic examination for anatomy, (2) comparison of serial studies, (3) statistical guidance, (4) clinical correlation, and (5) conclusion (Table 17–2).
| Radiographic examination for anatomy |
| Overview, eg, rib notching |
| Pulmonary vascularity, eg, shunt vascularity in ASD |
| Lung parenchyma, eg, ossification in critical MS |
| Cardiac size, eg, huge right heart in Ebstein anomaly |
| Cardiac contour, eg, boot-shaped heart in ToF |
| Abnormal densities, eg, calcification of LV aneurysm |
| Abnormal lucency, eg, conspicuous fat stripes in PE |
| Cardiac malpositions, eg, dextrocardia with SS |
| Other abnormalities, eg, Holt-Oram syndrome |
| Fluoroscopic observation for dynamics |
| Comparison of serial studies |
| Statistical guidance |
| Clinical correlation |
| Conclusion |
Radiographic Examination for Anatomy
The first step is to survey the radiograph and assess all the structures, searching particularly for noncardiac conditions that can reflect heart disease. For instance, a right-sided stomach with an absent image of the inferior vena cava (IVC) suggests the possibility of congenital interruption of the IVC with azygos continuation7,8 (Fig. 17–4). A narrowed anteroposterior (AP) diameter of the thorax can be the cause of an innocent murmur9 (Fig. 17–5).
FIGURE 17–3

Abnormal pulmonary blood flow (PBF) patterns. A. Cephalization. Patient with severe mitral stenosis showing dilatation of the upper vessels with constriction of the lower vessels. B. Centralization. Patient with primary pulmonary hypertension showing marked dilatation of the pulmonary trunk and the central segments of both pulmonary arteries with pruning of the peripheral branches. C. Lateralization. Patient with massive pulmonary embolism obstructing the left main pulmonary artery. Note the uneven distribution of PBF between the two lungs in favor of the right. D. Localization. A cyanotic child showing localized vascular changes representing a large pulmonary arteriovenous fistula in the right lower lobe. E. Collateralization. A child with pseudotruncus arteriosus with cardiomegaly and a right aortic arch (small arrow). Note severe pulmonary oligemia with numerous small tortuous vessels (large arrow) in the upper medial lung zones, representing bronchial arterial collaterals.
FIGURE 17–4
Patient with situs ambiguus, interruption of the inferior vena cava (IVC), ventricular septal defect, and polysplenia. A. Posteroanterior view shows that the aortic arch and the heart are left sided and the stomach (lower arrows) is right sided. The azygos vein (upper arrow) is markedly enlarged. The heart is mildly enlarged, and there is a moderate increase in pulmonary vascularity. B. The lateral view shows an absent image of the IVC. The azygos arch (arrow) is markedly dilated.
FIGURE 17–5

A 16-year-old girl with straight-back syndrome. A. The posteroanterior radiograph shows normal pulmonary vascularity and normal heart size. Note the leftward displacement and rotation of the heart, making its left border unusually prominent. B. The lateral view shows that the anteroposterior diameter of the chest is extremely narrow. The heart is squeezed, creating an innocent murmur.
The lung can often reflect the underlying pathophysiology of the heart. For example, if uniform dilatation of all pulmonary vessels is present, the diagnosis of a left-to-right shunt (see Fig. 17–2B) is more likely than a left-sided obstructive lesion. The latter typically shows a cephalic pulmonary blood flow (PBF) pattern (see Fig. 17–3A).
With right heart failure, the lungs become unusually radiolucent because of decreased PBF. Conversely, significant left heart failure is characterized by the presence of pulmonary edema, a cephalic blood flow pattern, or both (Fig. 17–6). Long-standing, severe pulmonary venous hypertension can lead to hemosiderosis or ossification of the lung (or both).10,11 When right heart failure results from severe left heart failure, the preexisting pulmonary congestion can improve because of the decreased PBF (see Fig. 17–6B).
FIGURE 17–6


Radiographic appearance of left heart failure. A. Acute. Patient with acute mitral regurgitation because of rupture of chordae tendineae showing the “bat-wings“ appearance of a severe alveolar type of pulmonary edema and a normal-sized heart. B. Chronic. Patient with severe mitral and tricuspid regurgitation and mild aortic regurgitation. This is a predominantly left-sided failure pattern. Note the gross cardiomegaly with striking cephalization and interstitial pulmonary edema. The giant left atrium forms the right cardiac border (open arrow), makes its appendage bulge outward on the left side (upper large arrow), and splays the mainstem bronchi wide apart (solid lines). The huge right atrium forms a double density within the right cardiac border (three small arrows). The smallupper arrow marks the peribronchial cuffing of edema fluid. The large lower arrow points to multiple Kerley B lines. C. Magnified view of right costophrenic sulcus showing multiple Kerley B lines (arrow). D. A 44-year-old woman with severe mitral stenosis (MS). The radiograph shows a diffuse stippling with fine nodules representing hemosiderosis. Hemosiderin-laden macrophages were found in her sputa. E. Posteroanterior radiograph of a 63-year-old man with severe MS, status post–mitral-valve replacement, shows multiple scattered bony nodules (arrows) 2 to 10 mm in diameter throughout the lower two-thirds of both lungs, compatible with pulmonary ossification.
An enlarged heart is always abnormal; however, mild cardiomegaly may reflect a higher-than-average cardiac output from a normal heart, as seen in athletes with slow heart rates. The cardiothoracic ratio remains the simplest yardstick for assessment of cardiac size1; the mean ratio in the upright posteroanterior (PA) view is 44%.
The nature of cardiomegaly can often be determined by the specific radiographic appearance. As a rule, when the PBF pattern remains normal, volume overload tends to present a greater degree of cardiomegaly than lesions with pressure overload alone. For example, patients with aortic stenosis (AS) typically show features of left ventricular hypertrophy (LVH) without dilatation. Conversely, the left ventricle (LV) both dilates and hypertrophies in the case of aortic regurgitation (AR), producing a much larger heart even before the development of heart failure.
A smaller-than-average heart is encountered in patients with chronic obstructive pulmonary disease (COPD; Fig. 17–7A), Addison disease, anorexia nervosa, and starvation. An abnormally small heart, however, is difficult to define except retrospectively after successful therapy.
Any significant deviation from the normal cardiovascular contour can be a clue to the correct diagnosis. For instance, coeur en sabot, a “boot-shaped heart“ (see Fig. 17–2C), is characteristic of tetralogy of Fallot (ToF). A bulge along the left cardiac border with a retrosternal double density is virtually diagnostic of LV aneurysm (Fig. 17–8). A markedly widened right cardiac contour with a straightened left cardiac border is seen frequently in patients with severe MS leading to tricuspid regurgitation (TR) (see Fig. 17–7D).
Besides the familiar double density cast by an enlarged left atrium (LA), other increased densities can be found within the cardiac shadow, indicating a variety of dilated vascular structures (eg, tortuous descending aorta, aortic aneurysm, coronary artery aneurysm, pulmonary varix).2 Furthermore, large cardiac calcifications are readily seen in lateral and oblique views. If smaller calcific deposits are suspected, they should be verified promptly, ruled out by cardiac fluoroscopy or computed tomography (CT; see Chap. 22). Any radiologically detectable calcification in the heart is clinically important. In general, the heavier the calcification, the more significant it becomes (see Fig. 17–1F). The extent of valvular calcification tends to be proportionate to the severity of the valve stenosis regardless of the other radiographic signs of the disease.1,2,12,13 Calcification of the coronary artery is almost always atherosclerotic in nature. A fluoroscopically detectable coronary calcification correlates with major vessel occlusion in 94% of patients with chest pain14; however, the sensitivity of the test is only 40%.
Recently, electron-beam CT (EBCT) scanning has proven to be a sensitive method for detection and quantifying coronary calcifications (see Chaps. 22 and 64). Although a negative result can indicate no need for further testing in asymptomatic individuals, a positive result does not necessarily denote severe obstructive coronary artery disease (CAD). The sensitivity for detecting any coronary calcifications is greater than 95% with a specificity of less than 65% for significant coronary artery luminal stenosis. A calcified ascending aortic aneurysm with AR is highly suggestive of syphilitic aortitis15 (Fig. 17–9).
FIGURE 17–7
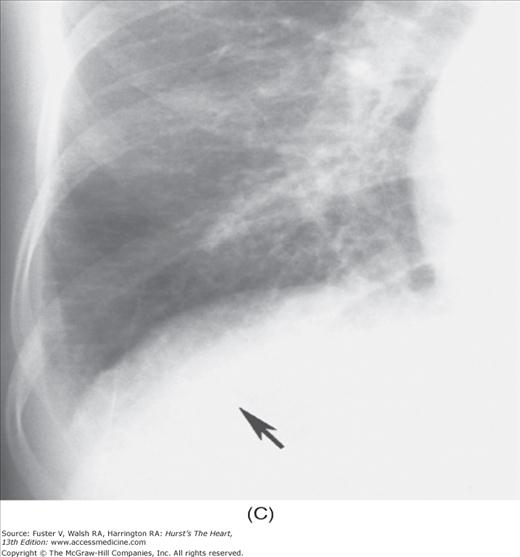
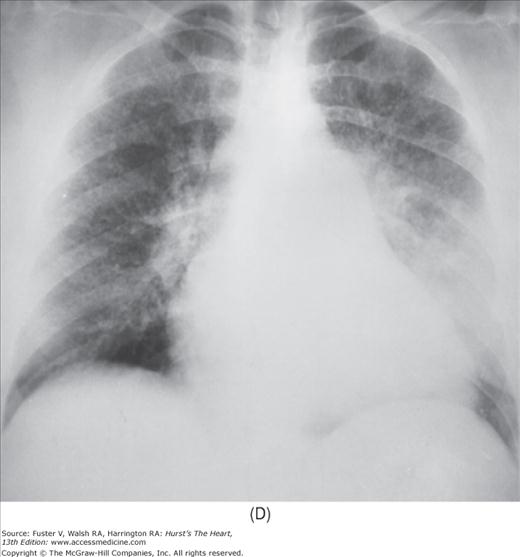
Radiographic appearance of right heart failure. A. A patient with severe obstructive emphysema showing overaeration of the lungs, centralized flow pattern, and a small heart size. B. Three years later, the patient was in frank right heart failure. Note that the heart got bigger as his emphysema got worse. The centralized flow pattern became more severe. C. Patient with Ebstein anomaly showing gross cardiomegaly with severe decrease in pulmonary vascularity. The right cardiac border represents the huge right atrium (RA), and the left cardiac border represents the giant right ventricle. D. Patient with mitral stenosis showing a giant RA (arrow) representing severe functional tricuspid regurgitation caused by unrelenting left-sided failure. The pulmonary venous congestion had improved after the onset of right-sided heart failure.
FIGURE 17–8
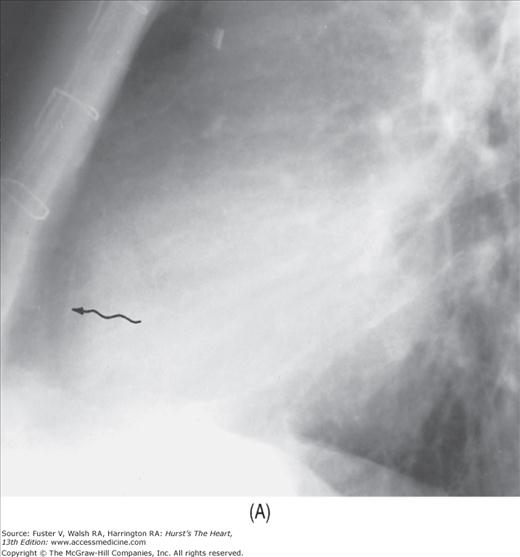
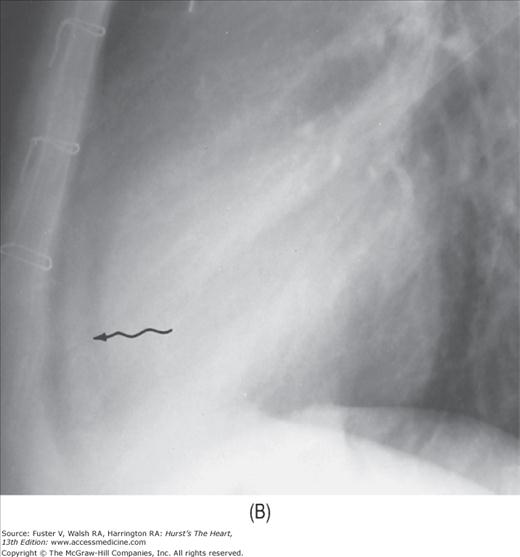
Left ventricular aneurysms. A. Posteroanterior (PA) view shows a localized bulge (arrows) along the left cardiac border representing a left ventricular (LV) aneurysm from the anterolateral wall. B. Lateral view shows a double density with sharp borders anteriorly and superiorly (arrows). This is the LV aneurysm that casts a shadow on the normal right ventricle (RV). Fluoroscopically, it is easy to confirm its origin and to separate it from the RV by rotating the patient under direct vision. C. PA view of a second patient, a 69-year-old man, shows total calcification of an anterolateral apical LV aneurysm (arrows). D. Lateral view shows the same (arrows).
FIGURE 17–9
A 71-year-old woman with syphilitic aortitis. A. The posteroanterior radiograph shows a huge, calcified ascending aortic aneurysm (arrows). In addition, the entire aorta and the left ventricle are markedly dilated, compatible with severe aortic regurgitation . B. A magnified view of the ascending aorta shows the calcified aneurysm to better advantage. From Chen15 with permission.
The abnormal lucent areas in and about the heart include (1) displaced subepicardial fat stripes caused by effusion or thickening of the pericardium (Fig. 17–10), (2) pneumopericardium (Fig. 17–11), and (3) pneumomediastinum. Pneumomediastinum is differentiated from pneumopericardium by the fact that the former shows a superior extension of the air strip beyond the confines of the pericardium.
FIGURE 17–10
Developing pericardial effusion in 2 weeks. A. A magnified view of the retrosternal area showing the hairlike normal pericardium (arrow) sandwiched between the subepicardial fat stripe interiorly and the mediastinal fat stripe exteriorly. The maximal width of normal pericardium is 2 mm. B. The same patient 2 weeks later, with moderate pericardial effusion. The pericardial cavity now measures more than 1 cm in width (arrow).
Cardiac malpositions are diagnosed only when either the heart or the stomach is out of the normal left-sided position. This definition is crucial in distinguishing an isolated right-sided aortic arch from a cardiac malposition.7,8
Recently, the term dextrocardia has been used to indicate any congenital right-sided heart regardless of the position of abdominal viscera. Dextrocardia with situs inversus indicates the mirror image of normal. In this situation, the incidence of congenital heart disease is only 5%, a nine-fold increase over the general population. The combination of dextrocardia, sinusitis, and bronchiectasis is known as the Kartagener triad.
Stay updated, free articles. Join our Telegram channel

Full access? Get Clinical Tree


