INTRODUCTION AND GENERAL COMMENTS
Cardiac magnetic resonance (CMR) has made incredible advances in the past 10 years and has become integrated into the management and care of the patient with congenital heart disease (CHD) in the 21st century. Its role in pre- and postoperative management of the patient with CHD is a useful adjunct to echocardiography and cardiac catheterization, adding significant clinical information which the other imaging modalities cannot and many times, supplanting the need for those techniques. Many times, this information can change the care of the child. In most instances, all anatomic data necessary for diagnosis and much of the physiologic information needed can be obtained through CMR. With all the choices today with regard to imaging type, choosing the correct modality or combination of modalities is important.
Table 73.1 displays the distinct advantages CMR has over both echocardiography and cardiac catheterization as well as its limitations. For example, because patient size plays an important role in the ability of echocardiography to visualize structures, CMR has a distinct advantage in the older child, adolescent, and adult. On the other hand, patients with pacemakers, in general, and some types of coils and stents cannot be placed in the scanner due to patient safety issues (although patients with pacemakers can be studied in selected patients in highly specialized centers). Some coils can give major artifacts. There is a lot to sort out in the choice of imaging modalities.
Anatomically, in complex CHD, the overlapping of structures in angiography or the “sweeps” utilized in echocardiography may not be sufficient to conceptualize the total anatomic picture. CMR is inherently a three-dimensional (3D) imaging technique and as such, whether they are a stack of steady-state free precession (SSFP) images obtained in contiguous, parallel slices, or a 3D slab obtained with a gadolinium (CMR contrast agent) injections, software can reformat the volumetric data set in any desired plane to demonstrate the salient points of the anatomy. Even “curved plane’s” are utilized clinically. Volume rendering of the 3D slab can create a 3D image which can be rotated, sliced, and manipulated in a myriad of ways to view the anatomy. Routine use of “dynamic” 3D contrastenhanced CMR, where a 3D image slab can be obtained in just over a second, adds temporal information to a formerly static technique; gadolinium is injected in the periphery and its path is visualized as the bolus courses through the cardiovascular system (similar to a peripheral injection of iodinated contrast dye and fluoroscopy). The technique of T2 prepared SSFP utilizing the navigator technique, generally utilized for coronary imaging, can be utilized at times for 3D imaging of the entire thoracic cardiovascular tree.
Another strength of CMR lies in its ability to delineate physiology and function in 3D. Using through plane phase-contrast velocity mapping, flows in any vessel rather than simply velocities (as in echocardiography) are obtained. Using cine imaging, ventricular volumes rather than simple linear dimensions (as in echocardiography) can be measured; CMR is the “gold standard” for measuring ventricular volumes and mass. In addition, a CMR image is typically averaged over multiple heartbeats (unlike echocardiography and angiography, a single CMR image can be averaged over two to many hundreds of heartbeats) and therefore, the functional analysis by CMR reflects many heartbeats embedded in the image yielding a much more realistic reflection of the physiologic state of the patient. In echocardiography, for example, the physician would have to perform this averaging “in his head”; it would be as if an echocardiographer would need to measure 75 Doppler velocities to be the equivalent of one velocity by CMR. It should be noted, however, that “real time” as well as “interactive” CMR is in routine clinical use, and this allows for instantaneous imaging typical of echocardiography and cardiac catheterization. Exercise and functional CMR makes much use of this technique.
In addition, CMR has the ability to “tag” myocardial tissue to calculate regional wall motion and strain, similar to speckle tracking by echocardiography and “tag” blood to visualize its course. Furthermore, myocardial velocimetry, the application of phase-contrast velocity mapping, is similar to Doppler tissue imaging by echocardiography where myocardial velocities can be measured. The advantage of both these CMR techniques over echocardiography, once again, is in its ability to determine all these parameters in 3D.
In a third broad category of CMR ability, tissue characterization plays a major role (the other two categories being anatomy and physiology/function). Viability, also called delayed enhancement, allows for identification of myocardial scar tissue and surgical patches after injection of gadolinium and a delay of approximately 10 minutes. In contrast to an injection and a subsequent delay in imaging, first pass myocardial perfusion imaging utilizing gadolinium can be used in conjunction with adenosine and is equal to nuclear techniques, which involve ionizing radiation and have less tissue contrast and resolution (“dynamic” 3D contrast-enhanced CMR mentioned above can be used to assess regional lung perfusion). Using a whole host of CMR techniques, cardiac tumors can be evaluated highly accurately (including delayed enhancement) and the “Lake Louis Criteria,” which utilizes T
2 imaging for myocardial edema, T
1 imaging before and after gadolinium injection for hyperemia/capillary leak and delayed enhancement for myocardial scar, has a high sensitivity and specificity for the diagnosis of myocarditis.

imaging is a technique that allows for the determination of iron deposition in the myocardium, useful in disease states such as thalassemia and sickle cell disease to monitor and alter chelation therapy.
CARDIAC MAGNETIC RESONANCE PHYSICS AND CARDIAC MAGNETIC RESONANCE TECHNIQUES
The detailed physics of CMR image generation is beyond the scope of this text; however, the general concept is not. A powerful magnet, most commonly on the order of 1.5 Tesla and sometimes 3 Tesla, is used to align the spins of the hydrogen atoms in the body and a radiofrequency pulse (electromagnetic energy) combined with a special magnetic field which creates a magnetic “gradient” is used to perturb a small percentage of these molecules in a specific part of the body into a higher energy state. When the radiofrequency pulse is turned off, the hydrogen atoms from that part of the body return to their normal state, releasing energy in the process. This energy is then collected and analyzed by a complex series of mathematical computations to yield one line of data in what is called “K-space.” By repeating this process many times, many lines of K-space are obtained and through a process involving “Fourier transformation,” the lines of K-space are translated into lines in an image. The image itself is divided into a checkerboard [matrix] with each box called a voxel (the image is of a slice thickness and, therefore, is a 3D element). Generally, there are 128 to 256 lines of data in an image; however, this can vary from 64 to 512 lines. To allow for “noise” in the system (false data) as opposed to “signal” and to alleviate artifacts from breathing, each line can be obtained three or more times and averaged (with breathholding techniques, this is typically not necessary). To image the heart, the scanner uses the ECG (or much less commonly, pulse recording) to determine what part of the heartbeat to obtain the image.
By timing the radiofrequency pulses differently and changing their magnitude, different types of images are generated. There are many types of CMR in clinical use as shown in
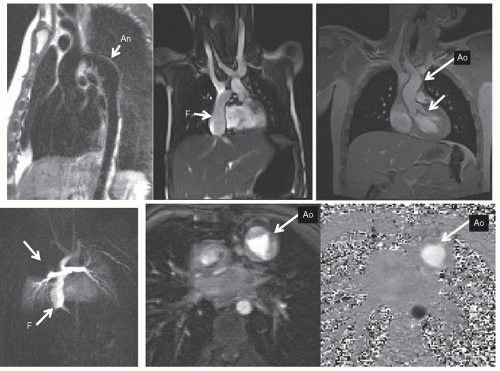
Figure 73.1. To define anatomy (
Figs. 73.1,
73.2,
73.3), double inversion (DI) dark blood CMR yields high-resolution images of myocardial tissue and blood vessel walls while the blood remains signal poor. SSFP imaging also yields high-resolution images of myocardial tissue and blood vessels; however, the blood is bright and signal intense, without the use of contrast agents. Cine MR (see below) can be used to delineate morphology as well, including valve morphology (shown).
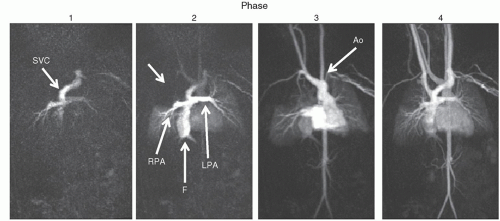
Although static noncontrast images used to be the mainstay of CMR, many other techniques have come into clinical use for morphology including contrastenhanced imaging. A contrast, typically a gadolinium-based agent, is injected and a T
1 weighted, 3D sequence is utilized to obtain a 3D image of the cardiovascular system (
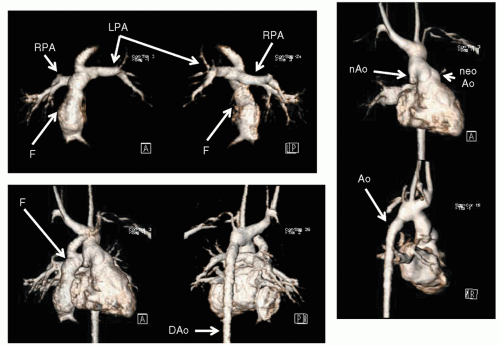
Fig. 73.2). Dynamic imaging is used and follows the contrast through the cardiovascular system; each phase is a 3D image in itself. These images can then be formatted as multiple two-dimensional images or a volume-rendered object (VRT) (
Fig. 73.3) from any phase of the dynamic imaging; these images can be “added” or “subtracted” from each other to delineate the salient point of the anatomy. Shaded surface displays (SSD) and maximum intensity projections (MIP) are rarely used today but played a role in CMR in past years.
CMR goes beyond anatomy, however (
Figs. 73.4 and
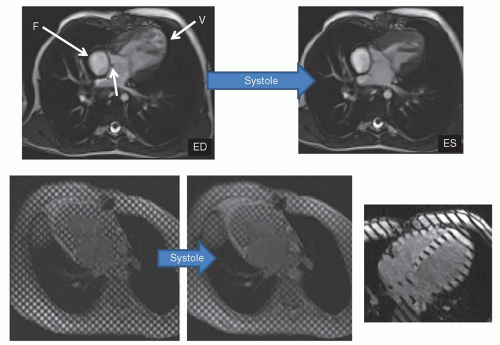
73.5). Cine CMR (
Figs. 73.1 and
73.4) produces a high signal from blood
and a lower amplitude signal from tissue and is usually utilized for cardiac motion, calculation of cardiac index, blood flow, and functional analysis (ventricular volumes, ejection fraction, etc.). One of the distinct advantages CMR has is that it does not rely on geometric assumptions to calculate volume, mass, and so on as other imaging modalities do. 3D echocardiography has come a long way, however, is not ubiquitous and needs specialized hardware, software, and image acquisition; CMR is nevertheless considered the “gold standard” in ventricular volume and mass measurement. Nearly all manuscripts in the literature validating 3D echocardiography compares the data with CMR; why use a surrogate, however, when a “gold standard” can be used? This is extremely important in CHD where bizarre, misshapen cardiovascular structures cannot be modeled by geometry. Further, CMR is exquisitely sensitive to turbulence and can detect even small amounts of regurgitation or stenosis. If turbulent blood flow is present, cine CMR will show a signal void in the region of turbulence, used to detect valvular regurgitation, valve stenosis, blood vessel stenosis, or baffle leaks/fenestrations (
Figs. 73.1 and
73.4). Alternatively, cine CMR can obtain static images at various levels of the body, “labeling” blood as signal intense regions. This may be used, for example, to find collateral vessels off the aorta in a patient with tetralogy of Fallot and pulmonary atresia. Cine CMR can be of the spoiled gradient echo type (SGE) or of the SSFP type.
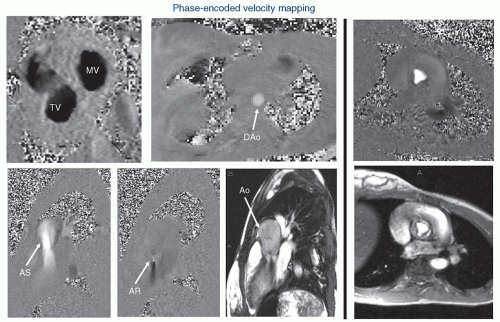
The CMR signal generated contains both the amplitude information of the signal as well as “phase” information. Phase-contrast (also known as phase-encoded) velocity mapping (
Figs. 73.5 and
73.7) uses this phase information to encode velocity similar to Doppler imaging in echocardiography. The difference is that with
CMR, velocity can be encoded in “through plane”—that is into and out of the plane of the image—the result being that actual flow can be obtained. If a blood vessel is imaged in cross section, all the voxels that encode velocity in the vessel can be summed over the entire cross section of the vessel and integrated over the entire cardiac cycle to obtain flow (as in liters/minute, not just velocity). This can be done in nearly any vessel in the body—arterial or venous.
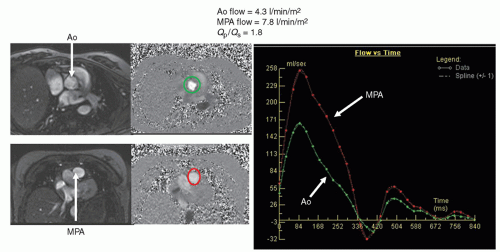
Qp/
Qs (
Fig. 73.6), aortic to pulmonary collateral flow, regional flow to each lung, caval return can all be measured. CMR has the further advantage of performing internal checks—such as flow in the main pulmonary artery equaling the sum of the flows in the branch pulmonary arteries or the flow in the aorta equaling the sum of caval return in the absence of aortic to pulmonary collaterals; this is unique to CMR as a noninvasive imaging modality. Generally, an upper limit to the velocity to be measured is set, similar to the Nyquist limit in echocardiography, called the VENC (Velocity EN Coding). Also similar to echocardiography, velocity direction can be encoded in grayscale or color scale with “white” in one direction and “black” in another (or red and blue). Similar to Doppler echocardiography, velocity can also be encoded in the plane of the image—called “in-plane” velocity mapping. This can be encoded in either
x– or
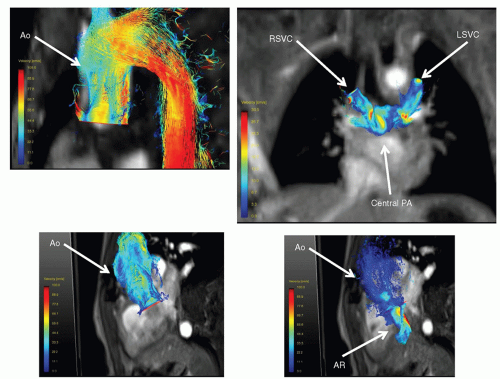
y-directions of the image. The resulting three orthogonal planes that velocity can be measured in enable CMR to measure four-dimensional (4D) velocities when a “slab” is obtained, which encodes all three velocity vectors (three dimensions of velocity and one of time;
Fig. 73.7). Much work is now being done in this area. Finally, phase-contrast CMR can be used to determine myocardial velocities similar to Doppler tissue imaging.
Myocardial tissue tagging (
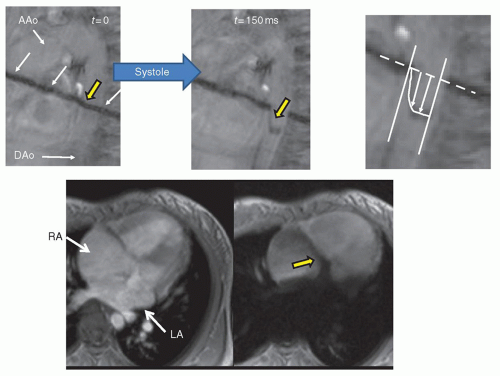
Fig. 73.4) is another CMR technique, which “magnetically labels” the walls of the myocardium and divides it into “cubes of magnetization.” This allows for the calculation of regional wall strain, radial motion, and torsion. This can be of the two-dimensional tagging type, where a “grid” is laid down on the myocardium (spatial modulation of magnetization or SPAMM) or of the one-dimension type, where just a series of parallel lines are laid down. Finally, blood tagging is similar to tissue tagging except that the blood is labeled, allowing for visualization of velocity profiles as well as calculation of cardiac index (
Fig. 73.8). This can be of the bolus tagging variety, where only a thin stripe is laid down on the blood vessel to label it (Bolus tagging); this has largely been supplanted by phase-encoded velocity mapping. Nevertheless, the ability to actually visualize a flow profile directly without postprocessing is still an appealing approach. Alternatively, a large stripe can be laid down on the blood to aid in shunt detection (
Fig. 73.8).
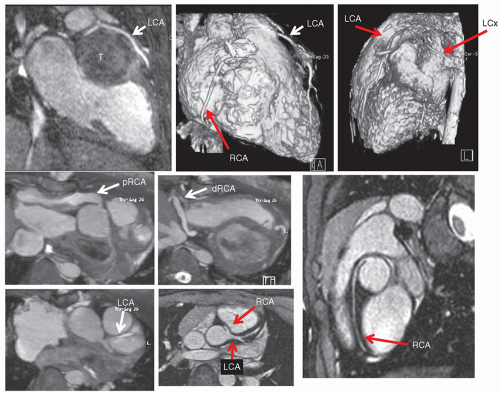
Coronary imaging, as with perfusion and viability, is an important issue in CHD. Coronary issues that the imager needs to address can be divided into three broad categories: (1) congenital coronary abnormalities such
as anomalous left coronary artery from the pulmonary artery or anomalous coronary artery origins from the opposite sinus, (2) acquired coronary artery abnormalities such as Kawasaki’s disease, and (3) iatrogenic coronary artery abnormalities such as those associated with repair of transposition of the great arteries or the Ross procedure. CMR generally utilizes 3D, fat saturated (to suppress the signal from epicardial fat), T
2 prepared (to suppress signal from myocardial muscle) sequences along with navigator techniques (a CMR technique that monitors diaphragmatic motion) to allow for coronary imaging in even small infants (
Fig. 73.9).
Regional myocardial perfusion and viability are now in routine clinical use in CMR (
Fig. 73.10). Utilizing gadolinium enhancement, CMR assesses regional wall perfusion by using a “first pass” injection technique. Typically, short – axis views of the ventricle are obtained and the sequence set up is such that the heart is imaged relatively motionless. Gadolinium is injected intravenously while the scanner continuously images the ventricle (up to 4 to 5 short axis slices may be imaged at once) and the gadolinium bolus is followed from right ventricular cavity to left ventricular cavity to ventricular myocardium. Defects in perfusion show up as dark portions of the myocardium while the rest of the ventricle is signal intense (
Fig. 73.10). It is usually used in conjunction with a coronary vasodilator, such as adenosine, although other agents such as dipyridamole can also be used. Lung perfusion can also be assessed qualitatively using time-resolved gadolinium techniques (
Fig. 73.2).
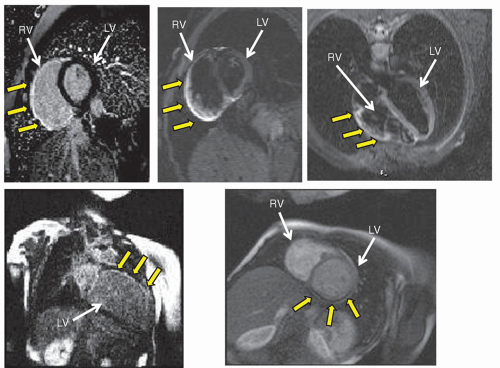
Infarcted myocardium is less of a known issue in CHD than it is in adults; however, native lesions such an anomalous left coronary artery from the pulmonary artery or operations, which scar the myocardium (e.g., repaired tetralogy of Fallot or single ventricles), may manifest myocardial infarction and scarring. Gadolinium is avidly taken up in the extracellular space by scarred myocardium and can remain in the scarred tissue for an extended period of time while it is subsequently “washed” out by coronary blood flow in perfused myocardium. Put another way, the signal intensity-time curves separate, with the infarcted myocardium gadolinium curve remaining highly signal intense after 5 minutes, whereas normal myocardium becomes much less so. CMR sequences take advantage of this property to be able to image infarcted myocardium using an inversion
pulse; this ability of CMR to detect myocardial scar is unique in noninvasive imaging. Signal intensity differences between normal and infarcted myocardium of up to 500% have been achieved. The technique has been shown to accurately delineate the presence, extent, and location of acute and chronic myocardial infarction as well as fibrous tissue (
Fig. 73.10). Ventricular septal defect patches, right ventricular outflow tract patches as with repaired tetralogy of Fallot also demonstrate signal intensity with this technique. In addition, various cardiac tumors can take up gadolinium, whereas others will not and cardiac MR uses this property, along with T
1-weighted images, T
2-weighted images, and fat saturation to predict what type of tumor is present (
Fig. 73.11).
Viability, myocardial edema, and tumor characterization are all examples of a third major function of CMR, which is “tissue characterization”—the ability of CMR to differentiate various forms of tissue from others and to make a diagnosis based on this and other characteristics. Other tissue characterization techniques rely on the T
2 properties of the myocardium to determine the presence of excessive water or iron. T
2 imaging, which has a long TR and TE, is sensitive to water and is used to detect edema in, for example, myocarditis (
Fig. 73.10). T
2* imaging, which quantifies the decay of signal at different TEs, will be lower in patients with iron deposits in the myocardium (after all, iron is ferromagnetic) than in patients without; this is used in patients with thalassemia or sickle cell disease to monitor chelation therapy (
Fig. 73.11).
There are many other specialized techniques within CMR; the two that will be explored in greater detail in this chapter are:
X-ray magnetic resonance (XMR)—the use of CMR in combination with cardiac catheterization. The uses range from superimposition of 3D images generated by CMR onto the fluoroscopy of the catheterization laboratory to act as a “roadmap” for the physician performing the catheterization to performing interventions in the CMR suite—and everything in-between.
Computational fluid dynamic modeling is the application of the Navier-Stokes equations, which is the governing equations of fluid flow in the body, to the cardiovascular system. With anatomy from CMR and blood flow measured at the inlets and outlets of the system (e.g., cavae and branch pulmonary arteries of the systemic venous pathway of Fontan patients or the main and branch pulmonary arteries in tetralogy of Fallot), a model of fluid flow can be created and tested at different flow conditions.
This chapter cannot delve into all the specialized CMR techniques although the reader should be aware they exist:
Exercise CMR—Performing exercise in the CMR suite itself with a CMR-compatible ergometer. Ventricular function, blood flow, and perfusion at exercise can be obtained by utilizing “real time” cine CMR and “real time” phase-contrast velocity mapping (
Fig. 73.12).
Fetal CMR—Utilizing “real time” and ultrafast single shot CMR, fetal cardiac anatomy and ventricular function can be obtained. Newer techniques utilize “Metric Optimized Gating” (MOG) allow for measuring flow in fetal vessels (
Fig. 73.12).
Tissue characterization: BOLD imaging, still being developed, can measure tissue oxygen levels as deoxygenated blood
has different magnetic properties than oxygenated blood. T
1 mapping utilizing gadolinium can measure “diffuse” myocardial scarring.
Three-dimensional printing is a technique that enables creation of physical 3D models of the cardiovascular system from gadolinium images, which the surgeon or the cardiologist can actually hold in their hands (
Fig. 73.12).
T1 mapping: The new and emerging field of “diffuse” myocardial scarring has been developing for a few years. As opposed to viability imaging, which generally detects discreet areas of scar, T1 mapping techniques utilizes gadolinium to detect diffuse scarring not readily apparent on the viability images.
CARDIAC MAGNETIC RESONANCE IMAGING APPROACH
The imaging approach to the patient with CHD is the same in CMR as it is in echocardiography, which was outlined previously in this chapter. However, there are various approaches that are used in the CMR evaluation of CHD, which any physician in the care of children with heart disease should be aware of. The following is a delineation of the conduct of the CMR examination and the various techniques that are performed. The reader should understand that not all techniques are run on every patient and that the study is tailored to the individual patient.
The initial images obtained are contiguous, tomographic slices in the transverse (also called “axial”) plane (images are oriented anteroposterior and right-left). This allows for one complete volumetric data set to be obtained so that if the study is terminated prematurely (e.g., patient instability), multiplanar reconstruction, and 3D data manipulation can still be generated off-line and used in the analysis of the anatomy. This view depicts the following structures (preoperatively): short axes of the ascending and descending aorta, pulmonary and aortic annulus, venae cavae, azygous vein, trachea, and esophagus, the long axes of the transverse aortic arch, main and branch pulmonary arteries, pulmonary veins, and a slightly off-axis apical four-chamber view.
The next set of images obtained are determined by the region of interest.
For example, if a coarctation of the aorta or the systemic venous pathway of a Fontan patient is being imaged, an off-axis sagittal image is used to obtain the “candycane” view of the aorta or the long axis of the systemic venous pathway (parallel to the path of flowing blood). If on the other hand, a double aortic arch is being imaged or the left ventricular outflow tract is assessed, a set of straight or slightly off-axis coronal images are obtained to yield the short axes of the right and left aortic arches, the long axes of the amalgamation of these structures into ascending and descending aorta, and the long axis of the left ventricular outflow tract. This can be performed using either dark or bright blood techniques.
It is the author’s strong belief that physiology and function must be interpreted in light of the prevailing anatomy. Therefore, once the anatomy is sorted out, cine CMR is the next performed to determine ventricular performance (end-diastolic volume, ejection fraction as examples), valve function (e.g., aortic insufficiency or stenosis), shunts that may be present and to aid in determining stenosis of great vessels. This series of scans is also used to confirm the anatomic information obtained by static imaging (e.g., hypoplasia of the branch pulmonary arteries should show the signal void of turbulence on cine CMR). The static images are used as a localizer for cine CMR imaging (e.g., using the four-chamber view on the static images to obtain the left ventricular short axis for shortening), another reason why the static images are obtained first.
Three-dimensional gadolinium imaging is then performed to obtain a 3D volumetric set of the cardiovascular system. The author prefers to use a dynamic technique such as TWIST, which follows the peripheral injection through the cardiovascular system, creating a 3D image every 2 to 3 seconds. The reader should note that other techniques that are “static” can be performed as well utilizing (1) bolus tracking—a special sequence is used to track the bolus of contrast through the cardiovascular system in real time and when it reaches the region of interest (e.g., branch pulmonary arteries in a patient with tetralogy of Fallot), the 3D gadolinium sequence is run automatically or (2) test dose technique—a sequence is used to determine how long a small test dose of contrast takes for the contrast to reach the region of interest from the time of injection. The 3D gadolinium sequence is then run after the full dose of contrast is injected, delayed by the amount of time determined by the test dose.
After the gadolinium portion of the study, phase-encoded velocity maps are obtained and these are used for flow and velocity information. The vessel to be interrogated is dependent upon the lesion, but typically, velocity maps across the aorta and main pulmonary artery are a minimum which is obtained. This serves two purposes: (1) with no shunts present, the cardiac output of the aorta should equal the cardiac output of the main pulmonary artery and (2) with a shunt present, a Q
p/Q
s may be obtained (
Fig. 73.6). This author recommends obtaining right and left pulmonary artery flow when calculating a Q
p/Q
s as well since both flows should add up to flow in the main pulmonary artery. In addition, caval flows are also obtained which should equal flow in the aorta in the absence of aortic to pulmonary collaterals or a systemic to pulmonary artery shunt. These quantitative internal checks are usually performed in CMR and is one of the unique features of CMR as an imaging modality. In addition, ventricular pressure estimates and gradients can be calculated utilizing through-plane and in-plane velocity mapping as one would in Doppler echocardiography.
In a typical scenario, in a patient who is after surgery, delayed enhancement (viability) is the final portion of the study. Since velocity mapping was performed after gadolinium was injected, the requisite 10 to 15 minutes would have passed and the patient would be ready to have scar imaging performed; in this way, little time is wasted during the examination. Generally, delayed enhancement imaging is performed in a stack of contiguous short- and long-axis views of the ventricle; if a questionable region is present, other views are obtained through that region. To ensure that the questionable region is not artifact, images may be obtained with different parameters (e.g., swapping phase and frequencyencoding directions, etc.).
A number of other techniques can be performed in between these sets of sequences, in place of them, or the sequences would be performed in a different order, tailored to the individual patient’s
disease and history. Myocardial tagging or blood tagging can be done after the cine sequences. Coronary imaging can take anywhere from 7 to 10 minutes and if that was the goal, it would be performed after the initial static images and some cine imaging. If perfusion is the goal of the study, this is usually done close to the beginning of the exam but after all dark blood sequences are needed. If myocardial iron imaging (

imaging) was the goal, that would be performed first. In the case of perfusion, the following sequence of events would be used, taking 60 to 70 minutes:
Static bright blood imaging
Cine imaging to obtain a gestalt for myocardial shortening prior to adenosine
Adenosine perfusion imaging with gadolinium (adenosine 140 µg/kg/minutes for 4 to 6 minutes)
Cine imaging for function (ventricular volumes and mass)
Velocity mapping for flows
Resting perfusion imaging with gadolinium (15 to 20 minutes after adenosine perfusion)
Coronary imaging
Delayed enhancement
With this sequence of events, a full functional exam, coronary and perfusion imaging can be obtained efficiently and distinctions can be made between normal perfusion, artifact, ischemia, and infarction.
 imaging is a technique that allows for the determination of iron deposition in the myocardium, useful in disease states such as thalassemia and sickle cell disease to monitor and alter chelation therapy.
 imaging) was the goal, that would be performed first. In the case of perfusion, the following sequence of events would be used, taking 60 to 70 minutes:


