Abdominal Aorta
W. Dennis Foley
F. Scott Pereles
Computed Tomographic Angiography
Computed tomographic angiography (CTA) has become a standard technique for preoperative evaluation of patients with abdominal aortic abnormalities. In the presence of abdominal aortic aneurysm (AAA), information provided by CTA includes aneurysm dimension (both longitudinal and transverse) and lumen size; length and diameter of superior and inferior neck; patency of aortic branch vessels, particularly mesenteric and renal; and degree and extent of atherosclerotic disease involving the iliac arteries. CTA has been used to study infrarenal, juxtarenal, and suprarenal AAAs as well as thoracoabdominal aneurysms. CTA implemented with a multidetector row CT system has now replaced conventional catheter arteriography for preoperative and preintervention evaluation.
Exam Technique
Based on the principles discussed in Chapters 1 and 4, abdominal aortic CTA should result in an intraluminal attenuation of the abdominal aorta and iliac arteries of at least 250 Hounsfield units (HU) and preferably 300 to 400 HU throughout the duration of acquisition.
Aortoiliac studies for juxtarenal and infrarenal AAAs are designed to cover the region from the supraceliac aorta to the femoral artery bifurcation and proximal superficial and profunda femoral arteries (Fig. 18-1). In patients with suprarenal aneurysms that may incorporate the celiac and superior mesenteric arteries, the imaging test should include the full extent of the thoracoabdominal aorta and iliac vessels in order to determine the presence of a coexistent ectatic or aneurysmal thoracic aorta, particularly one that is in continuity with a suprarenal aneurysm at the level of the aortic hiatus (Fig. 18-2).
There are three general principles in designing an aortoiliac CTA protocol. These relate to arterial enhancement, coverage speed and breath-hold interval, and z-axis resolution.
Arterial Enhancement
As stated above, uniform aortoiliac enhancement of 250 to 300 HU throughout the full longitudinal extent of the vasculature
is an important goal. This provides adequate contrast between vessel lumen, lining thrombus, and mural calcification and is necessary for adequate segmentation of the aortoiliac vasculature for three-dimensional (3D) rendering (Fig. 18-3). In addition, delineation of abdominal visceral branch vessels, including celiac, mesenteric, and renal, is likewise improved with a 250 to 300 HU intraluminal arterial enhancement. Arterial enhancement in conjunction with z-axis resolution are important factors in delineating arterial stenoses, particularly in branch vessels that are parallel to the primary transverse section, such as the renal arteries.
is an important goal. This provides adequate contrast between vessel lumen, lining thrombus, and mural calcification and is necessary for adequate segmentation of the aortoiliac vasculature for three-dimensional (3D) rendering (Fig. 18-3). In addition, delineation of abdominal visceral branch vessels, including celiac, mesenteric, and renal, is likewise improved with a 250 to 300 HU intraluminal arterial enhancement. Arterial enhancement in conjunction with z-axis resolution are important factors in delineating arterial stenoses, particularly in branch vessels that are parallel to the primary transverse section, such as the renal arteries.
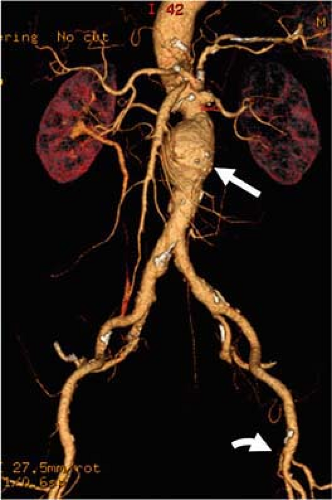 Figure 18-1 Typical area coverage for aortoiliac CT angiographic study of patient with suspected abdominal aortic aneurysm. VR in a frontal projection demonstrates anatomic coverage from the supraceliac aorta to proximal thigh (up to the level of the common femoral arteries bifurcation, curved arrow). All abdominal visceral branch vessels (including the IMA, which is patent and emerges from the aneurysm, arrow) and the bilateral common iliac, internal iliac, external iliac, common femoral and proximal superficial and profunda femoral arteries are displayed. |
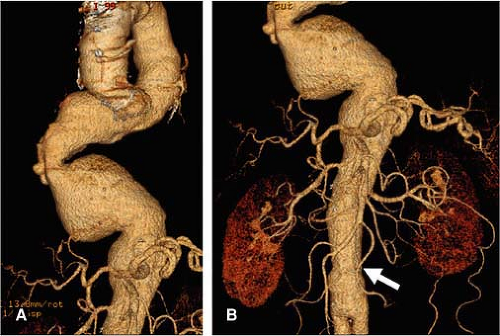 Figure 18-2 Thoracoabdominal aortic aneurysm. A: VR display in frontal projection of tortuous aneurysmal descending thoracic and suprarenal abdominal aortic aneurysm. There is marked tortuosity and multifocal aneurysmal disease of the descending thoracic aorta in contiguity with a suprarenal aneurysm incorporating the celiac and superior mesenteric arteries. B: VR display in frontal projection of the distal thoracic aorta and abdominal aorta demonstrates the ectatic juxta and infrarenal aorta caudal to the aneurysmal thoracic and suprarenal aorta. Proximal margin of an aortobiiliac graft is seen in the distal aorta (arrow). |
Empiric observation has demonstrated that an injection rate of 5 cc/second of 300 to 370 mg iodine/mL contrast concentration and a minimum 50-cc contrast volume will result in elevation of abdominal aortic attenuation to 250 to 300 HU in the majority of patients. Physiological variables that affect enhancement include heart rate and stroke volume (the two factors that determine cardiac output) and total blood volume. Relative contrast dilution will occur in patients with increased cardiac output and blood volume, whereas relative contrast enhancement will occur in patients with decreased cardiac output and blood volume. Elderly patients with relatively poor cardiac output may have surprisingly good aortoiliac contrast enhancement, although the bolus arrival is relatively delayed, the bolus is more compact related to relatively low stroke volume and cardiac output. However, flow deceleration and poor admixture in the relatively static blood pool of an AAA is not unusual and may result in suboptimal opacification (Fig. 18-4).
Patient arm positioning is an important consideration in that elevating the arm by placing the palm of the hand against the face of the gantry allows for a relatively smooth flow of the injected contrast bolus from the upper extremity venous circulation into the superior vena cava. If the arm is placed behind the patient’s head in the same axis as the body, venous constriction at the thoracic inlet between the clavicle and the first costoclavicular junction may result in significant delay in delivery of the contrast bolus to the superior vena cava and right heart. In conjunction with proper arm position, a saline flush system that follows the administered
bolus with a 20 to 30 mL saline flush injected at the same rate as the contrast bolus will effectively clear the administered contrast medium from the upper extremity venous circulation, allowing the full injected contrast bolus to be delivered to the aortoiliac system during acquisition. When saline flush is not used, some of the injected bolus will remain as a relatively static contrast column in the upper extremity veins following the end of the power injection.
bolus with a 20 to 30 mL saline flush injected at the same rate as the contrast bolus will effectively clear the administered contrast medium from the upper extremity venous circulation, allowing the full injected contrast bolus to be delivered to the aortoiliac system during acquisition. When saline flush is not used, some of the injected bolus will remain as a relatively static contrast column in the upper extremity veins following the end of the power injection.
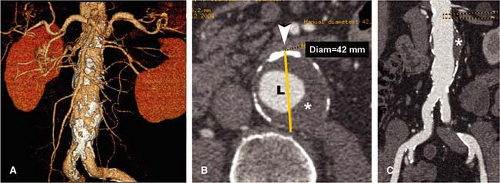 Figure 18-3 Intraluminal contrast attenuation as compared with lining mural thrombus and mural calcification. A: VR in a mild left anterior oblique projection of fusiform infrarenal aortic aneurysm demonstrates mural calcification as white plaque and vessel contrast in light yellow. B: Axial scans through the midsection of the aneurysm demonstrating aortic lumen (L), lining thrombus (*), and circumferential mural calcification (arrowhead). External AP diameter of the aneurysm is 42 mm. C: Curved planar reformation in a frontal projection of the abdominal aorta and right common and external iliac arteries demonstrates lining mural thrombus (*) and mural calcification in this infrarenal aneurysm. Linear measurements with dotted lines represent the measurement of the superior neck length—in this patient less than 10 mm and unsuitable for stent grafting. |
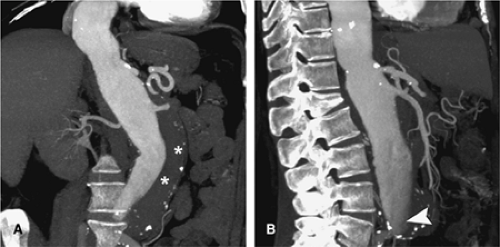 Figure 18-4 Contrast layering in an AAA of an elderly patient with thoracoabdominal aneurysm, marginal renal function, and a prior episode of contrast-induced nephropathy. The study was performed with limited contrast volume—60 mL of IsoVue 370 (Bracco Diagnostics, Princeton, NJ)—on a 64-channel scanner (LightSpeed VCT—General Electric Medical Systems, Waukesha, WI) at a table speed of 11 cm/second. A: Thin-section planar MIP in frontal projection demonstrates extensive fusiform aneurysm of the inferior thoracic and the abdominal aorta extending to the aortic bifurcation. There is prominent lining mural thrombus (*) and mural calcification. Contrast opacity in the infrarenal aorta is suboptimal. B: Thin-section planar MIP in lateral projection. Note the contrast layering and poor admixture in the infrarenal aorta (arrowhead). This appearance is probably due to “poor mixing” of the contrast bolus and relatively slow arterial flow within the aneurysm sac. There are normally patent celiac and superior mesenteric arteries. Note the wedge compression of T12 vertebral body. Despite the contrast layering in the abdominal aortic component of the aneurysm, the study was adequate for preoperative planning. |
The length of the contrast bolus injection approximates the length of the acquisition interval plus an additional 4 to
6 seconds that accounts for the up slope of enhancement after contrast arrival in the aorta and is due to spreading of the contrast bolus in the arterial tree. This approach to injection/acquisition aims to image the aortoiliac arterial tree during a relative plateau of sustained enhancement. The acquisition interval will depend on the cephalocaudad distance of the imaging field and the coverage speed, which in turn is dependent on beam width, pitch, and scan rotation speed. For injection durations and acquisition intervals greater than 10 seconds, contrast recirculation through the cerebral and renal circuits can result in incremental increases in aortic and iliac attenuation in the more caudal aspect of the imaging field (1) (Fig. 18-5).
6 seconds that accounts for the up slope of enhancement after contrast arrival in the aorta and is due to spreading of the contrast bolus in the arterial tree. This approach to injection/acquisition aims to image the aortoiliac arterial tree during a relative plateau of sustained enhancement. The acquisition interval will depend on the cephalocaudad distance of the imaging field and the coverage speed, which in turn is dependent on beam width, pitch, and scan rotation speed. For injection durations and acquisition intervals greater than 10 seconds, contrast recirculation through the cerebral and renal circuits can result in incremental increases in aortic and iliac attenuation in the more caudal aspect of the imaging field (1) (Fig. 18-5).
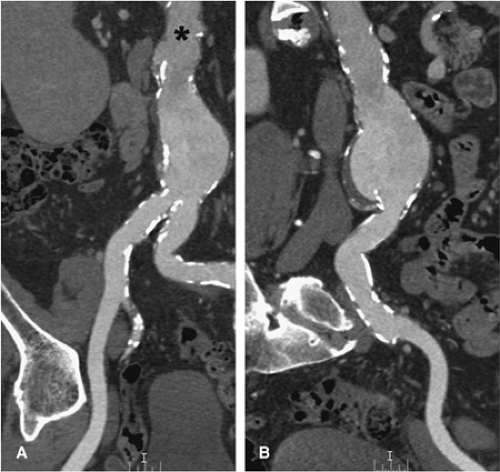 Figure 18-5 Progressively increasing enhancement in the cephalocaudal dimension of the aorta and iliac arteries. If a 4-channel MDCT system is used and acquisition interval is greater than 10 seconds, increasing arterial attenuation can be secondary to recirculation of the contrast bolus. In this patient studied with the 64-channel scanner and a short injection duration interval of 8 seconds, the table speed is lower than the arterial flow velocity. The low attenuation contrast medium in the proximal aorta represents the front end of the contrast bolus. A: Curved planar reformation of the aorta and the right common and external iliac arteries in an oblique projection. There is a fusiform infrarenal aortic aneurysm. Note the relatively decreased attenuation in the cephalad aspect of the abdominal aorta (*) and the progressive increase in arterial attenuation from the supraceliac aorta to the distal external iliac artery. B: Curved planar reformation of the aorta and left common and external iliac arteries in an oblique projection. Similar findings of a progressive increase in arterial attenuation from the supraceliac aorta to the distal external iliac artery. |
Coverage Speed and Breath-hold Interval
Volume coverage speed should be related to the cephalocaudad dimension of the imaging field, which for an aortoiliac acquisition extending from the supraceliac aorta to the proximal thigh can approximate 40 to 50 cm, depending on individual patient body habitus. A practical factor in determining coverage speed is a suitable breath-hold interval. If an upper limit of suitable breath-hold interval of 20 seconds is accepted, this will then determine the acquisition parameters for a 4-, 8- or 16-channel multidetector computed tomography (MDCT) systems. Patient breath holding is necessary for a satisfactory abdominal CT angiographic study, though acceptable CT rendering of the iliac and proximal thigh circulation can be obtained with the patient in quiet breathing. This switch to quiet breathing midway through the scan was utilized when aortoiliac studies were obtained with single-detector helical CT systems but is generally unnecessary with MDCT.
Circulation Timing
Individual patient circulation time may be obtained for a preliminary mini bolus, usually 5 cc/second for 15 cc total. Single-level low-dose imaging of the aorta at the level of the celiac artery is performed beginning 10 seconds after the beginning of injection with one image every 2–3 seconds. This will provide an aortic time-attenuation curve, consisting of arrival time, up slope, time to peak, and washout. Computer modeling with verification in a porcine model has demonstrated that the delay time between aortic peak on a 3-second mini bolus and aortic peak on an 8- to 12-second injection bolus approximates 4 to 6 seconds (2). If time from beginning of injection to 4 seconds after aortic peak on the mini bolus is chosen as the injection to scan delay for the subsequent CT angiogram, it is appropriate to make the injection interval equal to the acquisition interval plus 4 seconds and to achieve adequate and relatively uniform aortoiliac enhancement throughout the cephalocaudad extent of acquisition.
An alternative approach is to utilize online bolus tracking software to determine aortic arrival by establishing a preset threshold of enhancement. If 150 HU is the threshold, then acquisition may be initiated within a relatively short time after aortic arrival of the contrast bolus. This delay time will vary with individual vendors and will depend on image reconstruction interval and time to initiate helical scanning. If reconstruction and display takes 2 seconds and time for helical scan initiation an additional 3 seconds, there will be a 5-second delay between aortic arrival and initiation of scanning. This can be compensated by increasing the total injection duration by 5 seconds. A slower initial rate of injection can be utilized with this approach.
Two additional pharmacokinetic factors influence aortic attenuation throughout the duration of injection. These are (a) relative lengthening of the contrast bolus in the pulmonary and systemic circulation prior to aortic arrival and (b) as previously stated, the recirculation of the contrast bolus in the cerebral and renal circuits that can incrementally increase aortic attenuation in the more caudal aspect of the imaging field (1).
Protocol Development (4-, 8-, and 16-Channel Computed Tomography Scanners)
For a cephalocaudad coverage of 30 cm (supraceliac aorta to femoral artery bifurcation) and a 4-channel MDCT system with a detector collimation of 1.25 mm, beam width 5 mm, gantry rotation speed of 0.5 seconds, and pitch value of 1.5, the table speed is 15 mm/second and acquisition duration is 20 seconds. Acquisition duration is increased with an increase in the gantry rotation time or cephalocaudad coverage or with a decrease in pitch. If the contrast injection duration is made equal to the acquisition duration (20 seconds) plus a delay time between aortic arrival and the beginning of scanning (4 seconds) and a contrast injection rate of 5 mL/second into an antecubital vein is used, then the total contrast volume is 120 mL (Table 18-1). Acquisition duration will increase with increasing gantry rotation time and increased cephalocaudad coverage, and contrast load will be increased proportionately. Contrast concentration may vary from 300 to 370 mg iodine/mL. Increased contrast concentration will result in increased aortic attenuation, all other acquisition and physiological factors being equal.
In the progression from a 4- to 8-channel MDCT system (e.g., General Electric LightSpeed Plus to General LightSpeed Ultra, General Electric Healthcare, Milwaukee, Wisconsin), beam width is doubled for the same detector collimation (1.25-mm). For the same scan rotation speed and pitch value, acquisition duration is halved. In actual practice, the pitch value for the 8-channel system can be set at 1.35 as compared to 1.5 for the 4-channel system. For 0.5-second scan rotation speed, 30-cm cephalocaudad coverage is accomplished in 12-seconds as compared to 20-seconds for the 4-channel system. Using the paradigm of mini bolus timing and making injection interval equal to acquisition interval plus 4-seconds, total contrast load is reduced to 80-ml (5-ml/second for 16-seconds) (Table 18-1).
For a 16-channel MDCT system (e.g., General Electric LightSpeed 16), detector collimation can be reduced to 0.625 mm for the same 10-mm beam width as utilized for the 8-channel systems. This results in identical acquisition interval for a 16-channel CT system as the 8-channel
system but an improvement in z-axis resolution and provides a nearly isotropic volume data set (Table 18-1). For a 30-cm field of view with a 512 ÷ 512 matrix, voxel dimensions are 0.6 ÷ 0.6 in the xy-plane and 0.625 mm in the longitudinal axis. Actual measured longitudinal resolution approximates 0.8 mm.
system but an improvement in z-axis resolution and provides a nearly isotropic volume data set (Table 18-1). For a 30-cm field of view with a 512 ÷ 512 matrix, voxel dimensions are 0.6 ÷ 0.6 in the xy-plane and 0.625 mm in the longitudinal axis. Actual measured longitudinal resolution approximates 0.8 mm.
Table 18-1 Generalized Parameters Commonly Recommended for Abdominal Aorta Coverage (Cephalocaudad Coverage 300 mm)a | ||||||||||||||||||||||||||||||||||||||||||||||||||||||||||||||||||||||||
|---|---|---|---|---|---|---|---|---|---|---|---|---|---|---|---|---|---|---|---|---|---|---|---|---|---|---|---|---|---|---|---|---|---|---|---|---|---|---|---|---|---|---|---|---|---|---|---|---|---|---|---|---|---|---|---|---|---|---|---|---|---|---|---|---|---|---|---|---|---|---|---|---|
| ||||||||||||||||||||||||||||||||||||||||||||||||||||||||||||||||||||||||
With 4- and 8-channel MDCT systems, improved longitudinal resolution can be obtained by overlapping reconstructions utilizing 50% overlap. However, the longitudinal resolution of overlapped 1.25-mm axial sections is still inferior to contiguous 0.625-mm sections.
Although an 80-mL contrast injection (supplemented by 15-mL preliminary mini bolus) is an acceptable contrast load for patients with marginal renal function, further reduction in contrast load can be achieved when the 16-channel scanner is operated with 1.25-mm detector collimation and a 20-mm beam width. This will double the coverage speed for the 16-channel system if the same pitch value and scan rotation speed are used. Acquisition interval can approximate 6 seconds. Satisfactory patient studies may be obtained with a minimum of 50 cc of contrast material injected at 5 cc/second. For these very short acquisition times, precise determination of circulation time is an absolute prerequisite (Table 18-1).
For patients with suprarenal aneurysms involving the aortic hiatus or patients with suspected or known thoracoabdominal aneurysms, a total thoracoabdominal aortic and iliac study are required. In this circumstance, the cephalocaudad coverage is approximately 60 cm. For a 4-channel MDCT system utilizing 2.5-mm detector collimation, pitch value 1.5, and gantry rotation speed 0.5-seconds, z-axis coverage is 3 cm/second and the total study can be obtained in a 20-second time interval, corresponding to a comfortable breath-hold interval for most patients (Table 18-2). If the paradigm of preliminary mini bolus timing is used, the aortic time-attenuation curve is obtained from the level of the mid ascending aorta, again using a 5-cc bolus injection over 3 seconds.
For the 8-channel MDCT system, the same beam width of 10 mm as a 4-channel system (with detector collimation 2.5 mm) can be utilized and the detector collimation reduced from 2.5 to 1.25 mm. With pitch value set at 1.35 (8-channel) in comparison to 1.5 (4-channel), acquisition duration approximates 22 seconds and contrast load 130 mL (Table 18-2).
For a 16-channel MDCT system, two options are possible. If the same detector collimation (1.25 mm) as the 8-channel approach is used, beam width is increased from 10 to 20 mm, and if approximately the same pitch value (1.375) and gantry rotation speed (0.5 seconds) are used, acquisition duration approximates 12 seconds with contrast load of 80 mL (Table 18-2). Alternatively, detector collimation can be reduced to 0.625 mm, and with otherwise identical acquisition parameters, acquisition duration will be equivalent to an 8-channel system with the same beam width (i.e., 22 seconds). In patients with aneurysmal disease, the thinner detector collimation approach (0.625 mm) will have the advantage of improved display of abdominal visceral branch vessels, particularly the renal arteries, which are parallel to the slice plane (Table 18-2).
Further technical progression in CT scanner performance has resulted in the production of 32, 40, and 64-channel systems. Dependent on the choice of technical factors already stressed (i.e., detector collimation, pitch value, and scan rotation speed), such systems can significantly decrease scan acquisition duration for both thoracoabdominal and aortoiliac CTA. In thoracic studies, retrospective electrocardiogram (ECG) gating can be implemented in patients in
whom a combined study of the coronary and aortic vasculature is desired. ECG-gated cardiac studies are acquired with a lower pitch value (approximately 0.18 to 0.25) increasing acquisition duration in order to obtain appropriate sampling of the heart during a chosen diastolic interval. Thus, if ECG gating is implemented with a 64-channel MDCT system employing a low pitch value of 0.25, total acquisition time for a thoracoabdominal aortic study would approximate that of a 16-channel system with a pitch value of 1.0. Patient radiation dose can be kept within diagnostically acceptable limits with simultaneous tube current modulation in the x-, y– and z-axes.
whom a combined study of the coronary and aortic vasculature is desired. ECG-gated cardiac studies are acquired with a lower pitch value (approximately 0.18 to 0.25) increasing acquisition duration in order to obtain appropriate sampling of the heart during a chosen diastolic interval. Thus, if ECG gating is implemented with a 64-channel MDCT system employing a low pitch value of 0.25, total acquisition time for a thoracoabdominal aortic study would approximate that of a 16-channel system with a pitch value of 1.0. Patient radiation dose can be kept within diagnostically acceptable limits with simultaneous tube current modulation in the x-, y– and z-axes.
Table 18-2 Thoracoabdominal Aorta (Cephalocaudad Coverage 600 mm)a | ||||||||||||||||||||||||||||||||||||||||||||||||||||||||||||||||||
|---|---|---|---|---|---|---|---|---|---|---|---|---|---|---|---|---|---|---|---|---|---|---|---|---|---|---|---|---|---|---|---|---|---|---|---|---|---|---|---|---|---|---|---|---|---|---|---|---|---|---|---|---|---|---|---|---|---|---|---|---|---|---|---|---|---|---|
| ||||||||||||||||||||||||||||||||||||||||||||||||||||||||||||||||||
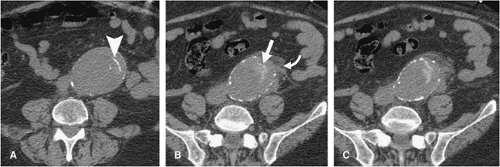 Figure 18-6 CT crescent sign. A: Precontrast axial scan in the more cephalad aspect of an infrarenal aortic aneurysm demonstrates laminated calcification in lining mural thrombus (arrowhead). B: Axial scan at a more caudal level demonstrates a focal curvilinear high-attenuation material consistent with coagulum in a dissecting channel of the lining thrombus (arrow). Anterolateral periaortic stranding is consistent with an aortic leak (curved arrow). C: Scan at a more caudal level demonstrates both the intra thrombotic “crescent” and periaortic blood to greater effect. |
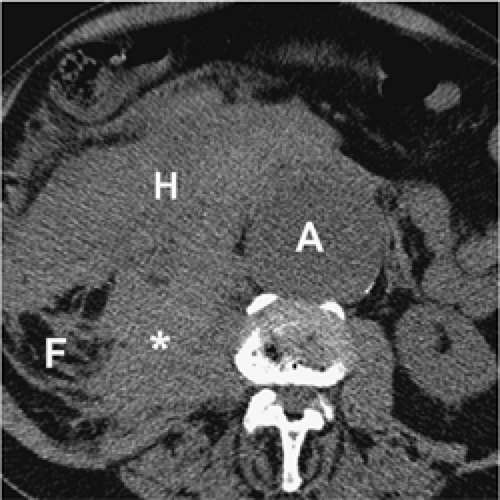 Figure 18-7 Ruptured infrarenal AAA. Axial precontrast image demonstrates the aneurysm sac (A) and a large right retroperitoneal hematoma predominantly in the anterior pararenal space (H). The right psoas outline is obscured (*). Oval-shaped fibrofatty tissue in the right retroperitoneum (F) represents the inferior extent of the right perinephric space. |
For aortic aneurysm CTA studies, a precontrast imaging sequence is obtained. This delineates arterial calcification and can demonstrate higher attenuation thrombus in a mural dissection (Fig. 18-6). Precontrast imaging is critical in patients who present with suspected aortic rupture, as in a hemodynamically compromised patient. An immediate diagnosis can be obtained and the patient transferred without delay to the operating room (Fig. 18-7) or a rapid dynamic contrast-enhanced study obtained to delineate the site of rupture and obtain a vascular road map for emergency surgery. In patients with periaortic hematoma whose clinical history suggests a “slow leak” and who are hemodynamically stable, a contrast-enhanced study is of value in providing a multiplanar and 3D display for the patient who would be transferred to the operating room in a semiemergent fashion (Fig. 18-8).
CTA of patients who have an endovascular stent graft in general conforms to the same imaging guidelines just described with the exception that an additional “early delayed” aortoiliac acquisition is acquired immediately following the dynamic angiographic sequence in order to increase sensitivity to endoleak (3) (Fig. 18-9). This issue is discussed later in this chapter under the section on postintervention findings.
Image Postprocessing
Postprocessing of abdominal aortic CTA follows the principles outlined in Chapter 6. For volume rendering (VR) and maximum-intensity projection (MIP), the liver, spleen,
pancreas, and intestines are generally removed. It is also useful to eliminate all but the origins of the celiac axis and superior mesenteric artery (SMA). Prior to removal of the spine and bony pelvis, projection of aneurysmal disease over the background spine and pelvis may provide useful anatomic reference landmarks for subsequent correlation with fluoroscopic images during intervention (Fig. 18-10).
pancreas, and intestines are generally removed. It is also useful to eliminate all but the origins of the celiac axis and superior mesenteric artery (SMA). Prior to removal of the spine and bony pelvis, projection of aneurysmal disease over the background spine and pelvis may provide useful anatomic reference landmarks for subsequent correlation with fluoroscopic images during intervention (Fig. 18-10).
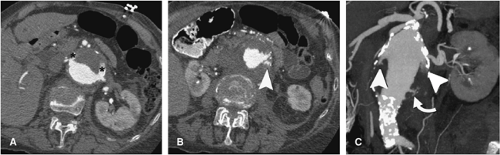 Figure 18-8 Large juxta renal/infrarenal abdominal aortic aneurysm with contrast opacification of a “neochannel” in lining mural thrombus. This may be a prelude to aortic rupture. A: Axial image at level of renal artery origins demonstrates flow channels between the lining mural thrombus and aortic wall (*), larger on the left. B: Axial scan at a more caudal level demonstrates an additional irregular flow channel in the left side lining mural thrombus (arrowhead). C: Thin section planar MIP in a frontal projection demonstrates the juxtarenal/infrarenal fusiform aneurysm with two prominent flow channels (arrowheads) in the lining mural thrombus caudal to the renal vascular pedicle. There is an additional horizontally directed flow channel (curved arrow). The morphology of these flow channels suggests an increased risk for aortic rupture. |
AAAs are frequently tortuous. Conventional 3D displays as outlined previously do not provide an accurate representation of longitudinal dimensions of a tortuous aorta. Point-to-point measurements on coronal plane reformatted images are thus inherently inaccurate, and discrepancies are to be expected between these planar measurements on a CTA display and a measurement obtained at catheter arteriography by using a calibrated catheter. Software techniques that use centerline tracking and automatic edge detection have been implemented to evaluate the aortoiliac arterial system in potential stent-graft
candidates. The software provides a true longitudinal dimension of tortuous aortoiliac vessels as well as diameter and area measurements that are orthogonal to the artery. One such software technique available commercially (“Advanced Vessel Analysis,” General Electric Healthcare, Milwaukee, Wisconsin) requires placement of a cursor in the supraceliac aorta and both common femoral arteries as well as additional aortic branch vessels as desired. The software then automatically displays a 3D image indicating the location of the centerline and true orthogonal images of the aorta at any selected point (Fig. 18-11). After the operator selects designated anatomic levels from a rotatable stretched longitudinal image, the software is programmed to provide length and transverse dimensions of the superior neck (at upper, mid, and lower neck) (Fig. 18-12), length, transverse dimension and endoluminal volume of aneurysm (Fig. 18-13), and the length and transverse dimensions of the common iliac arteries, the usual distal placement zone for an endovascular stent graft (Fig. 18-14). Additional measurements of the suprarenal aorta and the external iliac arteries can be obtained, depending on individual patient anatomy and type of stent-graft option. Finally, the angle between the superior neck and the long axis of the aneurysm is calculated (Fig. 18-15). An angle of less than 60 degrees is desirable for most endovascular stent grafts.
candidates. The software provides a true longitudinal dimension of tortuous aortoiliac vessels as well as diameter and area measurements that are orthogonal to the artery. One such software technique available commercially (“Advanced Vessel Analysis,” General Electric Healthcare, Milwaukee, Wisconsin) requires placement of a cursor in the supraceliac aorta and both common femoral arteries as well as additional aortic branch vessels as desired. The software then automatically displays a 3D image indicating the location of the centerline and true orthogonal images of the aorta at any selected point (Fig. 18-11). After the operator selects designated anatomic levels from a rotatable stretched longitudinal image, the software is programmed to provide length and transverse dimensions of the superior neck (at upper, mid, and lower neck) (Fig. 18-12), length, transverse dimension and endoluminal volume of aneurysm (Fig. 18-13), and the length and transverse dimensions of the common iliac arteries, the usual distal placement zone for an endovascular stent graft (Fig. 18-14). Additional measurements of the suprarenal aorta and the external iliac arteries can be obtained, depending on individual patient anatomy and type of stent-graft option. Finally, the angle between the superior neck and the long axis of the aneurysm is calculated (Fig. 18-15). An angle of less than 60 degrees is desirable for most endovascular stent grafts.
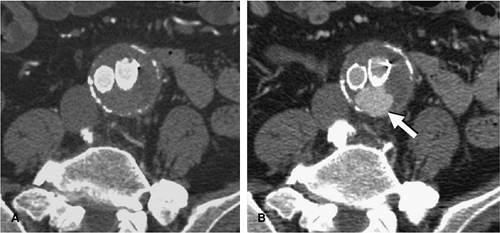 Figure 18-9 Type 2 endoleak in a patient with a bifurcated aortoiliac endovascular stent graft. In this patient, the endoleak is only evident on the early delayed scan and not on the initial dynamic scan. A: First-pass dynamic scan obtained during the first circulation of the injected contrast bolus does not demonstrate an endoleak. B: “Early delayed” second-pass study obtained immediately following the completion of the first circulation study demonstrates a prominent posterior endoleak in the aneurysm sac secondary to lumbar artery inflow (arrow). |
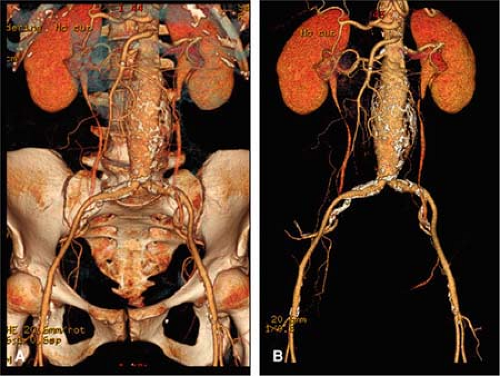 Figure 18-10 Aortoiliac CTA in patient with fusiform infrarenal AAA; pre- and postbone segmentation. A: Prebone segmentation. VR of the abdominal aorta and iliac arteries superimposed on background skeletal anatomy. Note the upper margin of the aneurysm at mid L2 level and the lower margin of the aneurysm at the aortic bifurcation at L5 level. B: VR with the same projection and area coverage as in (A) following bone segmentation. This illustrates the value of 3D volume display with the option of selective bone removal. |
In addition to the above measurements, the images that are generated by this program include curved planar reformations through the vessel centerline of the aortoiliac vasculature. This allows a determination of iliac artery stenosis and an assessment of iliac artery tortuosity, both important factors in stent-graft planning (Fig. 18-16). In conventional MIP and subvolume MIP, circumferential mural calcification does not allow an accurate assessment of the iliac arterial lumen. This issue is addressed with the curved planar reformations.
An assessment of change in aneurysm sac size following endovascular stent grafting may be obtained by using either diameter or volume measurements. Although the automated centerline tracking technique provides a true longitudinal dimension of the aortoiliac arterial system, the centerline measurement may be misleading in relation to the choice of an appropriate stent graft. Following proximal and distal fixation, stent grafts do not usually lie within the center of the aortic lumen but are relatively posterior and do not conform to the curvature of the aorta. However, after placement, assume the shortest longitudinal dimension between the proximal and distal placement zones that accommodates underlying tortuosity. Researchers at Stanford University have determined that moving the longitudinal centerline away from center of the aorta so that it is closer to the inner curve of the vessel is a good practical accommodation (4).
The automated centerline tracking technique has most value in measurement of the length of the superior neck. The superior neck may be angulated anteriorly with reference to the juxtarenal and suprarenal aorta and relatively foreshortened in a series of axial images (Fig. 18-17). In addition to the perception of foreshortening in axial images, the superior neck may be angulated obliquely with reference to both
the juxtarenal and suprarenal aorta and the long axis of the aneurysm. Proper placement in the superior neck is critical to maintaining stability of a stent graft, and knowledge of the true dimensions and orientation of the superior neck are vital.
the juxtarenal and suprarenal aorta and the long axis of the aneurysm. Proper placement in the superior neck is critical to maintaining stability of a stent graft, and knowledge of the true dimensions and orientation of the superior neck are vital.
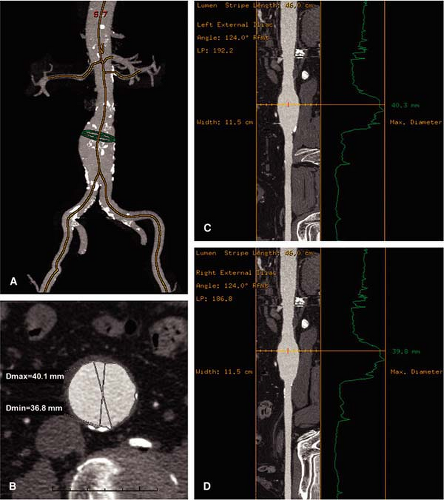 Figure 18-11 Automated centerline tracking and edge detection algorithm applied to a mildly tortuous aortoiliac arterial system in a patient with a fusiform infrarenal aneurysm. A: Centerline tracking of the abdominal aorta and right and left common and external iliac arteries together with celiac, superior mesenteric, and both renal arteries. Measurements of aortic diameter and area (green circle) are obtained by using a true cross section of the aorta rather than utilizing a transverse abdominal section. B: Measurements of maximum diameter (40.1 mm) and minimum diameter (36.8 mm) obtained from a true orthogonal projection of the abdominal aorta. Note that the automated edge detection algorithm has separated mural calcification and lining mural thrombus from contrast-enhanced blood in the vessel lumen. C: A stretched lumen view of the abdominal aorta and right common and external iliac arteries. This image is rotatable on the long axis of the vessel to allow imaging of side branches. The green line to the right of the image represents the mean diameter at any selected cephalocaudal level. A numerical value is provided depending on the level of the “slider.” D: A stretched lumen view of the abdominal aorta and the left common and external iliac arteries. As in (C), graphical representation of lumen diameter at any selected level is provided. |
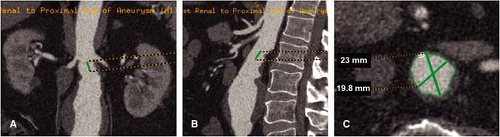 Figure 18-12 Semiautomated measurements of the superior neck of an infrarenal AAA. Measurements of the neck (12 mm) in the frontal (A) and lateral (B) projections of the aorta (not of the body) and automated measurements of the maximum and minimum diameter (23 mm and 19.8 mm, respectively) in a cross section of the aorta in that segment (C), with an average diameter of 21.1 mm. |
In addition to measurement of the superior neck, the shape and wall characteristics of the superior neck are also important. Stent-graft devices usually fixate well in superior necks that are relatively straight. However, fixation and stability over time are questionable if the shape of the superior neck is relatively conical or flared. Stent grafts that are fixated by friction may migrate proximally or distally over time if fixation is to a conical or flared superior neck. In addition, fixation either with friction devices or barb devices into a superior neck with significant atherosclerotic plaque and/or ulceration may lead to distal embolization during procedure, poor fixation, and/or possible endoleak.
Magnetic Resonance Angiography
Equipment Considerations
Not all magnetic resonance (MR) machines are created equal, but a large percentage of MR equipment is capable of diagnostic-quality examination of the abdominal aorta. High field (≥1T) strength magnets are certainly preferable to low field examination of the abdominal aorta, and therefore discussion that follows will mostly relate to examination
at 1.5 and 3T. This is not to say that low field examinations of the abdominal aorta are not possible or are always nondiagnostic.
at 1.5 and 3T. This is not to say that low field examinations of the abdominal aorta are not possible or are always nondiagnostic.
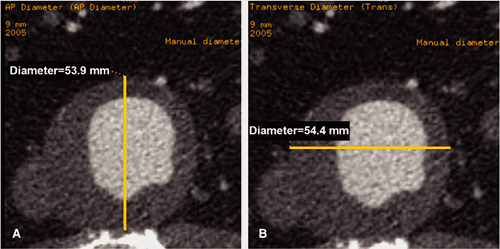 Figure 18-13 Anteroposterior and transverse dimensions of an infrarenal AAA. A: Manual measurement of external AP diameter obtained from a true cross-sectional view of the aorta. Measurement is 53.9 mm. B: Manual measurement of transverse diameter of an aortic aneurysm (including aortic lumen and lining mural thrombus). Measurement was obtained from a true cross-sectional image of the aorta. Measurements of true aneurysm volume, including lumen and lining thrombus, may provide more clinically meaningful estimates of aneurysm dimensions. |
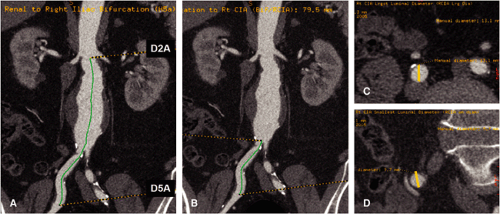 Figure 18-14 Linear measurement of the infrarenal abdominal aorta and common iliac artery and length and transverse dimensions of the common iliac artery. A: Automated centerline measurement obtained from the inferior margin of a renal vascular pedicle (D2A) to level of the right common iliac artery bifurcation (D5A). This measurement is a true linear longitudinal distance that accounts for vessel tortuosity. Measured length is 191.2 mm. B: Automated centerline measurement of length of the right common iliac artery. Measurement accounts for vessel tortuosity. Measured length is 79.5 mm. C: Anteroposterior diameter measurement of largest lumen diameter of the right common iliac artery from a true orthogonal display. Measured dimension is 13.1 mm. D: Anteroposterior diameter measurement of the smallest dimension of the right common iliac artery obtained from a true orthogonal projection of the vessel. Diameter measurement is 9.7 mm. |
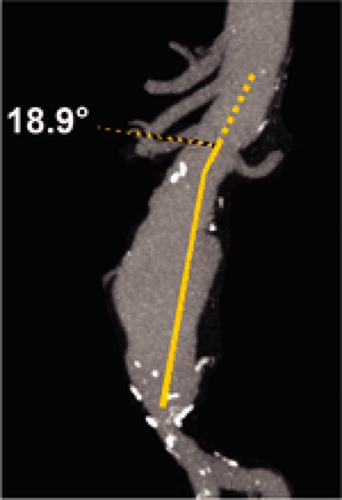 Figure 18-15 Angulation of the superior neck in relation to the long axis of the infrarenal AAA. The intersection of the long axis of the superior neck and the infrarenal aneurysm results in an angle of 18.9 degrees. The long axis of both the superior neck and the infrarenal aneurysm were determined from the 3D image data. For endovascular stent grafts, angulation of the superior neck in relation to the long axis of the aneurysm should ideally be less than 60 degrees. |
Techniques
Early MR techniques focused on comprehensive evaluation of the aorta by employing both bright blood and dark blood pulse sequences. However, these examinations had been hampered by severe motion artifact from respiration, bowel peristalsis, and vascular pulsations. Newer breath-hold acquisitions and snapshot techniques, which are to large measure breathing independent, can reliably evaluate acute pathology within the aorta. These techniques include incoherent gradient echo imaging with ultrashort TR (TR <4 milliseconds) with and without gadolinium contrast (often referred to as contrast-enhanced 3D magnetic resonance angiography [MRA]), and steady state gradient echo (e.g., True fast imaging with steady state free procession [FISP], balanced fast field echo [FFE], and fast imaging employing steady state acquisition [FIESTA]). More comprehensive interrogation can include dark blood preparation strategies and high spatial resolution imaging if plaque morphology and quantitation are to be assessed.
Rapid aortic imaging is no longer the sole domain of CT. Although MDCT is truly stunning in its speed, interrogation
of the entire abdominal aorta in a single breath hold is also possible by magnetic resonance imaging (MRI). Using a combination of noncontrast-enhanced single-slice and cine-balanced gradient echo images, the abdominal aorta can be screened in a matter of minutes for critical pathology. More detailed evaluation, including contrast-enhanced MRA and evaluation for complications surrounding the aorta, can be completed in a matter of a few additional minutes.
of the entire abdominal aorta in a single breath hold is also possible by magnetic resonance imaging (MRI). Using a combination of noncontrast-enhanced single-slice and cine-balanced gradient echo images, the abdominal aorta can be screened in a matter of minutes for critical pathology. More detailed evaluation, including contrast-enhanced MRA and evaluation for complications surrounding the aorta, can be completed in a matter of a few additional minutes.
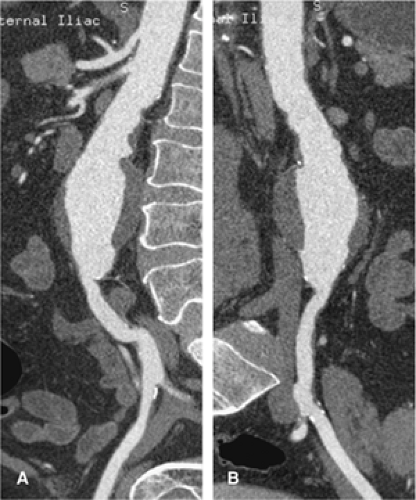 Figure 18-16 Automated curved planar reformation of the abdominal aorta and both common iliac and external iliac arteries. A: Curved planar reformation of the abdominal aorta and right common and external iliac arteries. There is mild tortuosity of the common iliac artery and minimal atheromatous plaque disease. B: Curved planar reformation of the abdominal aorta and left common and external iliac arteries. Minimal tortuosity and atheromatous wall thickening of the left common iliac artery. A fusiform infrarenal aneurysm with lining mural thrombus is present. Posterior wall atheroma is noted in the superior neck. The mildly tortuous iliac vessels in this patient are suitable for percutaneous access for aortic endovascular stent grafting. |
Nuances of Acquisition Strategies
Noncontrast Techniques
Historically, spin echo techniques dominated noncontrast MR aortic imaging; however, the advent of high-performance gradients (slew rates >100 mT/m/milliseconds) coupled with development of balanced gradient echo techniques shifted aortic imaging strategies from spin echo to gradient echo. Occasionally, black blood turbo spin-echo (TSE, FSE) or its single shot analogs (HASTE, SSFSE) imaging is still performed for an overall anatomical appreciation of the abdominal aorta course and caliber. These single-shot techniques can also provide strong anatomic definition of the periaortic tissues as well as a more overall view of the regional organs including the bowel. In general, however, flow heterogeneity can present a problem for most dark blood preparations, making them somewhat less reliable than bright blood gradient echo techniques and contrast-enhanced MRA for luminal evaluation, including detection of dissection.
Noncontrast bright blood aortic imaging with time of flight is still performed on occasion on older units but has mostly been abandoned in favor of faster and more robust balanced gradient echo techniques and contrast-enhanced MRA. Some people espouse using phase contrast imaging at sites of stenosis to determine if the stenosis is hemodynamically significant. A significant stenosis will create a flow void at and just distal to the stenosis due to intravoxel spin dephasing. This is certainly true and may be of value in smaller vessels (i.e., renal arteries) but is relatively time-consuming and of dubious necessity in an artery the caliber of the aorta.
Balanced gradient echo techniques can be used without dark blood preparations and have a robust contrast-to-noise ratio, making them ideal for evaluation of the blood pool (5). TrueFISP was specifically shown to be extremely well suited for evaluation of the thoracic aorta and can also be applied to abdominal aortic evaluation (see rapid aortic protocol below) (6). The aorta is typically imaged in at least two planes (i.e., the axial and coronal planes). Sagittal imaging can be obtained in place of coronal images, if desired. In the interest of time conservation in the protocols, three-plane evaluation is usually not critical. An axial stack of single-shot images is obtained from the diaphragm to the bifurcation. A coronal stack of images is obtained to cover the aorta alone (usually, thin slices of 3 to 4 mm) or the entire abdomen, if desired. Axial images take approximately 350 to 600 milliseconds to acquire, while coronal images take approximately 500 to 900 milliseconds to acquire. This extremely fast acquisition speed means that breath holding is helpful for slice registration but is not crucial for maintenance of relatively high image quality. Thus, critically ill patients unable to breath hold still produce reliable images.
Because of their extremely rapid gradient reversals, balanced gradient echo images are prone to certain predictable artifacts. The two most common artifacts are phase cancellation and dark band artifacts. Phase cancellation artifacts are the result of rapid gradient reversals, typically performed at a recovery time (TR) of approximately 2 milliseconds. As a result of the phase cancellation created between fat and
water when a TR of approximately 2.1 milliseconds is used, any interface between fat and water (muscle, blood, etc.) produces black lines like India ink etching. An example where this property is used to the imager’s advantage is in adrenal imaging, where gradient echo imaging with roughly the same TR is used to delineate voxels that contain both fat and water such as the micromolecular composition of adrenal adenomas.
water when a TR of approximately 2.1 milliseconds is used, any interface between fat and water (muscle, blood, etc.) produces black lines like India ink etching. An example where this property is used to the imager’s advantage is in adrenal imaging, where gradient echo imaging with roughly the same TR is used to delineate voxels that contain both fat and water such as the micromolecular composition of adrenal adenomas.
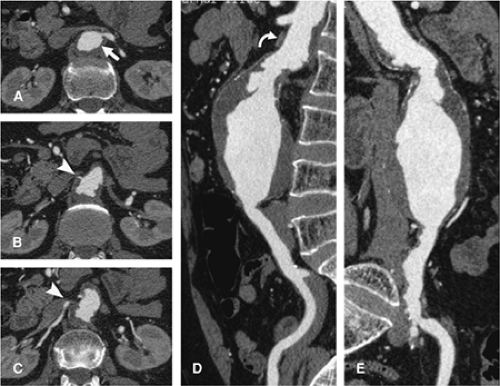 Figure 18-17 Measurement, shape, and wall characteristics of the superior neck, as determinants in stent-graft planning. A: Axial scan of the aorta at the level of the origin and proximal segment of the left renal artery. Note the prominent circumferential mural thrombus, predominantly posterior, in the aorta at this level (arrow). B: Anterior and leftward angulation of the superior neck, as demonstrated in a more caudal axial scan. The origin and proximal segment of one of two right renal arteries is seen (arrowhead). Prominent atherothrombotic wall thickening is noted. C: More caudal axial CT scan demonstrates anterior and leftward projection of the aorta and the takeoff of a more inferior right renal artery (arrowhead). D: Curved planar reformation of the abdominal aorta and left common iliac artery in a lateral projection. Caudal to the left renal vein (curved arrow), there is anterior angulation, flaring, and atherothrombosis of the aorta as it becomes progressively aneurysmal. E: Curved planar reformation of the abdominal aorta and left common and external iliac arteries in an oblique projection. Angulation, flaring, and tortuosity of the supra-aneurysmal aorta with prominent atherothrombosis is demonstrated. This sequence of axial images and curved planar reformations demonstrates relatively caudal origin of the right renal arteries and extensive irregular circumferential atherothrombosis of the superior neck, factors that could preclude use of endovascular stent grafting. |
The second artifact of dark bands occurs as a result of off resonance effects from minor field inhomogeneity. These dark bands are usually harmless when they occur outside the area of interest, but to the untrained observer, they can be mistaken for true pathology. One example is if a dark band fell within the area of interest, such as through the aortic lumen, where it could be mistaken for a dissection flap. However, one should note that a dark band artifact will usually continue beyond the lumen. Additionally, shifting the tuning frequency of the magnet will change the position of dark band artifacts within the image but will not change the position of a true dissection flap. Although the same phase cancellation and dark band artifacts exist in both single-shot and cine gradient echo techniques, it is often useful to perform a few cine-balanced gradient echo slices in addition to the single-shot images. These dynamic imaging sequences usually give the observer a sense for whether the abnormality seen on the single-shot images is artifact or true pathology.
After balanced gradient echo images are obtained, a single breath-hold set of fat-saturated low flip angle incoherent gradient echo images (two-dimensional [2D]
FMPSPGR/FLASH) can be obtained. This sequence will demonstrate subacute blood products such as extracellular methemoglobin, which will manifest bright signal intensity. It will also serve as a precontrast baseline for comparison to postcontrast imaging, if this is to be performed. Lastly, it is a sensitive evaluator of pancreatitis, whose clinical presenting symptoms of abdominal and/or back pain can often mimic aortic symptomatology.
FMPSPGR/FLASH) can be obtained. This sequence will demonstrate subacute blood products such as extracellular methemoglobin, which will manifest bright signal intensity. It will also serve as a precontrast baseline for comparison to postcontrast imaging, if this is to be performed. Lastly, it is a sensitive evaluator of pancreatitis, whose clinical presenting symptoms of abdominal and/or back pain can often mimic aortic symptomatology.
In the setting of examination for acute or immediate life-threatening aortic abnormalities, the above noncontrast sequences are accurate for making a determination of the presence and extent of aortic pathology (6).
At this point, if a patient’s exam is negative for aortic pathology, he or she can be safely returned to the emergency room for further evaluation. If an aortic abnormality is present, a decision can be made as to whether further imaging is warranted or whether immediate surgical attention is most prudent. For the more stable patients that present with positive aortic pathology, completion of a comprehensive abdominal exam can be performed, including fast-spin echo HASTE/SSFSE images, postcontrast time-resolved MRA and/or 3D MRA and 2D postcontrast fat-saturated FLASH/FMPSPGR.
Flow Quantification
Although flow quantification is frequently used in cardiac MR regarding shunts and valvular function and its use has been described to measure renal artery stenosis and mesenteric blood flow, flow quantification is rarely performed on the abdominal aorta itself. In cases of severe aortic stenosis, the same principles of flow quantification can be applied that apply elsewhere. Namely, a gradient echo quantified phase contrast sequence can be implemented to determine flow parameters, including peak velocity, across a stenosis (perpendicular to the direction of flow). The modified Bernoulli equation “4V2” can be applied where “V” equals the velocity, as measured in meters per second, is squared and then multiplied by 4 to yield the approximate gradient across a stenosis. Normal velocity in the aorta is less than 1.25 meters per second (m/s).
Contrast-enhanced Magnetic Resonance Angiography
Postcontrast imaging of the aorta can be performed in several different ways. Time-resolved imaging can be performed with a modicum of contrast on many newer machines (hardware/software packages after the year 2000). One example is projectional MRA, often referred to as “freeze-frame” or “subsecond angiography” after its subsecond temporal resolution capabilities. In subsecond MRA, 4 to 6 cc of gadolinium contrast is injected at 5 to 6 cc per second followed by a 15- to 20-cc saline flush. Although technically a 3D MRA acquisition, the images are acquired with the shortest TR (preferably <2 milliseconds), a wide bandwidth (>1,000 hz/pixel), and a small number (<12) of thick partitions (>8 mm) so that images are really only viewable in one axis and thus become projectional 2D angiograms in reality. The ultrashort TR gadolinium-enhanced imaging with a sacrifice of through-plane resolution coupled with in-line subtraction of mask images from the postcontrast frames is what enables this technique’s high-contrast, high temporal resolution performance. Subsecond MRA (Fig. 18-18) has been shown to demonstrate luminal course and caliber as well as differential flow patterns within aneurysms and dissections of the aorta (7).
More commonly, high spatial resolution contrast-enhanced 3D MRA is employed for accurate evaluation of the abdominal aorta. The standard 3D MRA sequence is a spoiled gradient-recalled echo sequence run with the minimum possible echo time (TE) and TR achievable (typically TR <4 milliseconds). The 3D volume (sometimes referred to as a slab) is placed in the coronal orientation and is typically 60 to 120 mm thick. This volume allows anterior–posterior coverage to include the entire abdominal aorta and its major branches, including the celiac trunk, splenic, hepatic, gastric, superior mesenteric, renal, and inferior mesenteric arteries. This volume also usually includes much of the descending thoracic aorta as well as the common iliac arteries. The slab can easily be tailored and placed slightly more anteriorly or posteriorly to focus on branch vessels such as the superior mesenteric artery (SMA) or renals, respectively (Fig. 18-19). The slab is composed of multiple partitions of thickness generally ranging from 0.8 mm to 4 mm, depending on individual MR unit capabilities. Some type of slice interpolation scheme is always used in the through-plane direction to help palliate partial volume averaging effects. Generally, somewhere between 30 and 45 actual partitions are acquired, and this is interpolated to 60 to 90 partitions of the aforementioned thickness.
Three breath-hold 3D MRA acquisitions are generally obtained—mask, arterial phase, and venous phase. The first 3D acquisition is prior to contrast administration and has a dual function to insure proper position and coverage as well as to serve as the mask acquisition. The mask will be the background image subtracted from subsequent postcontrast acquisitions to produce a higher contrast ratio
image, which truly mimics conventional digital subtraction angiograms. The angiographic 3D MRA is acquired at the time of maximal enhancement of the abdominal aorta and its branches. The start of this acquisition is predetermined by either a timing run preceding the 3D MRA or some type of fluoroscopic triggering. After a small period of breathing (generally, 10 to 20 seconds), the third breath-held 3D MRA is obtained coinciding with the venous phase of circulation. This acquisition typically displays the splenic, mesenteric, and renal veins to good advantage. The shortest possible delay between arterial and venous phase imaging is suggested to demonstrate splenic and renal veins to the greatest advantage. A 20-second delay after the arterial phase is suggested if mesenteric and portal veins are of greatest interest.
image, which truly mimics conventional digital subtraction angiograms. The angiographic 3D MRA is acquired at the time of maximal enhancement of the abdominal aorta and its branches. The start of this acquisition is predetermined by either a timing run preceding the 3D MRA or some type of fluoroscopic triggering. After a small period of breathing (generally, 10 to 20 seconds), the third breath-held 3D MRA is obtained coinciding with the venous phase of circulation. This acquisition typically displays the splenic, mesenteric, and renal veins to good advantage. The shortest possible delay between arterial and venous phase imaging is suggested to demonstrate splenic and renal veins to the greatest advantage. A 20-second delay after the arterial phase is suggested if mesenteric and portal veins are of greatest interest.
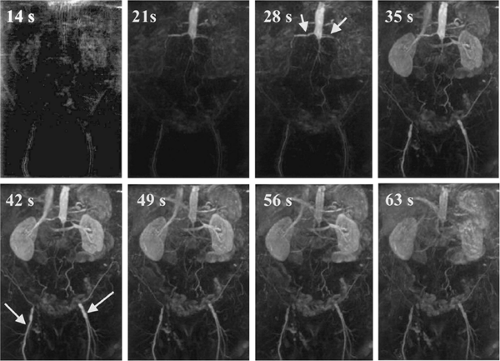 Figure 18-18 TRICKS imaging demonstrated in a 69-year-old man with aortic occlusion. 3D TRICKS time frames (TR = 7.8/TE = 1.7), demonstrating the peak arterial filling of the aortorenal arteries just above the occlusion at 28 seconds (short arrows) and the maximum signal intensity of the common femoral arteries at 42 seconds (long arrows). (Reprinted with permission from Swan JS, Carroll TJ, Kennell TW, et al. Time-resolved three-dimensional contrast-enhanced MR angiography of the peripheral vessels. Radiology. 2002; 225:43–52.) |
Contrast Enhancement Schemes
Dozens of contrast enhancement schemes have been proposed to leverage the intricacies of MRA. What follows is a general approach that can be tailored depending on exact equipment specifications. Double-dose gadolinium (0.2 mmol/kg) is useful for aortic imaging, although diagnostic images can often be created with far less contrast (as low as 0.05 mmol/kg). The aortic MRA itself only requires single
dose (0.1 mmol/kg); however, there are numerous reasons to use double dose instead of single dose if contrast cost is not the overriding issue in your practice. First, a typical aortic injection scheme is to inject contrast at 2 to 3 cc per second. If one injects 20 cc of contrast (single dose for a 100-kg person) at 2 cc per second, then the bolus duration is only about 12 to 15 seconds (10 seconds of infusion plus a few seconds of leeway due to the fact that the injected bolus dilutes or spreads out to a larger volume and time as it is injected and carried in the blood). Most MR machines require a greater length of time to make an adequate 3D image than 12 seconds. If one injects double-dose contrast, then the imaging window lengthens to roughly 25 to 30 seconds, depending on cardiac output and various other factors influencing circulation time. This longer bolus makes it easier for the technologist to obtain images dur-ing an appropriately contrasted window. Furthermore, although the arterial phase images may have adequate contrast in the aorta at 0.1 mmol/kg injections, venous images of the mesenteric, renal, and portal veins benefit from the higher initial concentration of gadolinium (0.2 mmol/kg), as it is diluted to a vastly larger volume by the venous phase of imaging.
dose (0.1 mmol/kg); however, there are numerous reasons to use double dose instead of single dose if contrast cost is not the overriding issue in your practice. First, a typical aortic injection scheme is to inject contrast at 2 to 3 cc per second. If one injects 20 cc of contrast (single dose for a 100-kg person) at 2 cc per second, then the bolus duration is only about 12 to 15 seconds (10 seconds of infusion plus a few seconds of leeway due to the fact that the injected bolus dilutes or spreads out to a larger volume and time as it is injected and carried in the blood). Most MR machines require a greater length of time to make an adequate 3D image than 12 seconds. If one injects double-dose contrast, then the imaging window lengthens to roughly 25 to 30 seconds, depending on cardiac output and various other factors influencing circulation time. This longer bolus makes it easier for the technologist to obtain images dur-ing an appropriately contrasted window. Furthermore, although the arterial phase images may have adequate contrast in the aorta at 0.1 mmol/kg injections, venous images of the mesenteric, renal, and portal veins benefit from the higher initial concentration of gadolinium (0.2 mmol/kg), as it is diluted to a vastly larger volume by the venous phase of imaging.
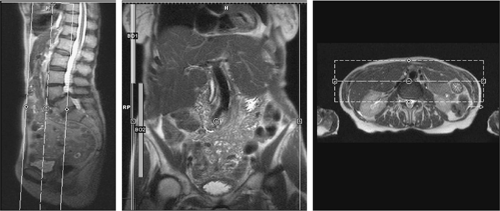 Figure 18-19 MRI screen capture showing positioning of the 3D MRA slabs on the sagittal and axial scout images for an abdominal aorta MRA. The lateral limits of the field are demonstrated in the coronal plane image. In this example, the mesenteric circulation as well as the main renal arteries to the renal hilar are included. |
Subtraction Imaging
Subtraction imaging is typically performed where a noncontrast (mask) 3D MRA data set is subtracted from subsequent contrast-enhanced 3D MRA data sets. The importance of this step is related to how robust the contrast enhancement is and the availability and capability of postprocessing tools. The strength of MRI is that the contrast differential between gadolinium-enhanced arterial signal and background is much greater than the differential seen between iodinated CT contrast attenuation values of arteries versus background.
Multiple vendors sell hardware and software systems that are designed to import raw data (DICOM) and process these data into realistic 3D images. The most common modes of display include MIP, multiplanar reformatting (MPR), and VR (see Chapter 6 for further details). If a contrast-enhanced MRA has a particularly high contrast signal within arteries and a relatively low background tissue signal, then actual subtraction imaging is often not necessary. Some 3D workstations are capable of auto segmentation and through a series of complex algorithms perform their own scaling to remove background tissue signals and only display the vascular tree. If arterial signal is not greatly higher than background, then subtraction techniques help to raise the contrast level between the artery in question and the background. This is more critical with imaging smaller branch vessels and is less important when imaging the aorta itself due to its relatively large size.
Caution must be exercised when performing evaluation of aortic MRA just as with any MRA. Source images and MPR interrogation of the data set must be performed, otherwise intraluminal abnormalities such as dissection and shelflike plaque will be missed during viewing of projectional images (MIP) only (Fig. 18-20).
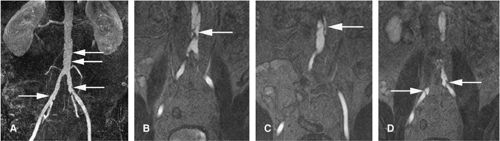 Figure 18-20 A: MIP of aortoiliac MRA showing mild atherosclerotic irregularity (arrows) but does not demonstrate underlying dissection. B, C: Source MRA images demonstrating aortic dissection (arrows). D: Source MRA image better demonstrating bilateral common iliac dissections (arrows) not well seen on MIP. |
Postcontrast Two-dimensional Imaging
Although not mandatory, it is often extremely beneficial to obtain at least a limited number of 2D images after a 3D MRA is performed. For the abdominal aorta, these are typically obtained in axial and coronal planes although sagittal is acceptable as well. These delayed 2D images are obtained with a fat-saturated spoiled gradient-recalled echo sequence like FLASH or FMPSPGR and can reasonably be obtained any time within 20 minutes after contrast administration.
They are most beneficial to show mural abnormalities of the aorta, periaortic pathology, and more diffuse abdominal abnormalities in neighboring organs. One must bear in mind that the 3D MRA is really a lumenogram, only demonstrating the aortic lumen in any detail. Critical pathology such as mural thrombus, aneurysm, wall thickening, and plaquing is only demonstrated through additional standard 2D sequences. Furthermore, a small but important percentage of incidental disease (e.g., renal, hepatic, pancreatic, adrenal, and bowel tumors) is detected in the solid and hollow organs as a result of these additional sequences.
Multiphase Exams
Clinical Protocols
Rapid Aorta Protocol for Emergent Evaluation
Axial stack of single-slice steady state gradient echo images
Coronal stack of single-slice steady state gradient echo images
Axial cine steady state gradient echo at the level of the renal arteries
Coronal cine steady state gradient echo
Comprehensive Aorta Protocol (add to the above Rapid Aorta Protocol)
Axial or coronal precontrast HASTE/SSFSE images for evaluation of surrounding abdominal structures, including bowel
Axial and coronal precontrast-enhanced fat-saturated, fast incoherent gradient echo images
(Optional for cases with stenosis) Phased contrast flow quantification sequence at site of stenosis if spin dephasing is noted on cine sequences
(Optional) Contrast-enhanced coronal subsecond MRA
Stay updated, free articles. Join our Telegram channel

Full access? Get Clinical Tree


