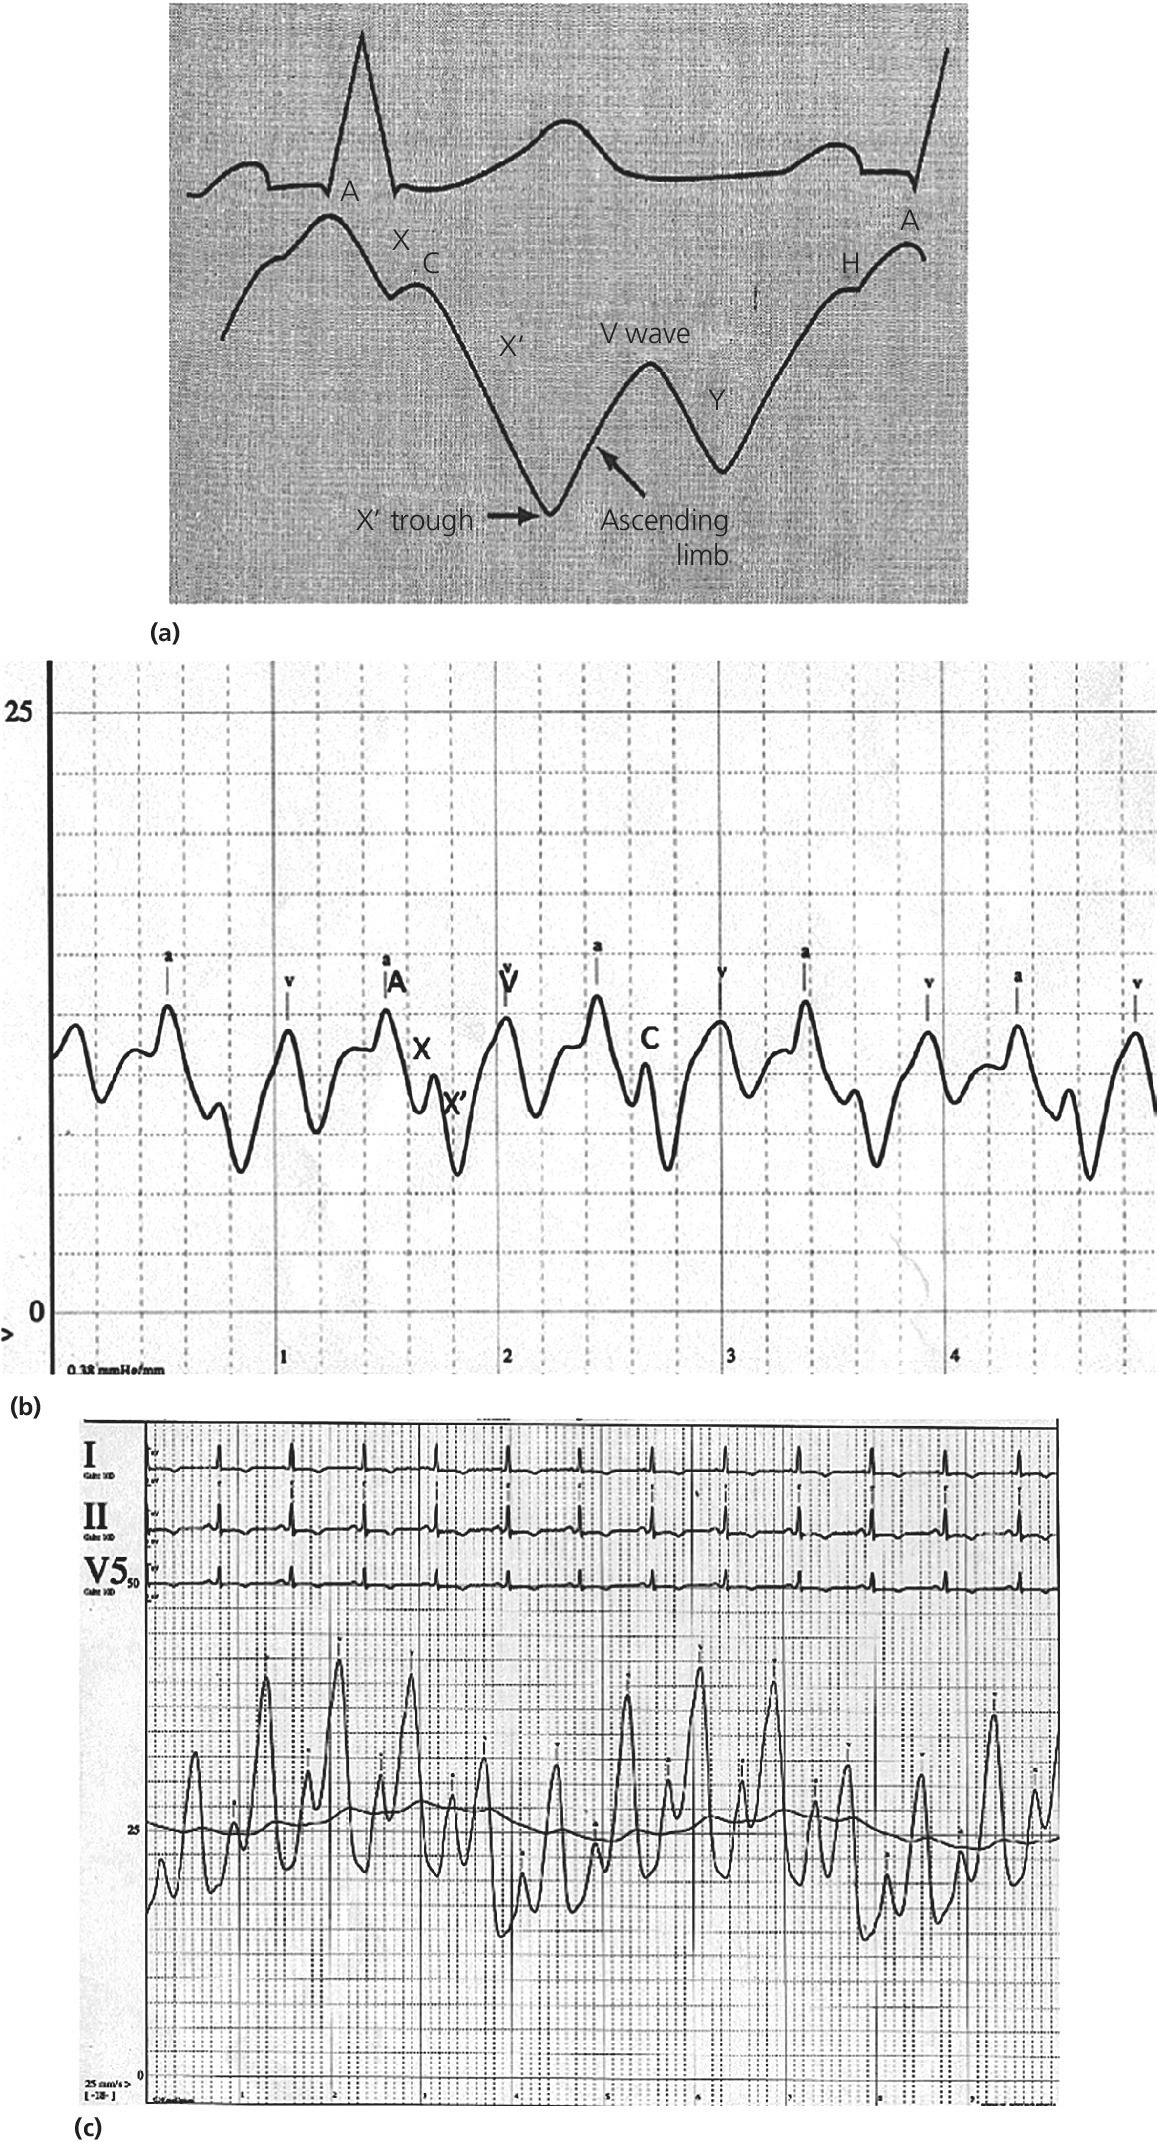
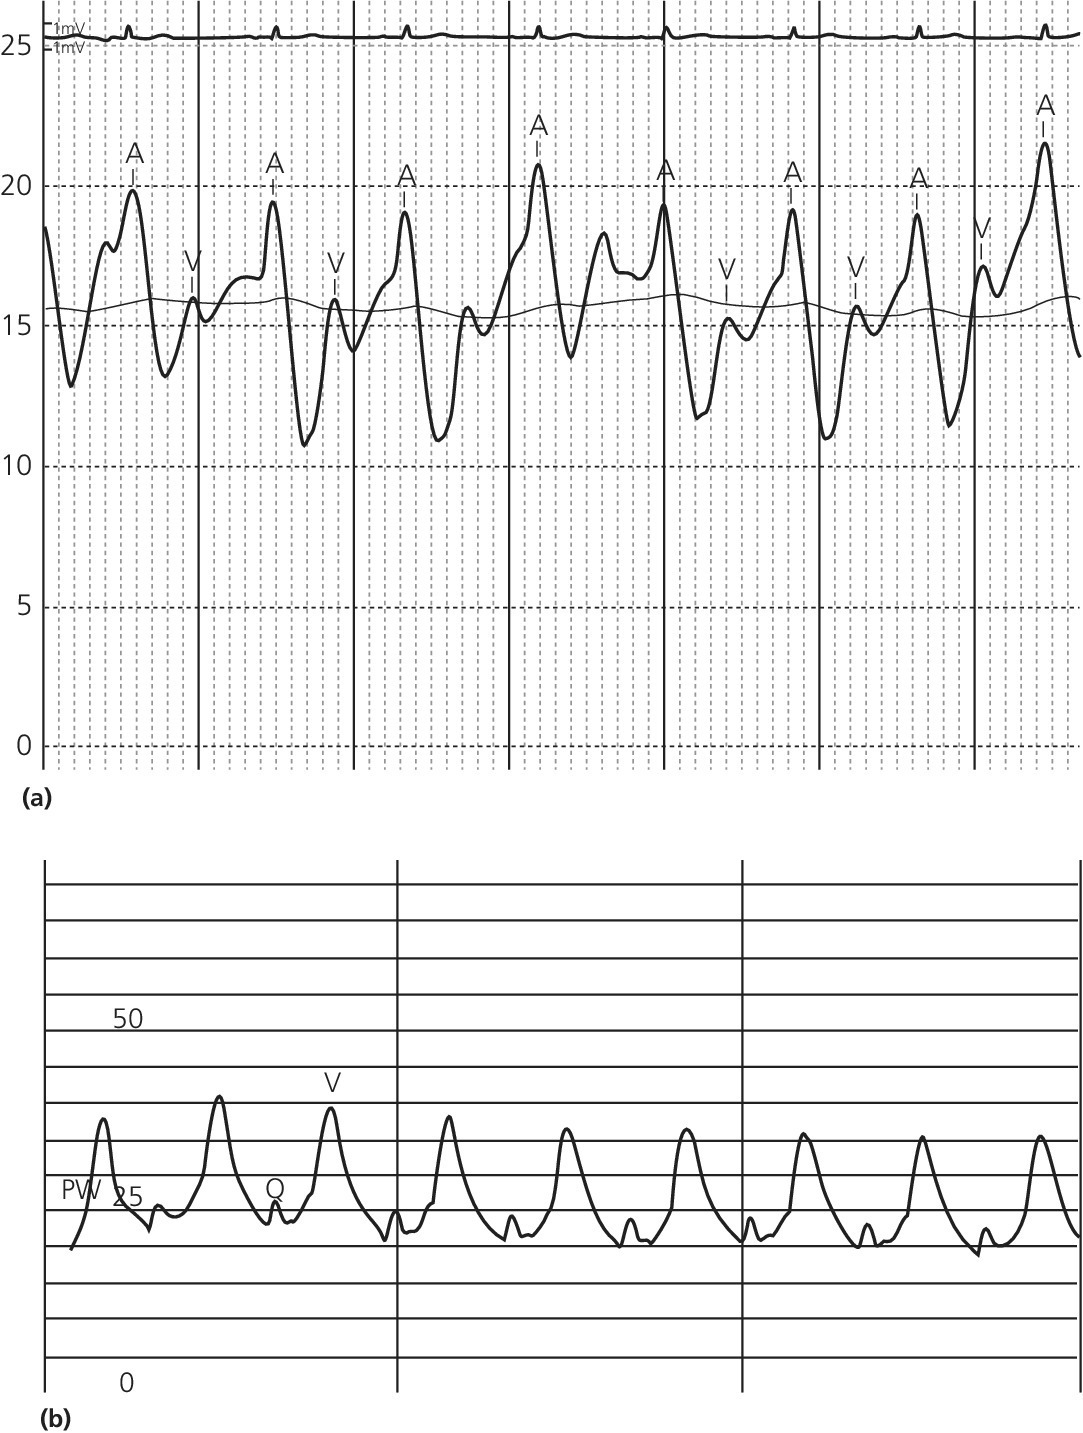
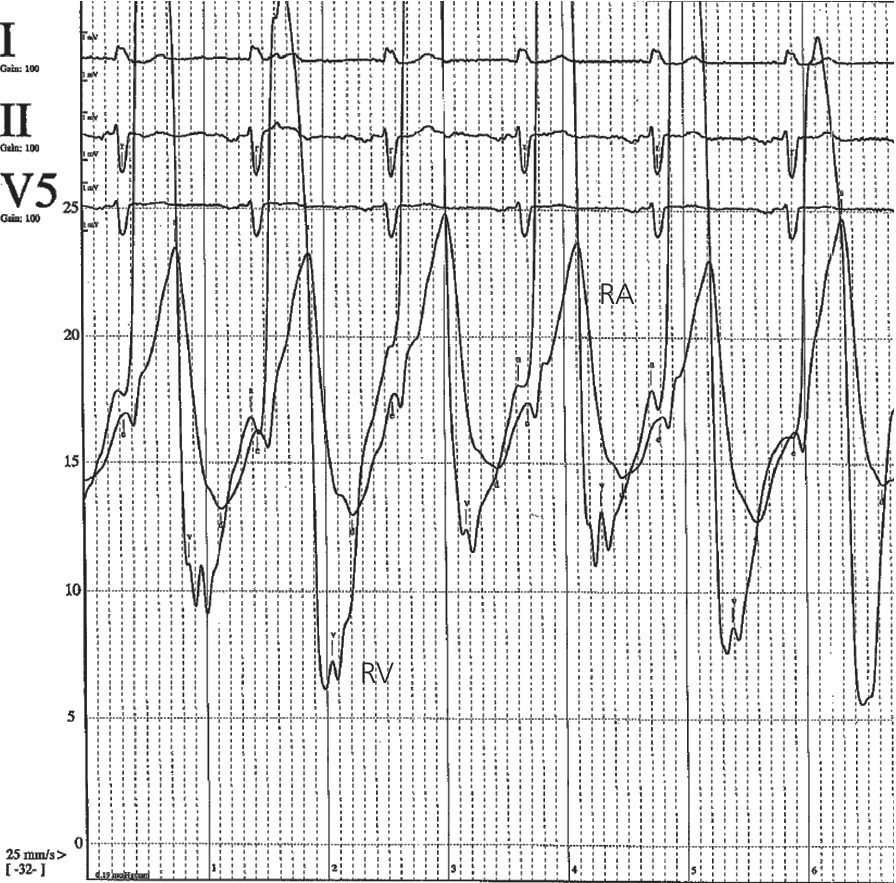
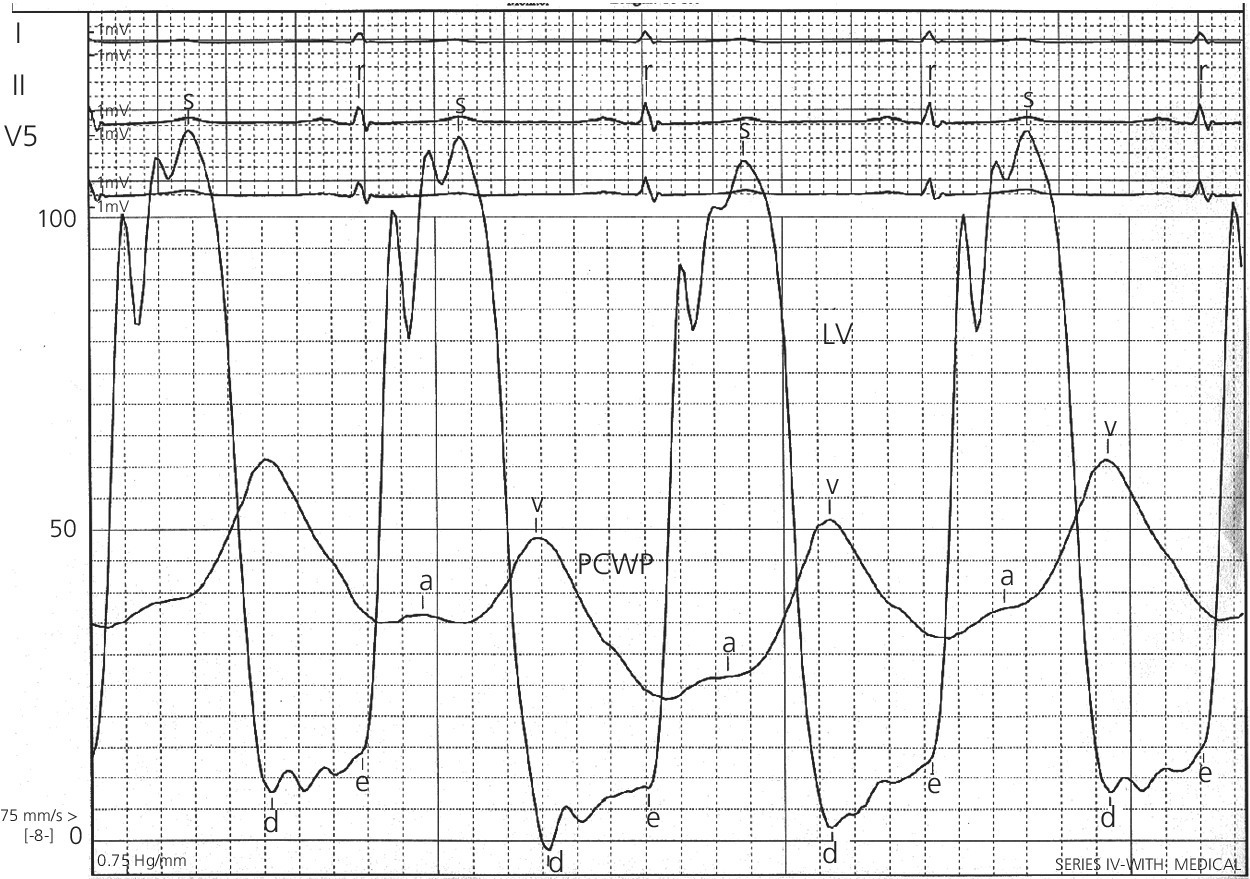
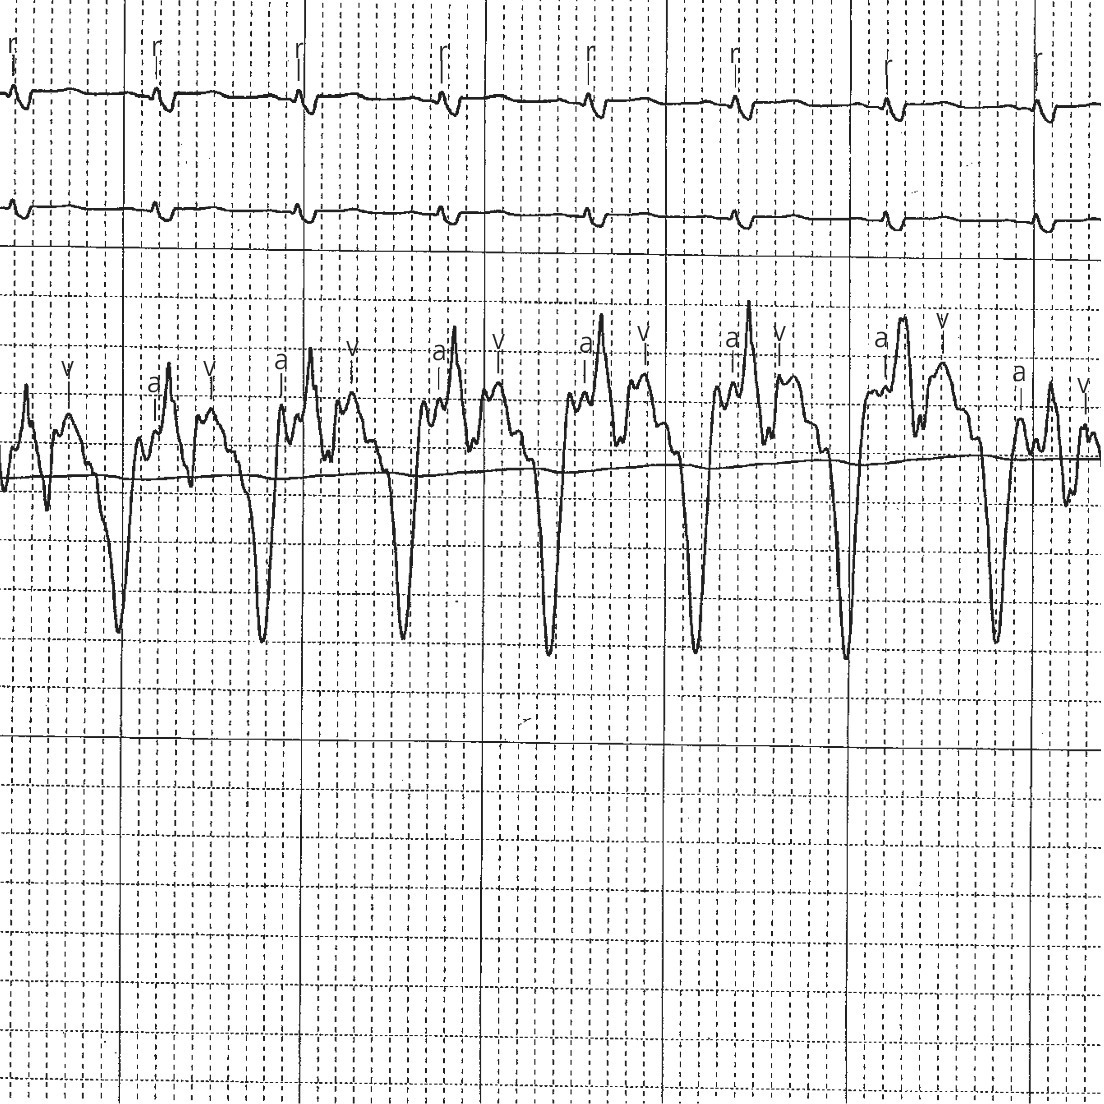
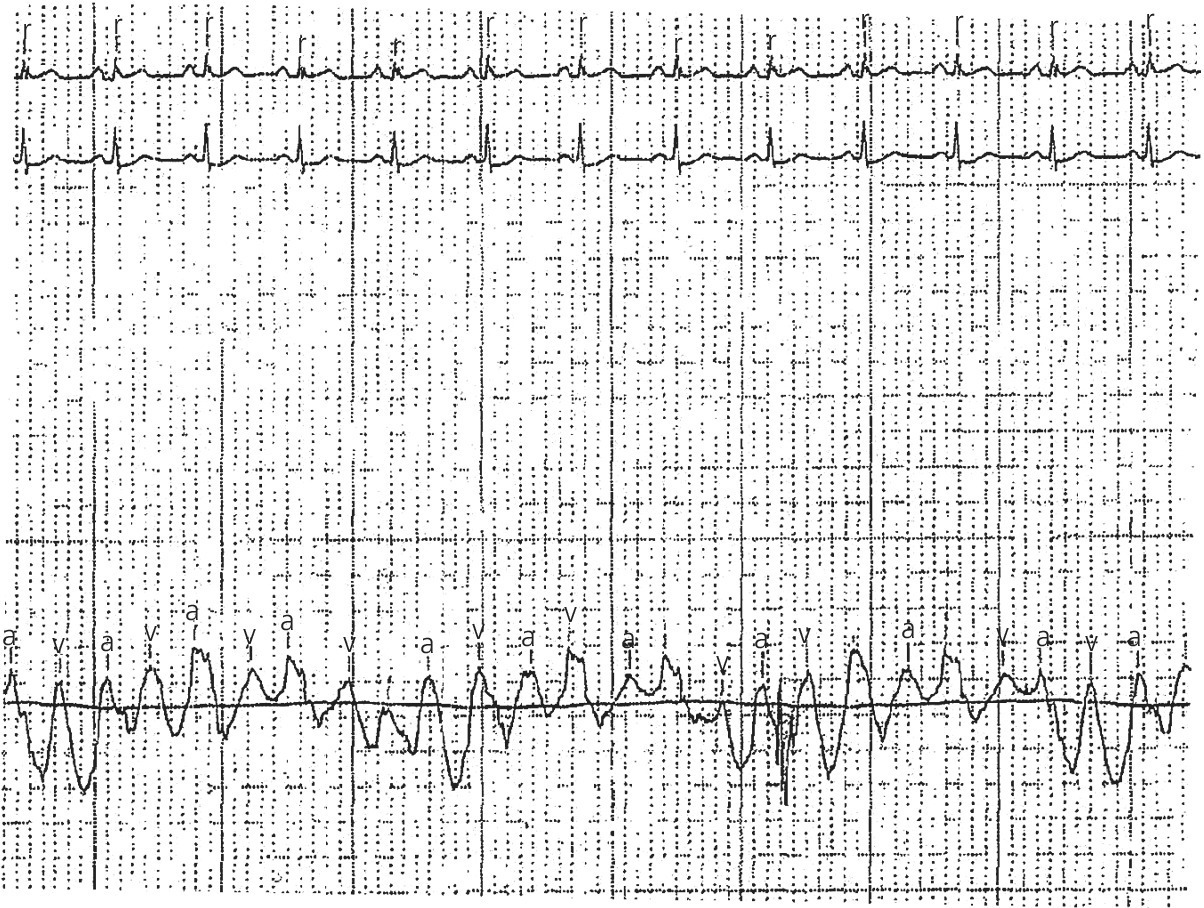
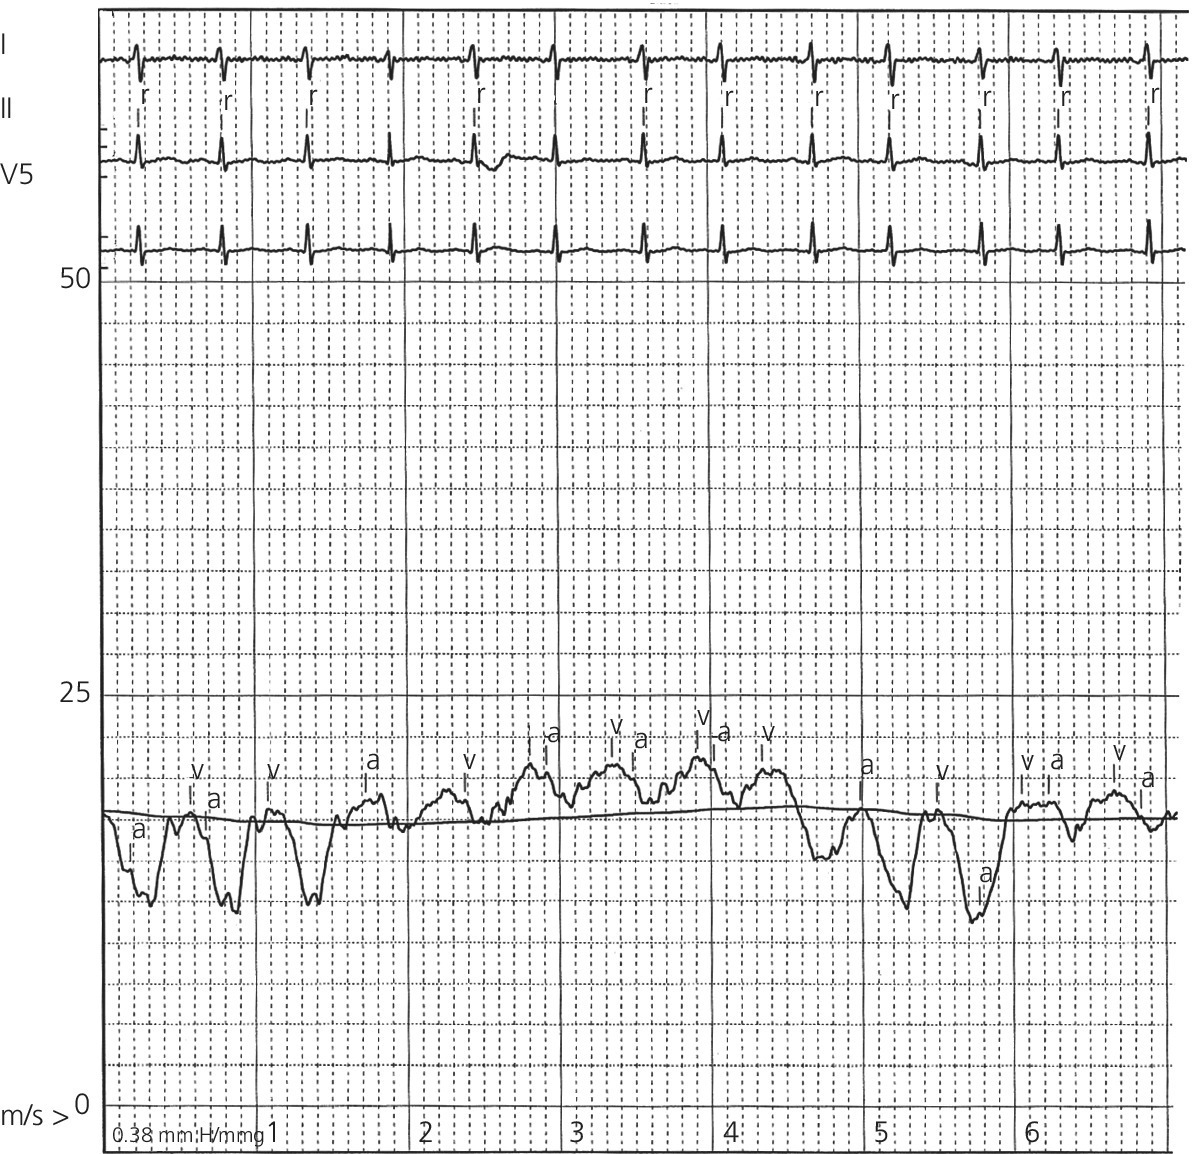
CHAPTER 5 David P. McLaughlin and George A. Stouffer A fundamental understanding of the atrial waveform is extremely important for anyone applying hemodynamics to patient care. Data regarding volume status, valvular pathology, and ventricular compliance are contained within the tracings when examined carefully. The right atrial (RA) waveform is typically measured directly with a fluid‐filled pressure catheter. The left atrial waveform can be measured directly by transeptal atrial puncture or more commonly indirectly via a balloon‐tipped pulmonary artery catheter. In most cases, the pulmonary capillary wedge pressure (PCWP) accurately reflects mean left atrial (LA) pressure; however, the pressure wave deflections are delayed and damped on a PCWP tracing compared to LA pressures [1]. Similarly, the timing of the atrial waves and descents in reference to the electrocardiogram (ECG) will occur later in the PCWP tracing than the RA tracing, because of the delay in transmission of pressures from the left atrium through the pulmonary vein, capillaries, and pulmonary artery to the tip of the catheter. In patients who are in sinus rhythm, the atrial waveform is composed of two positive and two negative deflections (Figure 5.1). The A wave is caused by atrial contraction and usually occurs 60–80 milliseconds after the onset of the P wave on the ECG. The A wave is delayed to about 200 milliseconds after the onset of the P wave when measured using PCWP, due to the time delay in transmission of the reflected wave. The A wave is absent in atrial fibrillation (because of the lack of atrial contraction) and is exaggerated in patients with a noncompliant ventricle or in the presence of tricuspid or mitral stenosis. Figure 5.1 Atrial pressure waveforms. Schematic (a) and actual tracing (b) of RA pressure showing A and V waves and X and Y descents. Panel (c) is a PCWP tracing showing V > A. Source: Mark 1998. Reproduced with permission of Elsevier [2]. The decay of the A wave is the X descent, which is due to the decrease in atrial pressure as a consequence of atrial relaxation (Figure 5.1). In the RA the X descent is often interrupted by a small positive deflection, and the C wave results from closure of the tricuspid valve during isovolumetric contraction of the ventricle. The C wave is more commonly seen in RA compared to PCWP tracings and is prominent in patients with prolonged PR intervals. Additional X descent after the C wave is referred to as the X′ descent. The second positive deflection in the atrial pressure tracing is the V wave, which represents rapid atrial filling during ventricular systole while the atrioventricular valve is closed. The peak of the V wave usually corresponds to the T wave on the ECG. The decay of the V wave is referred to as the Y descent (Figure 5.1). The Y descent corresponds to rapid ventricular filling in early diastole. The waveforms are dependent on heart rate. Tachycardia reduces the duration of diastole and can abbreviate the Y descent, thus causing the V and A waves to merge. Bradycardia causes the waves to become more distinct and can elicit an H wave, a mid‐ to late‐diastolic plateau that follows the Y descent and precedes the A wave. The mean LA pressure is higher than the mean RA pressure in the normal heart. The A wave is usually higher than the V wave in the RA; in the LA either the V wave is greater than the A wave or the A and V waves are nearly equal. Also in the normal heart, mean atrial pressure falls with inspiration. The opposite effect, in which the mean RA pressure does not decrease with inspiration, is seen in constrictive pericarditis and occasionally other conditions (referred to as Kussmaul’s sign). It is important to remember that atrial pressure tracings represent pressure (and provide some indirect information on atrial volume) but not flow. Venous return to the RA is dependent on the pressure gradient between the venous system and the RA. Consequently, venous return to the RA is maximal during period of low pressure (X and Y descents). Elevations in RA pressure are often a clue to cardiovascular pathology. Increased mean RA pressure is seen in valvular heart disease, constrictive pericarditis, restrictive cardiomyopathy, cardiac tamponade, fluid overload (e.g., renal failure), pulmonary hypertension, left to right shunts, pulmonary embolus, RV infarction, LV systolic or diastolic failure, and congenital heart disease. It is important to note that mean RA pressures may appear normal in patients with heart disease who are dehydrated. The A wave is accentuated in patients with noncompliant ventricles and therefore can be increased in patients with ventricular ischemia, infarction, or hypertrophy from pressure or volume overload. A prominent RA A wave can occur in tricuspid regurgitation, pulmonic regurgitation, or stenosis as well as pulmonary embolus or cor pulmonale from any cause (Figure 5.2a and Tables 5.1 and 5.2). Intermittent cannon A waves can be seen in complete heart block or ventricular tachycardia as the atria are contracting intermittently against a closed AV valve (Figure 5.2b). In patients with atrial flutter or atrial tachycardia, A waves may be present at an accelerated rate. Small A waves are rare in RA tracings but common in LA tracings (Figure 5.2c). Figure 5.2 Examples of prominent A waves (a) and V waves (b). Table 5.1 Conditions associated with abnormal right atrial pressure tracings. Table 5.2 Right atrial pressure tracing findings in various conditions. Abnormalities in the X descent are seen with severe tricuspid regurgitation (TR) or mitral regurgitation (MR) when the X descent and C wave can be interrupted by a prominent V wave. The V wave reflects atrial pressures during ventricular systole and thus can be useful as a clue to the presence of AV valve regurgitation. In the RA a prominent V wave can be seen in patients with tricuspid regurgitation and the RA pressure tracing can take on a ventricularized character when TR is severe (Figure 5.3) [3]. Ventricularization of the RA pressure tracing is the most specific finding, but is found in a minority of patients with severe TR (see Chapter 13). In a study of 60 patients who had right ventriculography, Lingamneni et al. found that ventricularization of the right atrial pressure contour was present in only 40% of patients with severe TR [4]. Cha et al., in their study of 59 patients with severe TR diagnosed on right ventriculography and/or at the time of surgery, found that a ventricularization pattern was present in 31%, and that prominent V waves (not further defined in the paper) and steep Y descents were present in an additional 37% of the patients [5]. In contrast, Pitts et al. reported that neither prominent right atrial V waves nor elevated mean right atrial pressures reliably predicted the presence of moderate or severe tricuspid regurgitation (as determined by echocardiography), but that the absence of right atrial V waves and elevated mean right atrial pressures were relatively specific for excluding significant tricuspid regurgitation [6]. For the purposes of their study, a “prominent” right‐sided V wave was defined as (1) V wave >15 mm Hg, (2) a difference between V wave and mean RA pressure >5 mm Hg, or (3) a ratio of V wave to mean RA pressure >1.5. Figure 5.3 Pressure tracing from a patient with severe tricuspid regurgitation. Simultaneous RA and RV pressures are recorded in a 60‐year‐old male with severe TR. Note the ventricularization of the atrial pressure. Commonly, however, the left‐sided V wave receives the most attention and that is what we will focus on in this section (examples are shown in Figure 5.4). The PA systolic pressure waveform and left atrial V wave are generated at the same time (assuming that the ventricles contract at the same time), however the V wave in the PCWP tracing will be seen later because of the delay in transmission of left atrial pressure to the catheter tip. Moore et al., in their study of 13 patients with large V waves, found that the onset of the V wave was approximately 110 milliseconds after the onset of the pulmonary arterial upstroke [7]. Figure 5.4 Examples of prominent V waves. The V wave in the PCWP (or LA) tracing is dependent on the pressure–volume relationship of the left atrium and left atrial compliance as well as the volume of blood entering the atrium. A large V wave indicates a rapid rise in LA pressure during ventricular systole and can occur in setting of a noncompliant left atrium and normal flow (e.g., atrial ischemia) or a normally compliant left atrium with large flow (e.g., acute mitral regurgitation). Conversely, if the left atrium has a large capacitance then a prominent V wave may be absent even in the presence of severe mitral regurgitation. In the left atrium or pulmonary capillary wedge pressure tracing, a prominent V wave suggests mitral regurgitation, but is neither sensitive nor specific. Some investigators have advocated using a grading system where a V wave that is twice the mean wedge pressure is suggestive of severe MR and a V wave maximum of three times mean wedge pressure is diagnostic of severe MR, but this has not been widely validated (Table 5.3). Although not typical, a prominent V wave can occasionally be observed in patients with mitral stenosis if the LA is relatively noncompliant, with limited ability to accept expanded filling volumes. Table 5.3 Important points about V waves. In patients with severe MR and a large V wave, mean PCWP can overestimate LV end‐diastolic pressure. In a study by Haskell and French [8], mean PCWP pressure overestimated LVEDP by approximately 30% (in this study, a large V wave was defined as being greater than the A wave by more than 10 mm Hg). A better estimate of LVEDP was obtained by using the trough of the X descent. The Y descent or decay in the V wave occurs during the opening of the AV valve and represents rapid emptying of the atria into the ventricle (which results in a drop in pressure). It is a marker of passive ventricular filling and thus anything that prevents or enhances early diastolic filling affects the character of the Y descent. Conditions with high ventricular pressures during early diastole tend to be associated with blunted Y descents (e.g., tamponade or mitral stenosis). Y descents are usually blunted in cardiac tamponade but can become more prominent during inspiration; the Y descent becomes more apparent following pericardiocentesis. Conditions with low ventricular pressures during early diastole and prominent passive filling of the ventricle (e.g., constrictive pericarditis) tend to have large Y descents. Various examples of Y descents are shown: mitral stenosis can cause an attenuation or flattening of the terminal Y descent (Figure 5.5); venous pressures are elevated and Y descents are prominent in constrictive pericarditis (Figure 5.6); both X and Y descents are blunted in a case of right ventricular infarction (Figure 5.7); and Y descents are blunted, especially during expiration, in a case of cardiac tamponade (Figure 5.8). The Y descent can vary with the position of the patient in the rare instance of large atrial myxoma. Figure 5.5 Example of simultaneous PCWP and left ventricular pressure tracings in a patient with mitral stenosis and mitral regurgitation. Note the persistent pressure gradient between the chambers throughout diastole. Note also that the PCW pressure is delayed relative to LV pressure, and that accurate determination of diastolic pressure gradient and mitral valve area requires shifting the PCWP tracing to the left. The V wave on the PCWP tracing should coincide with the downstroke (isovolumetric relaxation) of the LV tracing. Figure 5.6 RA tracing in a patient with constrictive pericarditis. Constrictive pericarditis and restrictive cardiomyopathy are two hemodynamic states that cause significant abnormalities of the atrial wave with prominent Y descents. There are typically high atrial pressures and prominent early diastolic filling waves. Figure 5.7 RA tracing in a patient with right ventricular myocardial infarction. RV infarction can occasionally cause a pattern of pseudoconstriction with a prominent X and Y descent. This occurs due to acute distention of the volume overloaded RV into a contained pericardial space. Figure 5.8 RA tracing in a patient with pericardial tamponade. Tamponade results in pandiastolic restriction of ventricular filling, as pericardial pressure exceeds RA pressure throughout diastole. This results in blunting of both the X and Y descents, which often return following successful pericardial drainage. Physical examination of jugular venous pulse (JVP) provides valuable information to clinicians, as the JVP is a manometer of pressure in the right atrium. To determine JVP, sit the patient at 45° and turn his or her head slightly away from you. Use the internal jugular vein (not external jugular vein) medial to the clavicular head of sternocleidomastoid and measure JVP in centimeters above the sternal notch (vertical not diagonal distance). The venous pulse can usually be analyzed more readily using the right internal jugular vein, as the right innominate and jugular veins extend in an almost straight line from the superior vena cava. Sir Thomas Lewis in 1930 proposed a simple bedside method for measuring central venous pressure. He found that the catheter‐measured CVP was equal to 5 cm plus the vertical distance of the JVP from the sternal angle and that this measurement was independent of the individual’s position (e.g., supine, semiupright, or upright). Remember that CVP in cm of blood must be divided by 1.34 to get pressure in mm Hg. Also note that the distance between the sternal angle and the midportion of the RA, which Lewis estimated at 5 cm, varies considerably between individuals and is affected by age and anterior–posterior diameter of the chest [9]. JVP can be used to assess right heart filling pressures and the waveform can provide information suggestive of specific diagnoses. Raised JVP with normal waveform is suggestive of right heart failure and/or fluid overload. The lack of pulsations in a patient with elevated JVP would be suggestive of SVC obstruction. Various abnormalities of the A wave, V wave, X descent, or Y descent suggest diseases outlined in Tables 5.2 and 5.3. An increase in JVP with inspiration (Kussmaul’s sign) is suggestive of constrictive pericarditis.
The atrial waveform
The components of the atrial wave
Abnormalities in atrial pressures
Prominent
Blunted
A wave
A–V dissociation (e.g., complete heart block or ventricular tachycardia)
Atrial arrhythmia
Decreased ventricular compliance
Tricuspid regurgitation or stenosis
Pulmonary stenosis or regurgitation
X descent
Tamponade
Atrial arrhythmia
RV ischemia (without RA involvement)
RA ischemia
Atrial septal defect
Tricuspid regurgitation
V wave
Tricuspid regurgitation
Tamponade
RV failure
Constrictive pericarditis
Hypovolemia
Y descent
Constrictive pericarditis
Tamponade
Restrictive cardiomyopathy
RV ischemia
Tricuspid regurgitation
Tricuspid stenosis
V wave
Y descent
A wave
X descent
RA mean pressure
Misc.
Normal
Atrial filling following ventricular contraction
Rapid ventricular filling phase
Atrial contraction
0–5
RA: A > V
LV: V > A
normal delay in pressure transmission from LA to pulmonary cap: 140–200 ms
Constriction
Prominent
Preserved
Elevated
Tracings can have M or W form; Kussmaul’s sign
Tamponade
Small/absent
Preserved
Elevated
Effusive constrictive
Prominent
Persistent elevation after pericardiocentesis
RA pressure remains elevated despite complete drainage (pericardial pressure = 0)
Restriction
Prominent
Preserved
Elevated
RA tracings can have M or W form
RV infarct
Impaired
Elevated
RA intact: increased A wave and steep X descent
RA infarct: decreased A wave and impaired X and Y descents
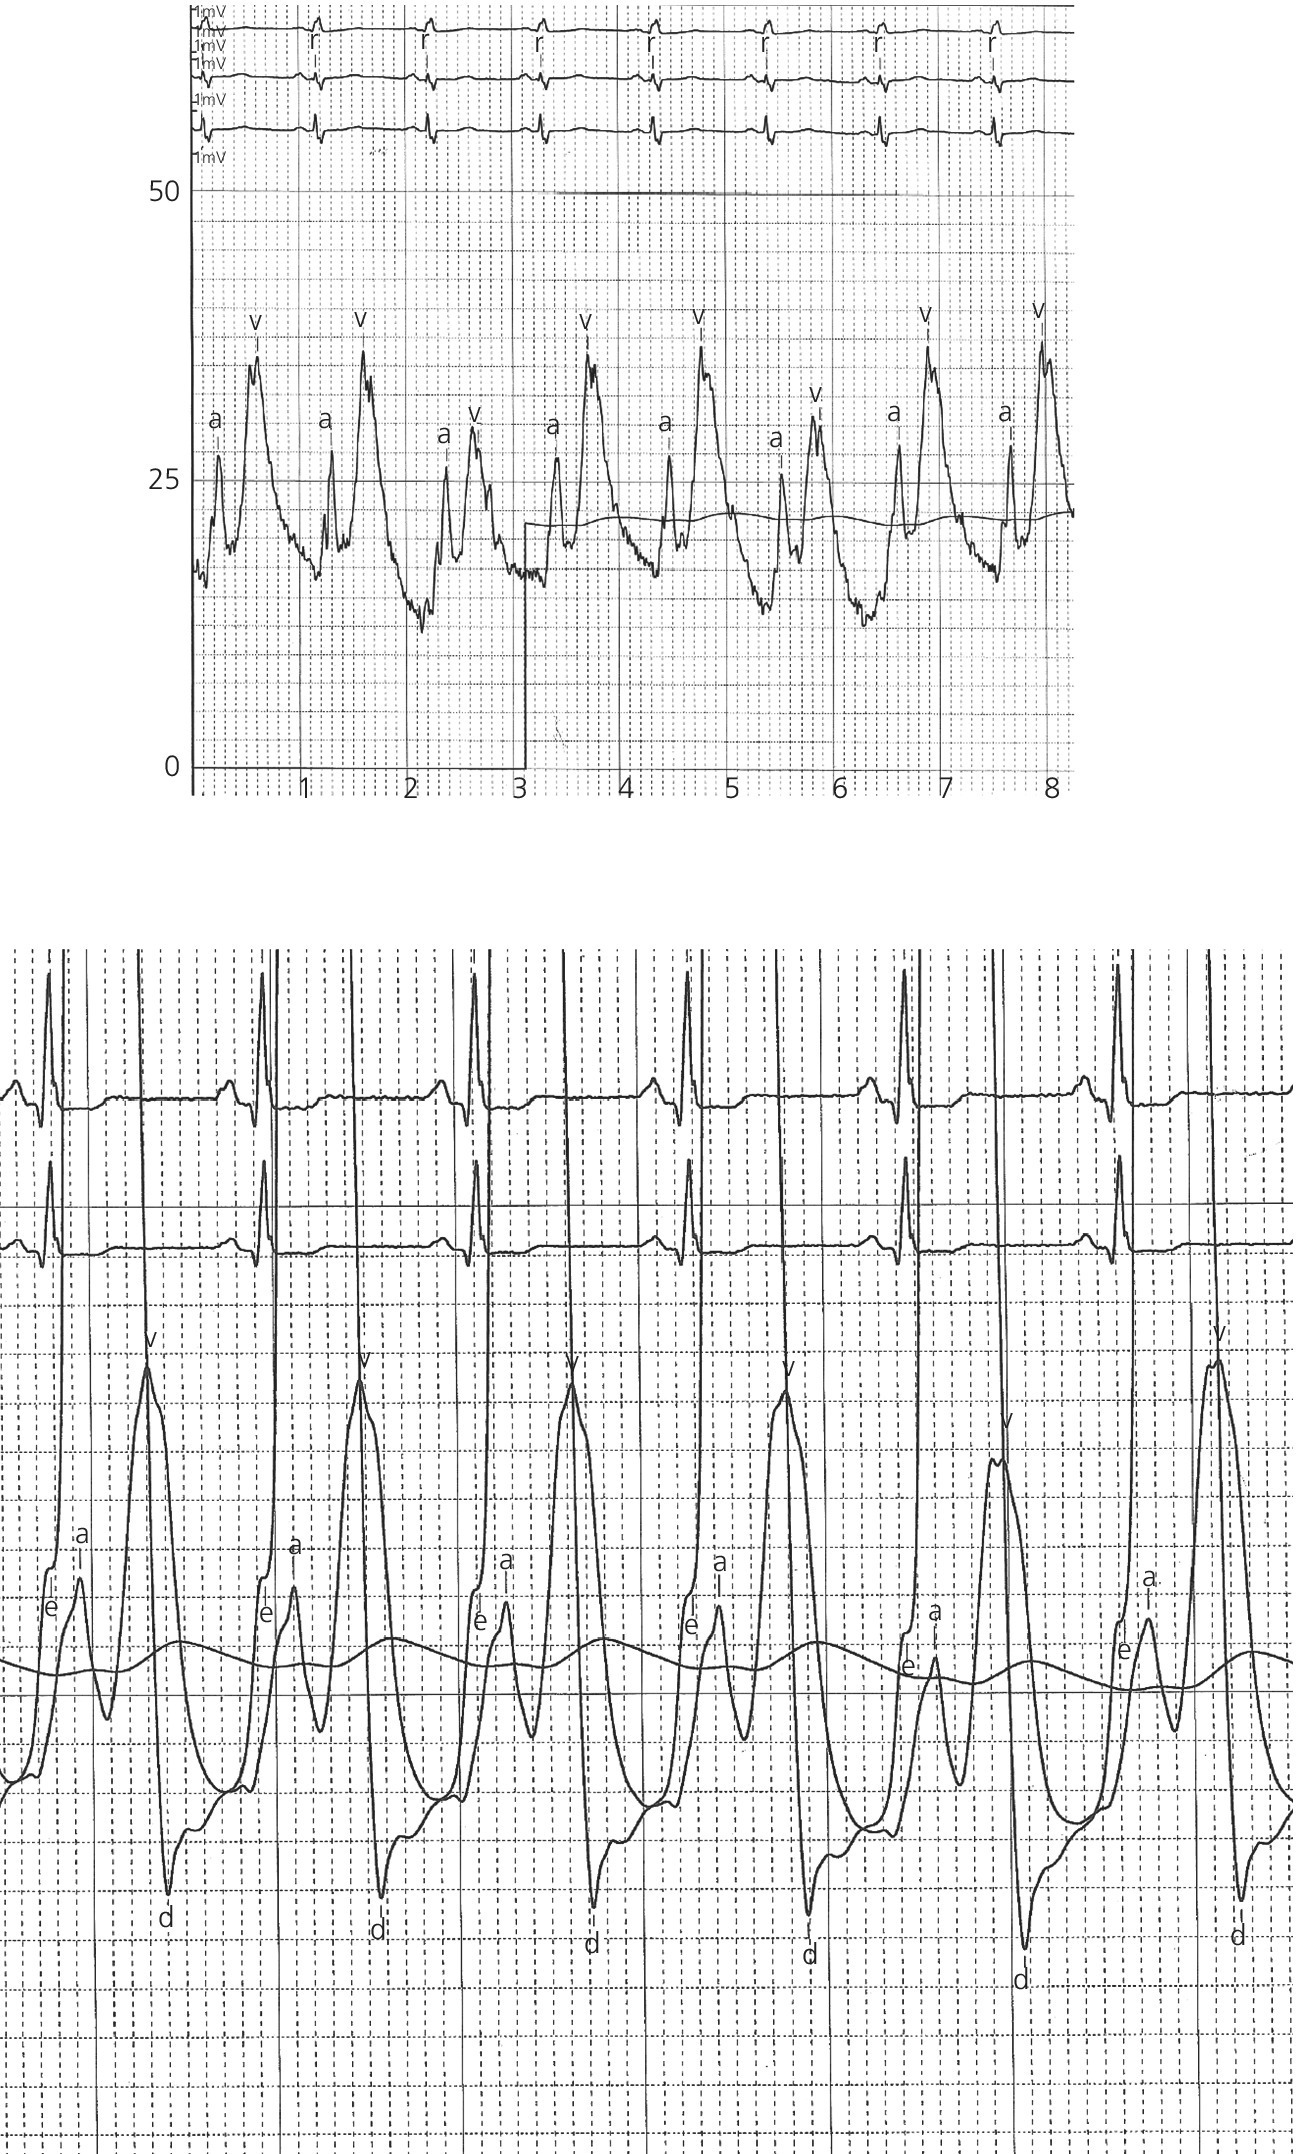
The V wave on PCWP tracing corresponds to (1) T wave on ECG and (2) descent of pressure tracing on LV recording
V wave >2x mean PCWP is suggestive of severe MR
V wave >3x mean PCWP is diagnostic of severe MR
Absence of significant V waves does not exclude significant MR
When large V waves are present, trough of Y descent is better predictor of LVEDP than is mean PCWP [8]
V waves are affected by arterial systolic blood pressure (i.e., ventricular afterload)
Physical exam
Important points
Stay updated, free articles. Join our Telegram channel

Full access? Get Clinical Tree


