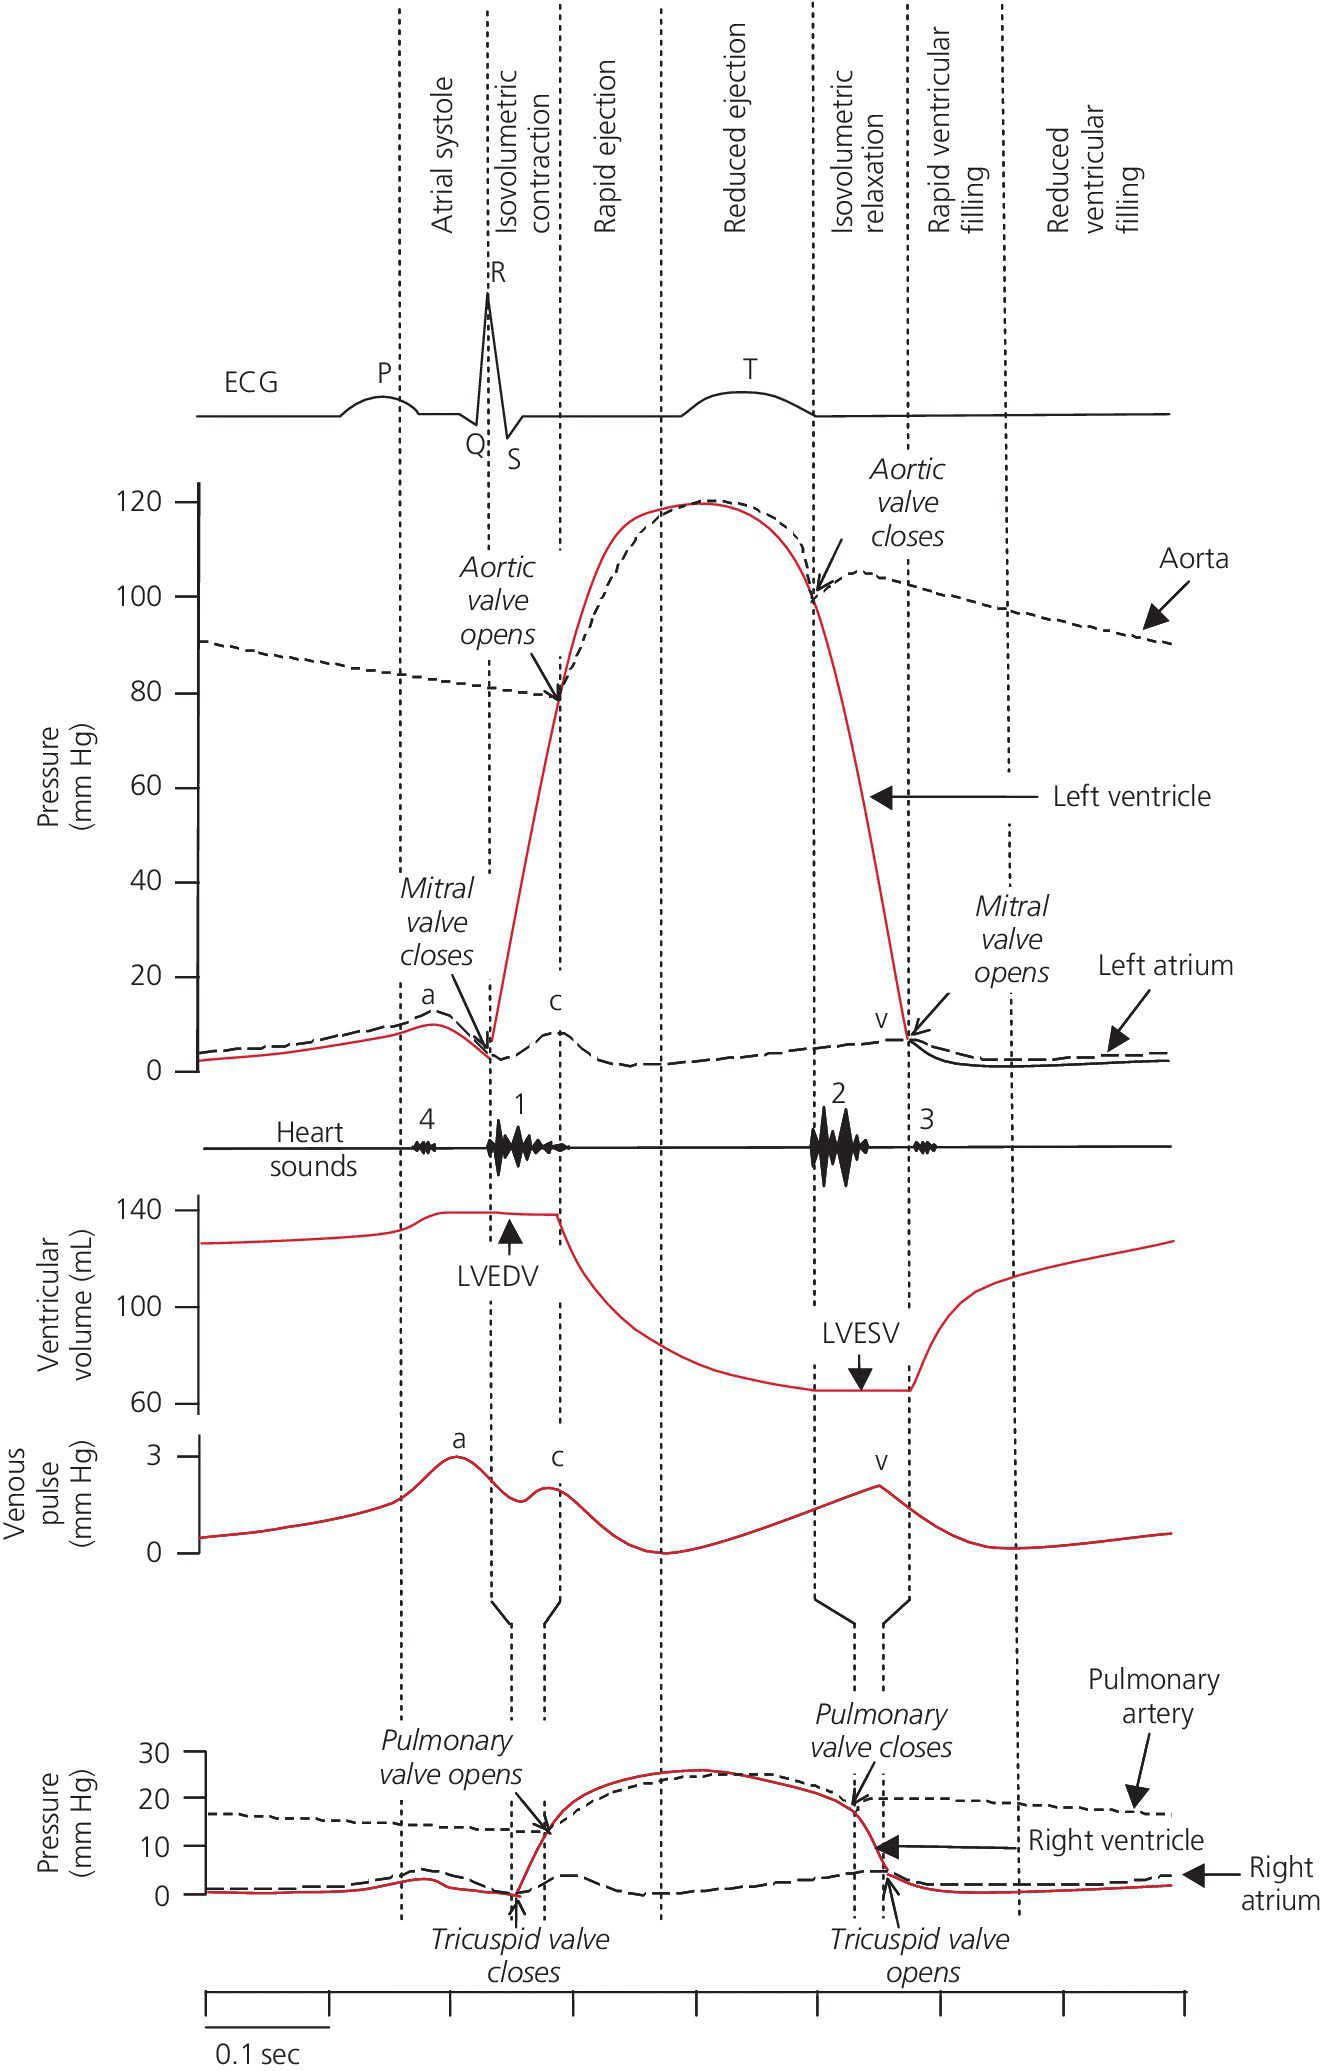
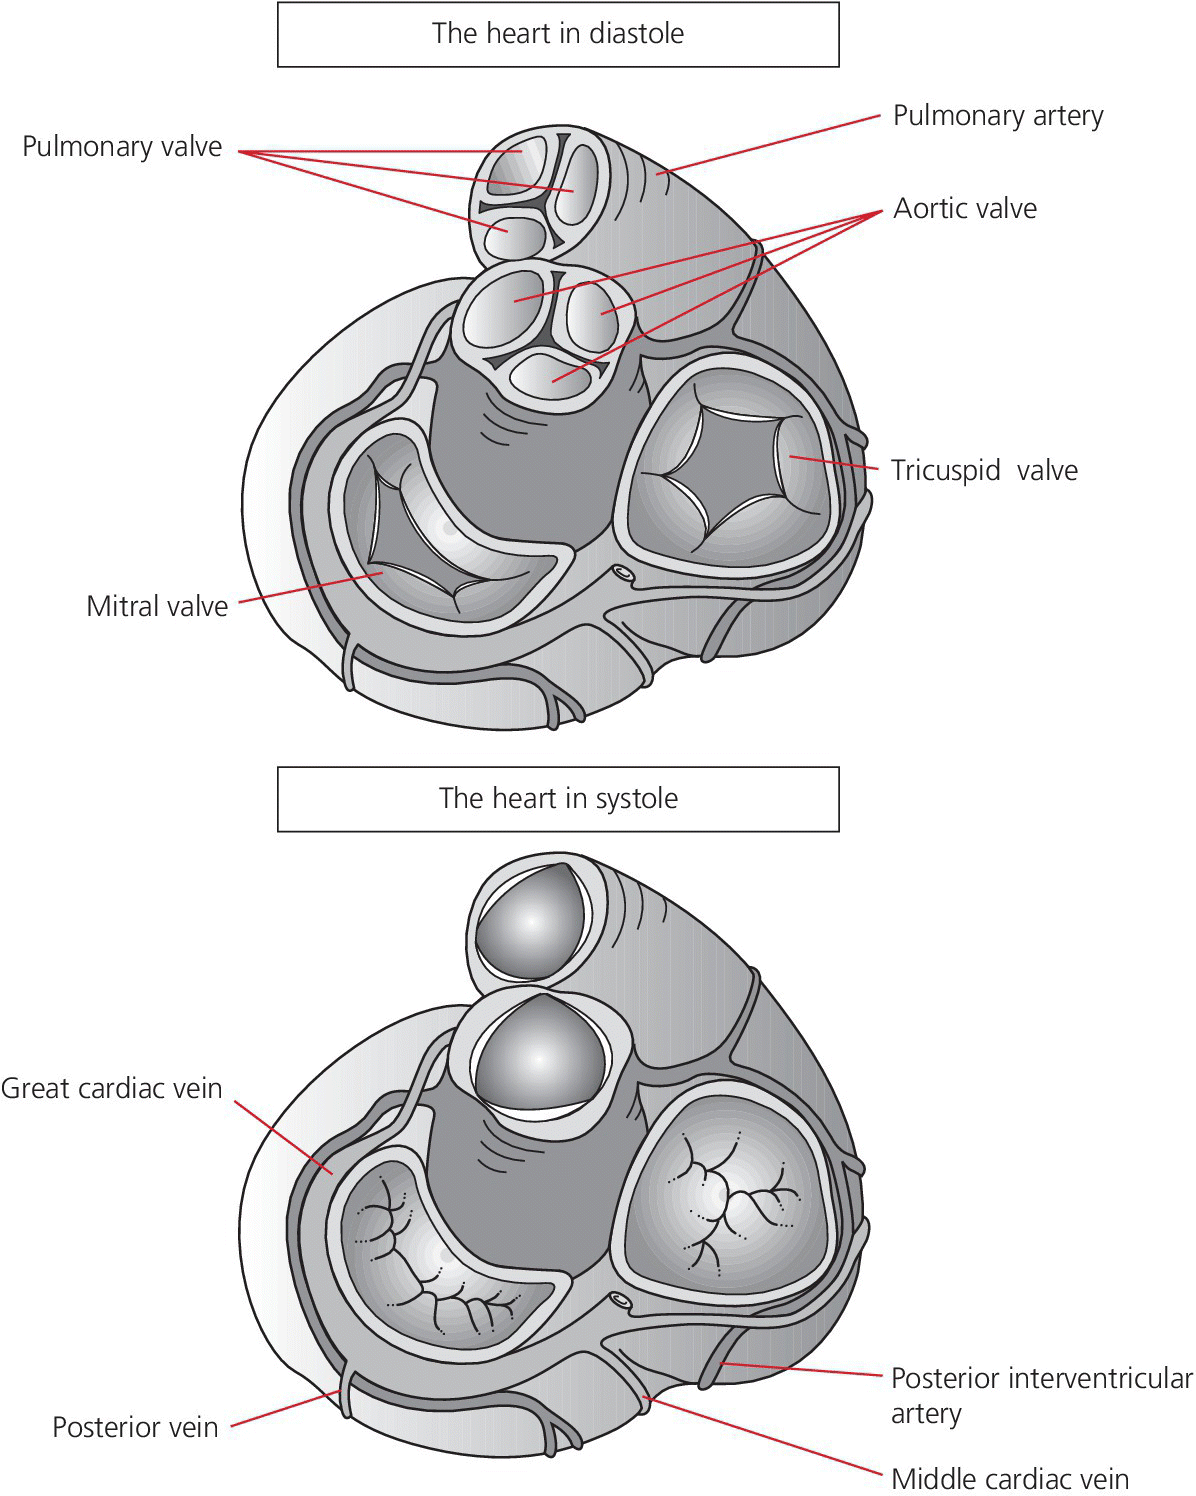
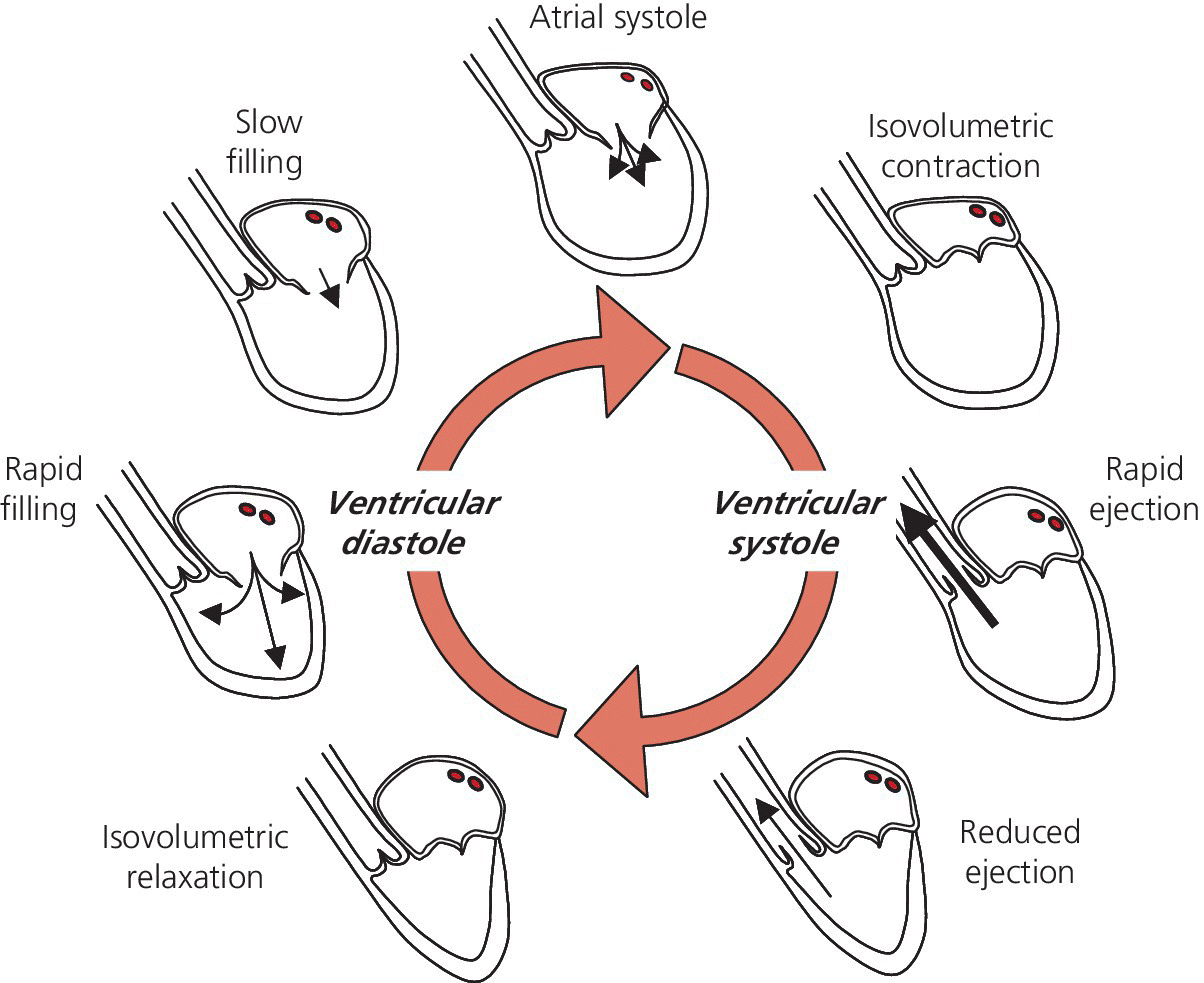
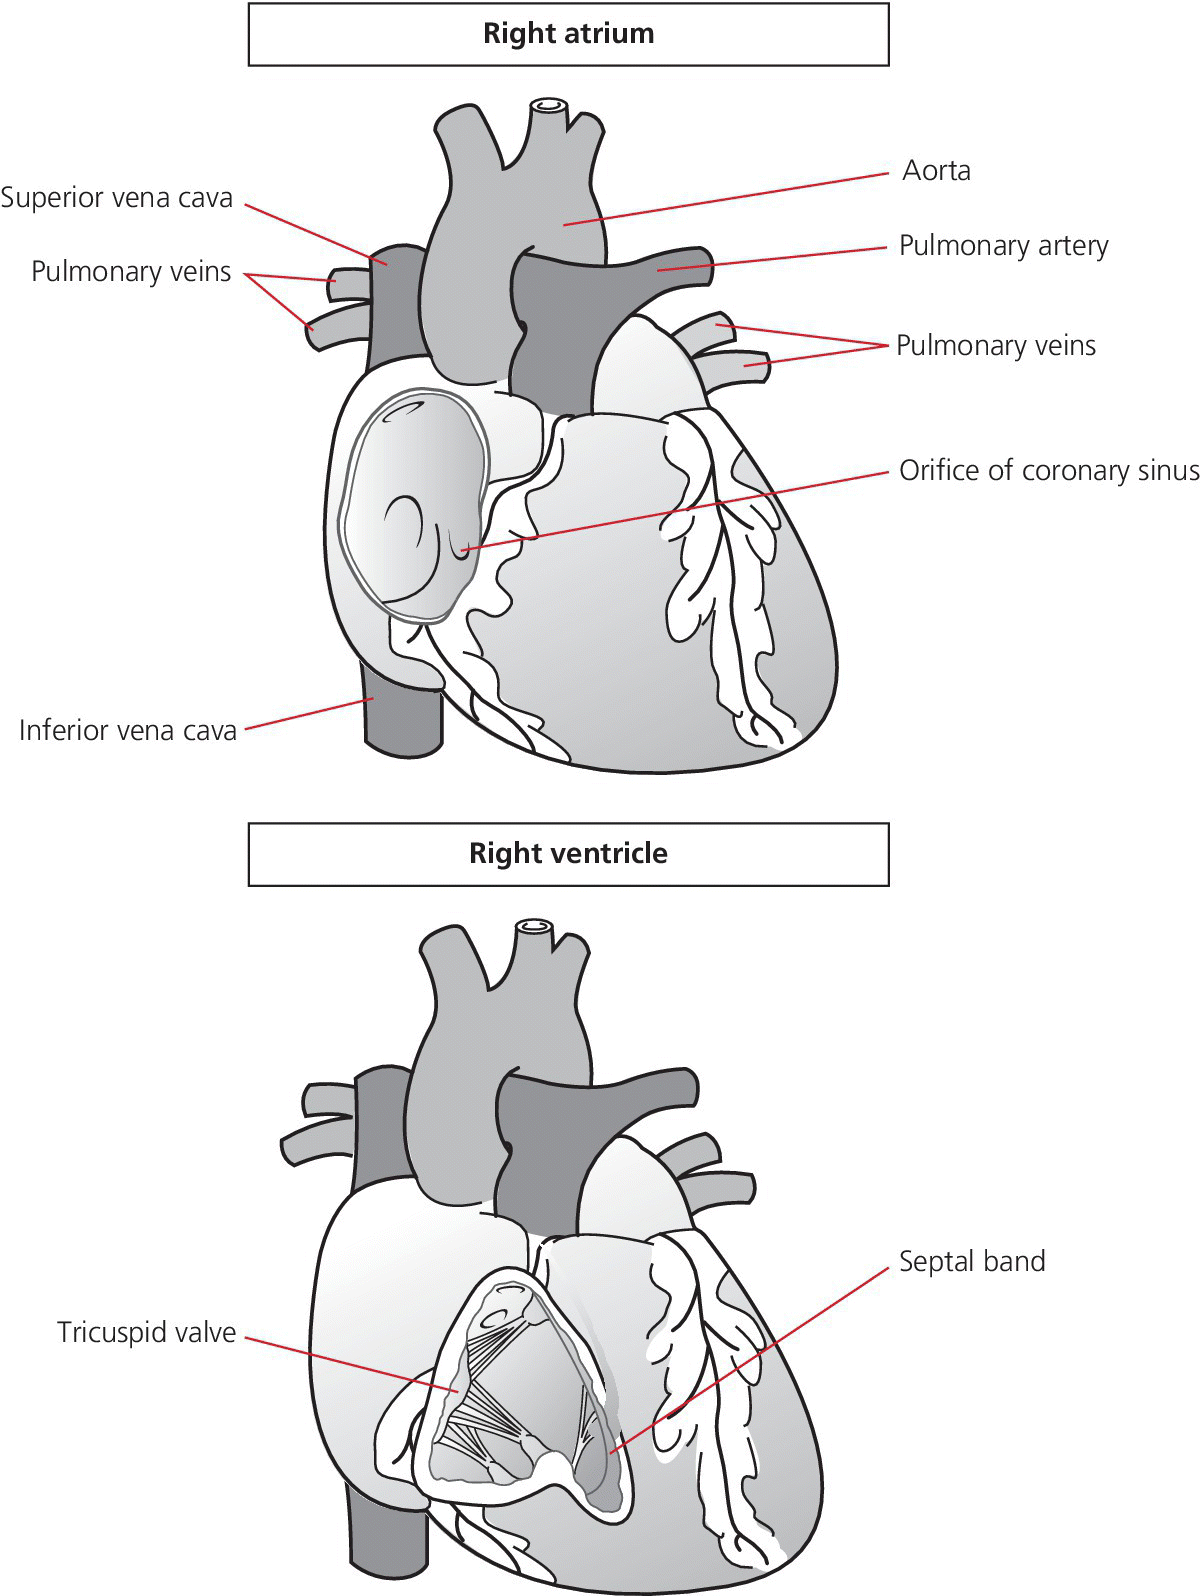
CHAPTER 3 Alison Keenon, Eron D. Crouch, James E. Faber and George A. Stouffer The mechanical events of the cardiac cycle as they occur in series are as follows: right atrium (RA) contracts, left atrium (LA) contracts, left ventricle (LV) begins contraction, mitral valve closes, right ventricle (RV) begins contraction, tricuspid valve closes, pulmonary valve opens, aortic valve opens, aortic valve closes, pulmonary valve closes, tricuspid valve opens, mitral valve opens. The events of the cardiac cycle superimposed on cardiac pressure tracings and an electrocardiogram (ECG) tracing, often called the Wiggers diagram after Dr. Carl Wiggers who first arranged data in this useful manner, is helpful in illustrating the relationship and timing of events in the cardiac cycle to hemodynamic phenomena (a stylized version of a Wiggers diagram is shown in Figure 3.1). Figure 3.1 Wiggers diagram. The cardiac cycle is often divided into systole (ventricular contraction) and diastole (ventricular filling; Figure 3.2). Systole can be further divided into four stages: isovolumetric contraction, rapid ejection, reduced ejection, and isovolumetric relaxation (Figure 3.3). The isovolumic phase of LV contraction is that time in which ventricular pressure is increasing, but is not sufficient to open the aortic valve (Figure 3.1). This phase ends when the aortic valve opens and blood is ejected (ejection phase). On an LV pressure tracing, the onset of ventricular contraction coincides with the R wave on the ECG and is indicated by the earliest rise in pressure after atrial contraction. During ventricular systole, the atrial pressure initially declines. This is thought to be due to stretch of the atria as the base of the heart descends. Following this brief period, atrial pressure progressively increases during the rest of ventricular systole as blood flow into the atria increases. Figure 3.2 Cardiac structures during systole and diastole. Figure 3.3 Mechanical events of the cardiac cycle. Diastole is the period during the cardiac cycle between aortic valve closure and mitral valve closure. A common mistake is to think of diastole as less important than systole, or more inaccurately as merely the absence of systole. Our appreciation of diastole has increased over the years as we have realized the importance of diastolic dysfunction in patients with congestive heart failure. Diastole is commonly divided into three components: rapid filling phase, slow filling phase, and atrial systole (Figure 3.3). A fourth phase of diastole, isovolumic relaxation, is sometimes utilized. This is the period between the closing of the semilunar valve and the opening of the atrioventricular (AV; = mitral and tricuspid) valve. It is very brief and dependent on the relaxation properties of the ventricle. Analysis of this phase is useful experimentally, but has limited application clinically. The rapid filling period occurs immediately on opening of the AV valve. In normal individuals, this phase accounts for the majority of ventricular filling. This phase is characterized by the Y descent on atrial pressure tracings and by a rapid fall (because the ventricle is still relaxing) and then equally rapid rise in ventricular pressure. As the rate of ventricular filling declines, the slow filling phase is entered, following by diastasis (a period when ventricular filling ceases). During the slow filling period in a normal heart, the atrial and ventricular pressures are similar and continued filling of the ventricles is dependent on blood returning from the peripheral circulation (RV) or the lungs (LV). The slow filling period lasts longer than the rapid filling period in the normal heart. In patients with noncompliant ventricles, true diastasis may not occur. Rather, in the setting of elevated atrial pressure, passive blood flow from the atrium to the ventricle continues throughout diastole, with the rate of flow and increase in ventricular pressure dependent on the compliance of the diseased ventricle. Atrial systole is the last phase of diastole. It occurs soon after the beginning of the P wave on the ECG and is concurrent with the A wave on the atrial pressure tracing. In the normal heart at rest, atrial systole contributes relatively little blood to the already filled ventricle. In the diseased heart, or in the normal heart during exercise, the contribution of atrial systole assumes a larger importance. In clinical practice, it is common to see patients with hypertrophied ventricles who do well until they develop atrial fibrillation. The rapid rate and the loss of atrial contraction can then precipitate congestive heart failure. Normal RA pressure is 2–8 mm Hg (Table 3.1) and is determined by central venous pressure (CVP), RA compliance, tricuspid valve function, and RV compliance (Figure 3.4). CVP, and thus RA pressure, is primarily influenced by blood volume, body position, reflex changes in venous tone, skeletal muscle contraction, and the respiratory cycle. Table 3.1 Normal hemodynamic values. Figure 3.4 Schematic of RA and RV. An examination of the RA pressure waveform in a patient in normal sinus rhythm reveals two major positive deflections, the A and V waves, and two negative deflections, the X and Y descents (Figure 3.5
Normal hemodynamics


Cardiac chambers
Right atrium
Pressure measurement
Normal value (mm Hg)
Temporal relations of ECG to mechanical events
Right atrium (RA) Mean pressure
2–8
Onset of P wave to RA contraction is ~60–80 ms
Right ventricle (RV)
Peak‐systolic pressure
End‐diastolic pressure
17–32
2–8
Onset of Q wave to RV contraction is ~65 ms
Pulmonary artery
Mean pressure
Peak‐systolic pressure
End‐diastolic pressure
9–19
17–32
4–13
Onset of Q wave to RV ejection is ~80 ms
Left atrium (PCWP)
Mean pressure
2–12
Onset of P wave to LA contraction is ~85 ms. Onset of P wave on ECG to A wave on PCWP tracing will vary and may be >200 ms
Left ventricle (LV)
Peak‐systolic pressure
End‐diastolic pressure
90–140
5–12
Onset of Q wave to LV contraction is ~52 ms
Aorta
Mean pressure
70–105
Onset of Q wave to LV ejection is ~115 ms 
![]()
Stay updated, free articles. Join our Telegram channel

Full access? Get Clinical Tree


